
 ?Mathematical formulae have been encoded as MathML and are displayed in this HTML version using MathJax in order to improve their display. Uncheck the box to turn MathJax off. This feature requires Javascript. Click on a formula to zoom.
Abstract
This study modifies Kansei engineering by measuring the effect of customer emotional satisfaction from the services provided by logistics service providers on customer loyalty during the Covid-19 pandemic. Kansei engineering modification in this study uses EFA (exploratory factor analysis) analysis in the ServQual dimensions, then CFA (Confirmatory Factor Analysis) is taken to examine the relationship between variables. The object of distributing the questionnaire is 298 respondents who have experience using the services of Indonesian logistics providers. The EFA results on the ServQual dimensions show three new variables besides Kansei’s words: customer satisfaction, commitment, and loyalty. The CFA findings also show that during the Covid-19 pandemic, customer commitment affects customer loyalty. In addition, customer commitment mediates customer satisfaction and customer loyalty. Lastly, customer satisfaction significantly affects customer loyalty.
PUBLIC INTEREST STATEMENT
The discrepancy and distortion of logistics service variables often arise from the voice of consumers in actual conditions. This shows that the freedom of consumers to express their perceptions of the variables needed in Kansei mapping is one of the causes of the discrepancy. This article proposes a modification of Kansei Engineering by combining EFA (Exploration Factor Analysis) and ServQual (Service Quality) to refine Kansei words by classifying Kansei words to find out more clearly and detail customer needs for the quality of logistics services taking into account the Covid-19 pandemic situation. Then CFA (Confirmatory Factor Analysis) is taken to examine the relationship between variables. The modified Kansei engineering used in this study improves the traditional Kansei engineering in terms of the relevance of attributes that arise from emotional customer preferences. The combined use of Kansei word, ServQual, EFA, and CFA has reduced the ambiguity of the results that arise when using traditional Kansei engineering.
1. Introduction
The perception of customer needs in terms of experience with a service or product is a challenge for product or service managers. They should understand customer perceptions of services or products (Hartono, Citation2020). However, knowing and translating perceptions of product quality to customers is not easy. Matsubara and Nagamachi (Citation1997) found a method to grasp and express customer desires, namely the Kansei engineering. Kansei engineering translates affective values into product design parameters using semantic differential parameters (Tanoue, Ishizaka & Nagamachi ., Citation1997). Customer feelings have a significant role in identifying customer satisfaction and loyalty to the experience of using products and services (Restuputri et al., Citation2020). According to Nagamachi (Citation1995), Kansei engineering is an effective method for designing and developing a product or service in expressing customer wants and needs.
Kansei Engineering has been applicable in various case studies in modeling customer emotions as an output of service design. In the Business-to-Customer (B2C) logistics, previous research discussed the satisfaction and loyalty of customers in the context of the Covid-19 pandemic using the Kansei approach (Restuputri et al., Citation2021, Citation2020) indicated that there were discrepancies in several attributes. They are coordination, logistics processes according to the Covid-19 protocol, timely, adequate, and responsive to operational service quality variables. It is visible through the results of research which show that these attributes have no significant effect on customers. The insignificant impact of Covid-19 attributes on customer satisfaction using Kansei Engineering in the logistics process is not relevant to the related studies. A study by Srinivas and Marathe (Citation2021), Sarkis (Citation2020), and Singh et al. (Citation2020) explains that safe logistics activities during the Covid-19 pandemic are prominent to reduce community activities outside. Therefore, health protocols during the Covid-19 should be paid more attention by logistics service providers in the logistics activities to arrive safely and ensure that the goods are contamination-free of the Covid-19 virus.
The discrepancy and distortion of logistics service variables that arise from the voice of consumers with actual conditions in the Covid-19 pandemic situation show that consumer freedom raises necessary variables in the Kansei mapping stage is one of the causes of the discrepancy. Previous studies attempted using other extended Kansei mapping approaches to refine the results from Kansei words to the real aiming problems. Such methods as a combined design structure matrix (Huang et al., Citation2012), Kansei mining system (Jiao et al., Citation2006), and repertory grid approaches (Steinberg et al., Citation2015). Thus, EFA (Exploratory Factor Analysis) and CFA (Confirmatory Factor Analysis) accomplish the Kansei words in this study. ServQual dimensions are then used to classify the Kansei words to find out more clearly and in detail the customer’s wishes on the quality of logistics services by considering the Covid-19 pandemic situation.
This article has six sections in structure. The first one (introduction) explains the background knowledge of the study and finds out the gap between previous studies and the research statement. The second part reviews relevant studies related to the development of the framework. The following summarizes the research methodology, while Section 4 discusses the results. Section 5 depicts the managerial and theoretical implications, followed by the final discussion with conclusions and limitations.
2. Literature review
2.1. Logistics service quality
Logistics involves exchanging information between parties, logistics facilities management such as transportation, warehouses, and others in a logistics company (Novack et al., Citation1992). Every logistics service provider should have technology that can improve company performance, the accuracy of the information used, and reliability in delivery (Chiu, Citation1995; Paul, Moktadir et al., Citation2021). Another study related to logistics services integrity was submitted by Mentzer et al. (Citation1999). They stated that the quality of logistics service is the ability of a company to provide products to customers in the right amount and time according to the previous agreement, good condition, precise, and accurate. Research on service quality is used to capture customer perceptions for service providers to improve service quality according to customer desires. Researchers have embarked on studies to criticize if the service quality model is applicable in service logistics to add customer satisfaction. Logistics service providers must qualify their service to survey customer intention about the logistics services.
In previous studies, service quality is from a physical dimension consisting of timeliness, availability of goods, and condition when they arrive at the customer’s place, affecting customers’ views of logistics service providers. Service quality is initially from a physical dimension consisting of timeliness, goods’ availability, and goods’ condition as it arrives at the customer’s place. These dimensions play a significant part in service-user perspectives on logistics service providers (Bienstock et al., Citation1997; Parasuraman et al., Citation1988). Mentzer et al. (Citation2001) also researched the integrity of logistics services. The results showed that logistics providers could improve relationships between individuals, improve information quality, order procedures, order accuracy, order quality, and order procedures.
2.2. Measurement of logistics service quality
Measuring service quality has now become attention among researchers. However, service quality is still difficult to understand, define and measure, so conceptual models related to service quality and customer satisfaction are rarely explored (Cronin & Taylor, Citation1992). Service quality cannot be measured because there are too many heterogeneities of characteristics and objects. Parasuraman et al., (Citation1988) stated that the service quality measurement model could use ServQual. In carrying out satisfaction or service quality, the ServQual dimension can be a method for classifying and differentiating between service expectations desired by customers and actual service performance. Service providers need to pay attention to the “must-measure” five dimensions. They include the reliability of logistics service providers, the response given by customers to logistics providers, aspects of realized service, logistics provider’s services, staff services to customers, and offered places or facilities for customers (Brady et al., Citation2002). The following () are the five-dimension ServQual service by Parasuraman et al. (Citation1988).
Table 1. Quality dimension instrument
2.3. Logistics service providers
For years, companies have chosen to take activities in logistics services, offering a speed in delivery and accuracy of the goods until they arrived at the customer’s hands safely (McGinnis & Kohn, Citation2002). Because of globalization, market competition has led some companies to develop logistics business strategies to improve services and profits. Collins et al. (Citation2001) define logistics service quality as a stakeholder that offers third parties to use these services to deliver goods to the desired destinations. In addition, logistics service providers offer warehousing and cargo consolidation activities, thus providing benefits for the company, customer satisfaction, and increasing competition among competitors (Lai, Citation2004; Masudin et al., Citation2020). According to Lummus et al. (Citation2001) and Paul et al. (Citation2021), the logistics components are the planning, implementation, control, flow systems of goods, services, and information exchange. The functions of logistics service providers can be categorized into four activities, as shown in .
Table 2. Logistics service provider activities
Delfmann et al. (Citation2002) believed that the quality of logistics services is classified into three groups. The first group, the service provider, functions as a party that only distributes goods related to transportation and warehousing. This provider develops a standardized company and specializes in client satisfaction. In this group, the logistics service provider only runs one of their functions to optimize the services provided to customers. The second group of providers is a combination of service corporations. For example, automotive companies send the goods ordered to the customers until they arrive at their destination. As they do not utilize logistics service providers, the service-giver in the second group set their standards. The third group consists of those who modify their services following clients’ needs. These corporations will play administrative and coordinative roles to qualify their customers’ needs.
2.4. Information systems
In logistics flow activities, companies need to improve the quality of their information because information flows aim to regulate and control the whereabouts of goods. Thus, they are easily tracked, and logistics service providers could evaluate and improve in providing accurate, effective, and accurate information. This statement is evidently in line with a study conducted by Closs et al., (Citation1997). They revealed that the flow of information on logistics services from upstream to downstream is very complicated and involves personnel. Therefore, the information should facilitate all logistics activities to be fast, effective, and efficient. Advances in information technology in logistics management direct service providers to customer service systems by improving better information systems. Logistic information systems at service providers function as electronic pens, data management, data transfer, recording, information exchange, and others (Kubasáková et al., Citation2014; Masudin et al., Citation2021).
Due to the weightiness of data accuracy, the in-proper information in the logistics information system is critical to reflect the suitability of the SIP report with the actual physical condition of the goods. High accuracy in information can reduce errors in the logistics process, problem fast-identification, and quick-delivery information. Data accuracy is the most significant aspect of a logistics information system. Information or data cannot be easily replaced so that managers can make decisions that positively impact the progress of logistics service providers. Logistics information systems are grouped into two categories. The first component is a logistics information system, providing planning applications that contain logistics operations, such as a tracking system to find out the whereabouts of goods from the information center to the customer’s hands. The second component is an information system with financial and administrative data. Logistics information systems can facilitate logistics services by both logistics service providers and customers. In the context of the Covid-19 era, customers can easily access tracking their goods are through an accessible application anywhere (Cai et al., Citation2020).
2.5. Logistics sevices in the context of Covid-19 outbreak
During the current Covid-19 pandemic, logistics service providers need to think about plans and improvements to the delivery system and the condition of goods. Esper (Citation2020) believed that risk mitigations are required for logistics service providers in the current conditions due to the Covid-19 pandemic. Companies must be responsive and fast in making plans and innovations related to logistics because conditions can change quickly. Companies also need to make quick decisions so that logistics companies can survive the current conditions. There have not been many studies examining distribution line decisions to mitigate risks in the logistics sector because, in the current conditions, it can change at any time. As a result, quick in-line decision-making is required. Liu et al. (Citation2019), on the other hand, made a logistics network design model in times of emergency against the current unpredictable COVID-19 pandemic, where he proposed the Vulnerable Infection Recovered model. They stated that this model could be used in response to emergencies to make decisions customer demand at a reasonably low cost. The government, in this case, has a significant role so that the people’s economy is under control. Therefore, the government should solve the current events, namely the Covid-19 pandemic for logistics service providers. As previously done by the government, namely “green subsidies” are recommended to logistics providers to impact the environment positively, improving service quality and customer satisfaction. The design of the logistics structure network has a short time limit, can only be used within a few weeks or months, or the time cannot be determined. It can change at any time, so innovations are needed at the current pandemic relating to delivery activities to anticipate the contamination of the virus during the pandemic (Biswas & Das, Citation2020).
2.6. Kansei engineering
Ishihara et al. (Citation2008) proposed that Kansei Engineering comes from Japanese, which means sensitivity to feelings. Kansei Engineering can develop products based on the customer’s needs through the customer’s emotional feelings. Kansei engineering comes from semantic descriptions analyzed by researchers that customers can describe through emotional feelings poured into writing and images (Chen et al., Citation2015). Kansei engineering is the most effective technique in formulating new service designs to service providers from the customer feel described (Nagamachi et al., Citation1997). depicts the flows of Kansei Engineering for developing a new manufacturing product design.
Figure 1. Kansei engineering processes.

The following are the steps involved in Kansei engineering:
The first step is determining the domain
Collect Kansei words
Carry out the classification and analysis of Kansei
According to the customer, Kansei engineering is a method that can translate feelings, impressions, and messages from the customer experience after using the service. The customer feeling expressed in Kansei’s words will produce a new product or service design desires. Kansei engineering is expected to provide innovations and new solutions to improve existing concepts to follow customers’ wishes that can change with the times. Kansei engineering is based on the subjectivity of the product concept, which in this case is service, so that it can provide the expression of demand that the customer expects by using semantic tools to analyze the desires of the customer (Chen et al., Citation2015; Ishihara et al., Citation2008).
3. Model modification in Kansei engineering
This study was conducted using quantitative research in Indonesian customers of logistics service providers during the Covid-19 pandemic. Kansei engineering combined with EFA (Exploratory Factor Analysis) and CFA (Confirmatory Factor Analysis) techniques were applied in this study. This study carried out a word check on logistics service management during the COVID-19 pandemic using an open questionnaire. This questionnaire would be distributed to 30 respondents who have experience using logistics services during the COVID-19 pandemic. Then, the Kansei words would be obtained from those often written by respondents because they represent feelings. The next stage is grouping the attributes from Kansei words into relevant COVID-19 variables using EFA analysis. Finally, second questionnaires were distributed to 298 respondents to confirm the relationship between the obtained latent variables using CFA. The calculation of the questionnaire at the stage is based on a five-point Likert scale of 1 to 5, with ratings used to strongly disagree (1) to agree (5) strongly.
3.1. Modification of the Kansei engineering model as a maintainable service design
Kansei engineering plays a highly significant role in the service industry. Improvement is by supporting statistical and quality tools in carrying out the Kansei engineering analysis (Hartono, Citation2020). In some cases, however, the customer service attributes and Kansei words do not match each other. These occurrences may result from the ambiguity and complexity of the customer response. So that in identifying Kansei engineering, it is necessary to make improvements for sustainable services. This study provides modifications to improve the Kansei engineering model carried out by previous research by analyzing Kansei words based on the ServQual concept previously described by Parasuraman et al. (Citation1988). The modified Kansei engineering would identify the Kansei word that the researcher has collected by asking the respondent’s opinion first to provide more validity to the decisions taken by researchers in identifying the word Kansei.
figure shows the methodology in formulating Kansei engineering to provide the service design based on the customer needs. It starts with determining the domain and then collects Kansei words. The model is then synthesized after categorizing service attributes. A more in-depth analysis will be conducted by providing better and more detailed confirmation of customer desires for continuous service improvement. The final is the result of Kansei engineering’s proposed service design product.
Figure 2. Kansei engineering methodology.
3.2. Kansei Word Identification
Kansei engineering is a catalyst that can be used in a study to develop new innovative solutions and can be used to improve existing concepts (Schütte et al., Citation2004). This research was conducted by distributing open questionnaires to identify Kansei words in logistics service management from the context of the Covid-19 pandemic. The Kansei words can be found in various sources such as experienced users, internet videos, previous research, television, magazines, questionnaires, and others (Matsubara & Nagamachi, Citation1997). The questionnaire was handed to customers who had used logistical services during the Covid-19 pandemic. Malhotra (Citation2008) stated that the sample size for the trial was only a small part of the sample size ranging from 15 to 30 respondents, so the number of respondents on this questionnaire was set as 30 respondents. Respondents were ordered to describe their use of logistics services during the Covid-19 outbreak. They are also questioned about why they are using the logistics service provider. The Kansei words are obtained from respondents who write the words representing their feelings. Attribute analysis was assisted by the Nvivo 12 to determine the attributes that frequently appeared in the questionnaire. figure depicts the outcome of the Kansei words analysis.
figure shows that seven attributes often appear: protocol, health, delivery, pandemic, service, good, and goods. The font size represents the most commonly used attribute. The larger, the more frequently these characteristics are scribed by respondents. presents the recapitulation of attributes shows based on the analysis of the Nvivo 12 software.
Figure 3. Kansei words.
Table 3. Attribute recapitulation of weight
shows the grouping of Kansei words based on the ServQual service dimensions. It indicates that six attributes have the highest presentation: protocol attributes with 4%, health (3%), delivery (3%), pandemic (4%), service (4%), and good (3%). After collecting the words from respondents, they are arranged according to the ServQual service dimensions.
Table 4. Kansei words grouping based on ServQual dimensions
After grouping the respondents’ words using the Nvivo software into quality dimensions, the Kansei words were obtained by grouping them subjectively with more skilled parties. displays the 30 Kansei words obtained.
Table 5. Kansei words
Table describes the 30 suggestions of Kansei’s first attention. Of the 30 Kansei words obtained, further confirmation by customers is required before being grouped into operational variables. In this context, 30 respondents are ordered to comment on the proposal of those 30 Kansei words. The Guttman scale is utilized to distribute questionnaires via Google Forms. The Guttman scale gives a scale of 1, which means agree, and 0 means disagree. To provide conclusions, using statistical analysis techniques proposed by Bungin (Citation2010). The formula for calculating the percentage on the Guttman scale is as follows:
P = Percentage
F = The frequency of each answer selected
N = total
shows a recapitulation of the results of the questionnaire for confirmation of Kansei words:
Table 6. Recapitulation of Kansei attribute confirmation
shows that there are six attributes that respondents want to eliminate with each percentage of compliance with the Covid-19 protocol (3%), affordable (3%), expert (7%), adequate (53%), branched (3%), informative (3%). After calculating the percentage of each word that the respondent wants to omit, the percentage is then categorized based on the percentage interval according to Bungin (Citation2010), as shown in Table .
Table 7. Removed category
explains that the percentage interval of 51–75% is categorized as more than half of the respondents want the attribute removed because customers disagree that the attribute becomes operational variables. So that adequate attributes are omitted in the previously compiled Kansei words.
3.3. Operational Variable
In this study, the 12 words from Kansei were gathered from 30 questions in a questionnaire that took into account customers’ feelings and their expectations of logistics service providers during the Covid-19 outbreak. Table represents the Kansei words that were applied by grouping the variables.
Table 8. Variable quality of logistics services during the Covid-19 outbreak with Kansei
3.4. EFA (Exploratory factor analysis)
After formulating the identified variables and indicators from Kansei, the next step is to carry out the EFA analysis. EFA is a way to frame latent variables used in the context of correlation patterns (Haig, Citation2005). Henson and Roberts (Citation2006) stated that the EFA method identifies the structure of factors to represent a larger variable. The use of EFA in this Kansei study aims to determine the latent variables obtained from 30 respondents of previous Kansei analyses. depicts the findings of the EFA analysis by SPSS 23.
illustrates the eigenvalues plot, PA (Parallel Analysis), and OC (optimal coordinates) procedures to estimate the three factors formed from the plot. The plot depicts the suitability of the comparison data and shows the shifts from one to two and from two to three. Statistically, these factors gave a significant increase in value (p < 0.001), while the shift in the factor from three to four was not statistically significant because of its value (P-value = 0.9). After analyzing the results of the eigenvalue plot, the next step is to analyze the results of grouping the factors into larger variables that have been determined, as shown in .
Figure 4. The plot of the factor values.
Table 9. Component loading of the three-factor model
In the first factor (as shown in ), 16 items measure the variable “satisfaction”. For the second, eight items measure the “commitment” variable. At the same time, in the third factor, four variables measure the variable “loyalty.” According to Al-Zaru et al. (Citation2020), the allowable factor value was > 0.3. Therefore, the factor analysis shows a good suitability value. However, one item has a factor value < 0.3, namely the PL4 (responsive) as a cut-off item. Table presents a grouping of indicators that form new variables by eliminating PL4 (Responsive).
Table 10. New variable grouping
includes the indicators as well as three new variables: satisfaction (16 indicators), commitment (8 indicators), and loyalty (4 indicators). CFA can then conduct those indicators (Confirmatory Factor Analysis). Smart-PLS software was used to test the effect of customer satisfaction and loyalty on logistics service providers during the Covid-19 pandemic.
4. Conceptual models and hypothesis
Conceptual models describe the relationship between theories or concepts that have been identified as one of the important factors visualized in the form of a conceptual framework. In this study, a developed conceptual model presents the quality of logistics services during the Covid-19 pandemic (). This model accommodates the to-be-tested hypotheses to determine the relationship between the variables. The model depicts the relationship between logistics service provider quality and customer satisfaction and loyalty. In addition, this model would also determine the indicators of the most dominant logistics service providers, which will shape service design innovations. Each of the three variables of the quality of logistical services model during the Covid-19 pandemic had indicators obtained from previous EFA analysis.
shows the relationship between logistics service variables during the Covid-19 pandemic and logistics service attributes during the Covid-19 outbreak and the relationship between logistical elements with the word Kansei throughout the Covid-19 outbreak. The description of the hypotheses is depicted in .
Figure 5. The research framework for logistics services quality throughout the Covid-19 outbreak.
The relationship between customer satisfaction and customer loyalty throughout the Covid-19 outbreak
Logistics service providers constantly strive to develop quality services to fulfill their customers’ requisites. The dissatisfied customers with the service quality, on the other hand, are the result of poor service by providers. Logistics service providers sometimes believe that the services provided are now acceptable to customers and therefore no need to improve the services (Rust & Zahorik, Citation1993). For that reason, logistics service providers need to build a positive image to customers to create a sense of loyalty so customers would appreciate and use the company’s services. As a result, customers would find it difficult to switch to other service providers because customers are satisfied with the services used (Bruhn & Grund, Citation2000). Based on the organizational performance view, Hallowell (Citation1996) believed that improving customer loyalty would benefit the company, including increasing profits. Moreover, it can reduce costs to attract customer attention by advertising or other marketing activities. According to previous research, customer loyalty is determined by the level of satisfaction felt by customers. As a result, this study aims to test the hypothesis of the relationship between customer satisfaction and customer loyalty.
H1: Customer commitment significantly affects customer loyalty to logistics service providers during the Covid-19 pandemic.
There have been some previous reviews about customer relationships and loyalty. According to Luarn and Lin (Citation2003), there is a significant relationship between customer commitment and loyalty. Morgan and Hunt (Citation1994) explained that customer commitment is indispensable for the company because of the creation of customer commitment to the company. Customers would maintain a relationship with the company and keep using the provider’s services because customers have felt comfortable with the services. Customer commitment to the service provider entails a psychological feeling that neither party can control. These feelings arise automatically, in line with the excellent quality of service provided to customers, so that psychological motivation appears to maintain relationships with service providers (Jones et al., Citation2010). As a result, the purpose of this study is to assess the significance of the relationship between customer commitment and customer loyalty. The hypothesis under consideration for the statistical test is:
H2: Commitment significantly affects customer satisfaction and loyalty during the Covid-19 pandemic.
Customer commitment (C) moderates the relationship between customer satisfaction (KP) and customer loyalty (LP)
Customer commitment is the most critical element in sustaining a long-term cooperative relationship between service providers and customers. As a result, it is advantageous for the company to develop customer satisfaction and customer loyalty to obtain customer commitment. Customer commitment depends on the customer’s psychological feelings, namely affective reasons and cost. Both factors would bring an impact on the customer commitment to service providers. Wilson (Citation1995) stated that commitment could strengthen customer loyalty and customer satisfaction because commitment is a dependent variable often used in sales and purchases. Minta (Citation2018) researched how customer commitment affects customer satisfaction and loyalty as a moderating variable. As a result, there is a significant influence on customer satisfaction and loyalty. Thus, this study attempts to test the hypothesis regarding customer commitment as a moderating variable between customer satisfaction and customer loyalty to logistics service providers throughout the Covid-19 outbreak. We posit the third hypothesis:
H3: customer commitment moderates the relationship between customer satisfaction and customer loyalty to logistics service providers during the Covid-19 pandemic
5. Results and discussion
5.1. The pilot test’s validity and reliability test
The validity test was utilized to assess the validity of the indicators in the questionnaire given to 30 respondents. The indicator is categorized as valid if the value of R-count> R-table. The test was carried out using a two-tailed statistical test analysis with a predetermined alpha value of 5%, meaning that the allowed error is 5%, provided that the r value in the table is 0.361. At the same time, the reliability test was used to determine the level of consistency of the questionnaire given to respondents even though the time, place, and situation were different. For example, Ndayizigamiye et al. (Citation2020) stated that the questionnaire is reliable if the Cronbach alpha value was > 0.6. Table shows the validity and reliability of customer satisfaction and loyalty to logistics service providers during the Covid-19 pandemic.
explains that all satisfaction variable indicators are valid because the R-value of customer satisfaction is > from the R-table value (0.361). The indicators that have the highest validity value are S2 and LP1, with an R-value of 0.823. Therefore, all indicators on the satisfaction variable can represent customer feelings so that the reliability test can then be carried out.
Table 11. Hypotheses
explains that all indicators on the commitment variable are valid because the value of R-count of consumer commitment > from the value of R-table (0.361). The indicator that has the highest validity value is C2, with an R-value of 0.831. Thus, all indicators on the commitment variable can represent consumer feelings so that further reliability tests can be carried out.
Table 12. Results of customer satisfaction validity test
indicates that all indicators on the loyalty variable are valid because the value of R-count customer loyalty > from the value of R-table (0.361). The indicator that has the highest validity value is LP3, with an R-value of 0.937. Therefore, all indicators of the loyalty variable could represent consumer feelings so that further reliability tests can be carried out. displays the analysis results of customer satisfaction and loyalty reliability test throughout the Covid-19 outbreak.
Table 13. Customer’s commitment validity test
Table 14. Customer’s loyalty validity test
indicates that all the variables of customer satisfaction and customer loyalty to logistics service providers during the Covid-19 outbreak are reliable with Cronbach alpha value > 0.6. As a result, the questionnaire can be assessed and filled out multiple times. The highest reliability value is found in the customer satisfaction variable with Cronbach alpha value > 0.6 (0.933), so the formal questionnaire can be processed.
5.2. Profile respondents and descriptive statistics
This section presents the number of respondents who have filled out the questionnaire, such as gender, age, education level, and type of work. The questionnaire was distributed to 298 respondents, with the criteria of using logistics service providers at least once during the Covid-19 pandemic. For every indicator, descriptive statistics clarify the average questionnaire results, standard deviations, and minimum and maximum values on the questionnaire.
According to , the male gender accounts for most respondents (51%). For most respondents aged between 21 and 30 years with a percentage value of 62.4%, and the age of respondents at least more than 40 years with a percentage of only 1.3%. In the level of education, the majority of respondents were students with a percentage of 79.9% and for the type of work with the largest percentage are students, because it has a percentage value of 85%, the lowest type of work are housewives with a percentage value of only 1%. After analyzing the respondent’s profile, a descriptive statistical test was carried out, as shown in .
Table 15. Reliability test
Table 16. Respondents profiles
The descriptive statistical test results show the level of the tendency of respondents to the average value of each indicator. The average results of each variable indicator are compared with the interval scale calculated using the scale formula of Dhossche et al. (Citation2002) as follow:
i = interval, K = number of answer choices
The descriptive statistical analysis signifies that the mean value of customer satisfaction is 4.519, with the standard deviation being between 0.607 and 0.827. It means that the respondents provide diverse answers in terms of the customer satisfaction variable. The most varied respondents’ answer is the KP2 indicator because it has the highest standard deviation value of 0.827. shows that the customer satisfaction variable has a high value (4.519) and has an excellent category of an interval scale. It means that customer satisfaction indicators for logistics service providers during the Covid-19 outbreak are classified as very good responses from respondents.
also shows that customer commitment has a mean value of 3.928 with a standard deviation value between 0.750 and 1.155. It means that the respondents respond to the questions regarding customer commitment from different perspectives. The most diverse indicator is A2, with the greatest standard deviation of 1.155. Moreover, considering the interval scale of the commitment variable on a good scale, it means that the indicators of customer commitment to logistics service throughout the Covid-19 outbreak were rated good in the respondents’ perspective.
The third variable shows that the average value of the loyalty variable is 4.268, with the standard deviation value between 0.737 and 0.839. It means that even though there are various responses from respondents, the indicators of the loyalty variable have responded positively. Therefore, from the perspective of customer loyalty variables, the average value of the questionnaire results is on a relatively excellent interval scale. Therefore, according to respondents, we could conclude that the customer loyalty indicators of logistics service during the Covid-19 outbreak are very good ().
Table 17. Descriptive statistics
5.3. Partial least squares—structural equation modeling analysis
PLS-SEM is taken to analyze this research’s inner and outer model. The inner is used to calculate the path among variables (structural models). The variables and their indicators are analyzed using factor analysis in the outer model (Tenenhaus et al., Citation2005). Partial Least Squares—Structural Equation Modeling is a statistical test and tool for explaining the strength of the relationship among variables and indicators. The decision of the method used in this study is based on the research objectives. The main consideration in choosing the partial least square-structural equation modeling (PLS-SEM) method in this study was based on the opinion of (Joseph F Hair et al., Citation2019). They stated that SEM-PLS is needed when the analysis is related to testing the theoretical framework from a predictive perspective or the study being conducted requires a latent score variable for further analysis. This study uses the PLS-SEM to determine whether all interrelated factors affect consumer loyalty. Analysis was conducted to assess each latent variable and identify the main drivers of the construct.
5.4. Path diagram
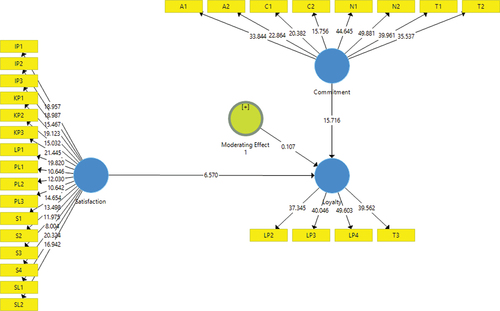
Ramayah et al. (Citation2018) stated that variables and indicators could be distinguished on the smart-PLS diagram in the path diagram. The diagram shows latent variables in the form of a blue circle, and the indicators on the diagram are rectangular in yellow. Furthermore, each indicator is given a code that has been determined by the researcher, making it easier for analysis and consistency.
Hypothetical correlations between variables are shown in . It indicates that each variable has its indicator, a common cause between correlations. The variables and indicators will then be evaluated for reliability, consistency, and convergent validity.
Figure 6. Path diagram.
5.5. Convergent validity
Joe F Hair Jr. et al. (Citation2017) asserted that the validity and reliability test measure correlation in the same construct. Therefore, the outer loading value, AVE (Average Variant Extraction), and reliability values can be calculated to measure the relative size between the construct indicators. Joe F Hair Jr. et al. (Citation2017) also stated that the higher the outer loading value, the more general the construct indicator. Hair et al. (Citation2020) explained that the specified outer loading value was > 0.6, and the AVE (Average Variant Extraction) value of each variable was > 0.5. The following table summarizes the outer loading and AVE (Average Variant Extraction) values for each indicator and variable.
explains that the customer satisfaction variable has an outer loading value between 0.595 and 0.771 and an AVE value of 0.460. Customer loyalty has an outer loading value between 0.829 and 0.865 and an AVE value of 0.723. Customer commitment has an outer loading between 0.686 and 0.849 and an AVE value of 0.632. Finally, the moderation variable SxL has an outer loading value of 1.054 and AVE 1. This value shows the value of outer loading and AVE for customer commitment and customer loyalty variables is valid because the outer loading value on each indicator is> 0.6 and the AVE value for each variable is > 0, 5 (Joe F Hair et al., Citation2011). However, in the customer satisfaction variable, there is an indicator that has an outer loading value of <0.6, namely the PL3 indicator. As a result, these indicators must be further examined using discriminant validity methods, specifically the cross-loading method and the Fornell-Larcker method, to determine whether the indicators on the customer satisfaction variable are feasible enough. Following the validity testing of each indicator and variable, the respective reliability tests were performed. summarizes the results of the reliability calculations for every variable.
Table 18. The validity of indicators and variables
Table 19. Interval scale
Table 20. Recapitulation of test results on cross-loading
Table 21. Reliability Test
presents the Cronbach alpha and composite reliability values. Cronbach alpha value and composite reliability for every variable are considered reliable with values > 0.7 (Masudin et al., Citation2018).
Table 22. R-Square
5.6. Discriminant variable
Discriminant validity is a latent variable to define more variance observed due to errors in the conceptual measurement framework (Fornell & Larcker, Citation1981). In discriminant variables, latent variables can be distinguished from other latent variables because an item must have a higher correlation than other items, which theoretically should not be correlated (Zaiţ & Bertea, Citation2011). Every discriminant variable’s latent variable can be assessed in two ways. The first is to examine the loading factor value for each indicator and analyze the cross-loading so that the determining variable must have a higher value than the indicators in the construct (Trung & Khalifa, Citation2019). The second way is to use the Fornell-Larcker method to assess the discriminant’s validity. The method compares the square root of the AVE value to the correlation of the latent variable constructs. According to Hair et al. (Citation2016), every square root value of the AVE construct must be greater than other latent variable constructs. Table displays the results of the discriminant validity test calculations using the cross-loading and the Fornell-Larcker method.
All indicators in the constructed variable have one correlation only. It is assumed that the value of the loading factor for each construct must be greater than others in the same construct (Sarstedt et al., Citation2016). Further analysis can be carried out using the Fornell Larcker method to test the feasibility of indicators on loading factor, whether it is still usable or not (Fornell & Larcker, Citation1981).
Table depicts that the square root value of AVE is greater than others. The results of the discriminant validity analysis state that there is no problem because each construct variable has the highest value compared to other constructs. For example, some indicators in the customer satisfaction variable show a loading factor value < 0.6. For example, the S4 indicator has a value of 0.566 < 0.6, but the customer satisfaction variable in Fornell-Larcker analysis is 0.795, while other constructs have different values, equals or higher than 0.795; as a result, the indicators on the consumer satisfaction variable can be utilized or, in the other word, feasible.
5.7. Structural model
The structural model describes one or more model construct relationships to be hypothesized (Janadari et al., Citation2016). Structural model analysis is used to predict output data using input data and make predictions to explain the variance of endogenous variables where the R2 is supposed to be higher (Hair et al., Citation2014a). The highest R2 value follows the investigated research areas. For example, in consumer behavior studies, the value of R2 > 0.2 is considered high, while in marketing research, the value of R2 > 0.50 is considered moderate, and R2 > 0.75 is categorized as high (Hair et al., Citation2014b).
Table shows that the customer loyalty variable has an R-Square value of 0.697. This value explains that the customer loyalty variable that can be explained in this study is 69%. The remaining 31% is the contribution of other variables not discussed in this study. After the R-square analysis is carried out, the next step is to analyze the path coefficient to determine the strengths and weaknesses of the relationship between variables. Aside from assessing the structural model using R-square, another technique utilized in this model is the path coefficient. According to Hair et al. (Citation2016), the path coefficient value has a significant correlation if it is close to +1. Moreover, it has a weak relationship if the value is close to −1. Other research conducted by Janadari et al. (Citation2016) states that there are three assessment criteria on the path coefficient, the first is the path coefficient value < 0.15 so that it is considered weak, a value between 0.15 and 0.45 is categorized as moderate, while a value > 0.45 is grouped as strong. Furthermore, suppose the path is in the opposite direction of the hypothesized one. Therefore, the relationship is insignificant. In contrast, the path with a significant value will lead in the hypothesized direction, thus supporting the proposed causal correlation (Hair Jr. et al., Citation2017).
Table shows that two related variables have a strong connection: customer commitment and loyalty. The path coefficient value for the customer satisfaction is 0.632 > 0.45. It has a moderate relationship because of a path coefficient of 0.15 < 0.310 < 0.45. Finally, the moderation variable has a weak relationship because it has a value of 0.004 < 0.15 (Hair et al., Citation2016). Furthermore, the significant path coefficients are identifiable by examining the standard errors with bootstrapping (). According to Hair et al. (Citation2020), the significance test is used to test the impact of exogenous variables on endogenous ones. The criteria in this test use a significance level of 5% using 298 sub-samples to obtain an empirical t value using the statistical test ≥ T-table provisions (Hair et al., Citation2020). Wong (Citation2013) stated that in a study, it was determined that the t statistic was ≥ 1.96. In this study, the t-test was used because the variation in the study population was unknown. In addition to using the t-statistic, analysis was carried out using the P-value, provided that the P-value < sig.0.05 (Hair Jr. et al., Citation2017). Table displays the significance level test results from this research.
Table 23. Path coefficient
Table 24. Bootstrapping analysis
Table 25. Predictive relevant analysis
The hypothesis testing results can be defined as follows:
H1: Customer satisfaction (KP) significantly affects customer loyalty (LP) during the Covid-19 pandemic.
Based on the results of the t-statistic and the P-value of the variable customer satisfaction towards customer loyalty to logistics service providers during the Covid-19 pandemic, it produces a T-statistic value of 15.716 > T-table (1.96), P-value 0.000 < 0.05. Furthermore, the value in the initial sample is positive. Thus, it can be concluded that customer satisfaction with logistics service providers during the Covid-19 pandemic has a significant positive effect on customer loyalty. The results of this study are relevant to other studies in different businesses that use Kansei engineering in the context of the Covid-19 pandemic. Lin et al. (Citation2021) found high-frequency keywords used in most Kansei engineering studies in a cluster about customer satisfaction, loyalty, and customer requirement management. Another study by Burity (Citation2021) also indicated a positive relationship between customer satisfaction and customer loyalty for logistics businesses.
H2: Customer commitment (C) significantly affects customer loyalty (LP) during the Covid-19 pandemic.
Based on the results of the t-statistic and the P-value of the variable consumer commitment to consumer loyalty to logistics service providers during the Covid-19 pandemic, it resulted in a T-statistic value of 6.570 > T-table (1.96), P-value of 0.000 < 0.05. Furthermore, the value in the initial sample is positive. Thus, during the Covid-19 pandemic, customer commitment to logistics service providers positively and significantly impact customer loyalty. This finding indicates that eight indicators of customer commitment play a significant role in four indicators of customer loyalty during the Covid-19 pandemic. This is in line with the findings of some relevant research. For example, Masudin et al. (Citation2020) revealed that customer loyalty was affected by a positive feeling of customers who use humanitarian logistics providers’ service quality. Other relevant studies also indicated that during the Covid-19 outbreak, two of the main drivers of operational challenge were distribution and transportation (Paul et al., Citation2021).
H3: Customer commitment (C) moderates the relationship between customer satisfaction (KP) and customer loyalty (LP)
As the moderating variable between customer satisfaction and consumer loyalty to logistics service providers during the Covid-19 pandemic, the results produce a T-statistic value of 0.107 > T-table (1.96), a P-value of 0.915 > 0.05, and the value in the original sample is positive. Setiawan and Ghozali (Citation2016) stated that a variable has a moderating effect if the coefficient value is negative and significant. Thus, it can be summarized that customer commitment, as a moderating variable between customer satisfaction and customer loyalty to logistics service providers during the Covid-19 pandemic, has a positive and insignificant effect on customer loyalty. In other words, positive customer commitment can erode the relationship between customer satisfaction and loyalty. This finding is different from prior studies conducted in the normal situation before the Covid-19 pandemic. For example, a study by Wu et al. (Citation2012) indicated that customer commitment has a positive and significant effect in moderating the relationship between customer satisfaction and customer loyalty. In the context of the Covid-19 pandemic, customers are more concerned about health protocols so that their satisfaction does not affect loyalty to logistics services. Therefore, their satisfaction with logistics services is not only determined by the attributes of conventional services. However, it is also more determined by the concern of logistics service providers towards the Covid-19 health protocol.
5.8. Predictive relevant
Predictive relevant (Q2) is an effective way as a predictive relevance criterion (Geisser, Citation1975; Stone, Citation1974). This blindfolding-based technique (Q2) omits data for a specific indicator block when estimating the parameters of a model. It then predicts the omitted portion based on the calculated parameters. Thus, predictive relevance (Q2) will indicate how well the empirically collected data can be reconstructed with the help of models and parameters by smart-PLS software (Anderson et al., Citation1994). Table explains that this observation’s predictive relevance (Q2) value is reasonable, with the value of Q2 being 0.496 > 0 (Akter et al., Citation2011).
5.9. Model Fit
Model fit is a method for quantifying the model. The model’s appropriateness is tested based on three parameters: SRMR (Standardized Root Mean Square Residual), the Normed Fit Index (NFI), and the three fit models (bootstrapped-based statistics). The difference between the matrix model and the observed correlation is defined as SRMR. A model can be considered suitable if the SRMR value is < 0.08 (Hu & Bentler, Citation1998). Thus, SRMR can be used to avoid model specification errors. The second suitability index is the normed suitability index (NFI), an additional fit measure used to calculate the Chi-square value of the proposed model. Ramayah et al. (Citation2017) stated that the NFI value improves if it approaches 1.
Table shows the fit model results based on the NFI value. It shows that the NFI value in the estimated model is 0.790, meaning that the model used in this study has a percentage of 79%. Therefore, it indicates that the model is fit because it is more than 50%. In addition, the SRMR value is 0.074 < 0 .08, so the correlation matrix model is considered appropriate. From this model fit, it can be explained that this Kansei modification has been successfully modeled. However, compared with previous studies regarding the analysis of customer satisfaction and loyalty to logistics service providers during the Covid-19 pandemic, the value in the fit model was poor and not feasible. Nevertheless, the modification of Kansei engineering formed in this study has a fit model value.
Table 26. Model fit analysis
6. Managerial implication
The managerial implication aims to contribute to logistics services to logistics service providers in Indonesia to improve their services according to consumer needs. Managerial implications consist of analyzing the research results on the service quality of logistics service providers during the Covid-19 pandemic. This study evaluates previous research in logistics services for logistics service providers during the Covid-19 pandemic using the Kansei engineering method. This study also provides recommendations for improving the quality of logistics services by looking at the value of construction indicators with a high loading factor value. According to consumer needs, several points are recommended for logistics service providers to improve the quality of their services during the Covid-19 pandemic. Some recommendations include attentive staff, staff expertise, easy-to-find, and compliance with the Covid-19 protocol. Furthermore, businesses must regard the employee recruitment process. The recruitment process must be carried out rigorously, objectively, and companies need to gather information about prospective employees regarding their suitability when placed on the job (Gerhart et al., Citation1996; Kepha et al., Citation2014).
Logistics service providers should also care about delivery timeliness. The delivery system from logistics service providers to consumers must pay attention to the Covid-19 protocol and coordinate well. To improve the quality of logistics services, logistics service providers must pay attention to timeliness, according to the agreement from the schedule of goods to the customer. Previous research conducted by Masudin (Citation2013) discussed the relationship between location facilities and service levels using stochastic and deterministic methods. This study can be used as a reference for determining the fastest route so that goods arrive at the customer’s hands more quickly. Customers expect that logistics service providers can improve the quality of their information, have the quality of information related to tracking goods and others that are accurate, and provide information quickly and on time. Customers can thus track the location of their goods. The perceived economic leverage of logistics services is improving from time to time. The increase of financial performance related to efficiency and transparency of service provider information is considered important for customers. Therefore, service providers must manage the exchange of logistics information effectively and efficiently to improve company performance (Loebbecke & Powell, Citation1998; Paul, Chowdhury, Moktadir et al., Citation2021).
Logistics service providers are expected to have branches in each area to be easily accessible to customers. The process of sending goods to their destination must be carried out systematically so that errors do not occur, such as goods arriving at customers are being damaged, delivery errors occurring, and other possible events. It also impends customer satisfaction and loyalty to logistics service providers. Therefore, service providers need to increase the company’s efficiency by providing branches in several areas for easy and quick access to customers (Athanassopoulos & Curram, Citation1996). Athanassopoulos (Citation1997) believed that providing branches in several regions increased costs incurred for the company; this was directly proportional to customer interest, which positively impacted the company’s economy. Customer satisfaction is thought to boost a company’s finances. The more the company improves service quality, the greater the profit (Shahed et al., Citation2021; Yu, Citation2007).
During the Covid-19 pandemic, customers expect logistics service providers to comply with and implement the COVID-19 protocol. Staff must comply with this protocol so that the logistics process from upstream to downstream also needs and applies the covid-19 procedures to avert covid-19 virus transmission that customers are concerned. The rulers have issued regulations requiring businesses to implement health protocols. The government has also asked companies’ employees to wear masks and gloves to avoid direct contamination with goods. Companies are required to prevent the spread of the virus and carry out a swab test regularly periodically to staff. In addition, companies are also required to provide facilities for their employees to wash hands easier so that the potential for the spread of Covid-19 can be reduced or even avoided (Heyd et al., Citation2020; Sohrabi et al., Citation2020).
7. Theoretical implications
This study uses Modified-Kansei engineering to measure the emotional satisfaction effects of customers from the services presented by logistics service providers on customer loyalty during the Covid-19 pandemic. Kansei engineering in this study uses an open questionnaire for respondents to express their perception of the logistics services and is clustered into Kansei words. This technique is believed to be realistic in approaching real conditions when determining attributes of a wide range of practices (Roy et al., Citation2009). Furthermore, customers’ emotional preferences using Kansei engineering could be an excellent part of other approaches such as the analytic hierarchy process (AHP; Zuo & Wang, Citation2020), Kano (Restuputri et al., Citation2020), and fuzzy techniques (Liu et al., Citation2019).
The modified Kansei engineering used in this study improves the traditional Kansei engineering in terms of the relevance of attributes that arise from emotional customer preferences. The combined use of Kansei word, ServQual, explanatory factor analysis (EFA), and confirmatory factor analysis (CFA) has reduced the ambiguity of the results that arise when using traditional Kansei engineering. For example, research conducted by Restuputri et al. (Citation2021) using traditional Kansei engineering brings up less relevant attributes to the existing reality. By using modified Kansei engineering, the irrelevant attributes that arise can be reduced from the EFA process by clustering and elimination. Thus, this proposed approach would enrich the existing knowledge about Kansei engineering.
8. Conclusion
This study proposed Kansei engineering modification by combining descriptive factor analysis (EFA) and confirmatory factor analysis (CFA) to measure customer perception on logistics service quality in the context of the Covid-19 pandemic. The results of this study indicate that customers satisfaction affects customer loyalty significantly. One of customer satisfaction preferences for logistics service providers is to provide Covid-19 health protocols to reduce virus transmission through logistics processes. This study found that customer commitment positively and significantly impacts customer loyalty. Morever, this study also shows that customer commitment moderates the relationship between customer satisfaction and loyalty by weakening it. This means that customer concerns about the Covid-19 health protocol have reduced the relationship between satisfaction and loyalty. This finding indicates that customers’ concern about Covid-19 health protocol on logistics service quality is critical. Thus, the stakeholders’ policies, such as logistics providers and the government, should ensure the implementation of the Covid-19 health protocol along the supply chain. This study shows that personnel and leadership of logistics service providers have an essential role in customer satisfaction and loyalty, so further research can continue this model framework by involving leadership initiative and employee recruitment policy variables.
Acknowledgements
We would like to thank the reviewers for their appreciated and exceptional contribution by providing critical feedback and comments to improve the manuscript. Furthermore, we want to thank the editors and editor-in-chief for their encouragement and background in keeping the paper at this level of quality. Eventually, we send a thank you to LPDP, the Kemdikbud of the Republic of Indonesia for the WCP program, the University of Muhammadiyah Malang, and the Universiti Malaysia Sarawak for the support in completing the research.
Disclosure statement
No potential conflict of interest was reported by the author(s).
Additional information
Notes on contributors
Ilyas Masudin
Ilyas Masudin is a Professor of logistics and supply chain at Industrial Engineering department, University of Muhammadiyah Malang, Indonesia. His research interests include logistics optimization and supply chain management.
Dian Palupi Restuputri
Dian Palupi Restuputri is a senior lecturer at Industrial Engineering department at the University of Muhammadiyah Malang. Her research interests are ergonomics and human factor engineering.
Tri Ratna Indriani
Tri Ratna Indriani is a researcher at Industrial Engineering department at the University of Muhammadiyah Malang. Her research interests are statistics, logistics and ergonomics.
Evan Lau
Evan Lau is an Associate Professor and Managing Editor for International Journal of Business and Society in Faculty of Economics and Business, Universiti Malaysia Sarawak.
Widayat Widayat
Widayat Widayat is an Associate Professor at Management department, University of Muhammadiyah Malang, Indonesia. His research interests are business management, marketing and operations management.
References
- Akbar, M. M., & Parvez, N. (2009). Impact of service quality, trust, and customer satisfaction on customers loyalty. ABAC Journal, 29(1 1–38 www.assumptionjourna.au.edu/index.php/abacjournal/article/view/526).
- Akter, S., D’ambra, J., & Ray, P. (2011 An evaluatio of PLS based complex models: the roles of power analysis predictive relevance and GOF index 7th Americas Conference on Information Systems 4-7 August (AIS Electonic Lib) Michigan). .
- Al-Zaru, I. M., Hayajneh, A. A., & Al-Dwaikat, T. (2020). Psychometric properties of the Arabic version of the cardiac depression scale tested on Jordanian patients with cardiovascular diseases. BMC Psychiatry, 20(1), 1–8. https://doi.org/10.1186/s12888-020-02651-8
- Anderson, E. W., Fornell, C., & Lehmann, D. R. (1994). Customer satisfaction, market share, and profitability: Findings from Sweden. Journal of Marketing, 58(3), 53–66. https://doi.org/10.1177/002224299405800304
- Athanassopoulos, A. D. (1997). Service quality and operating efficiency synergies for management control in the provision of financial services: Evidence from Greek bank branches. European Journal of Operational Research, 98(2), 300–313. https://doi.org/10.1016/S0377-2217(96)00349-9
- Athanassopoulos, A. D., & Curram, S. P. (1996). A comparison of data envelopment analysis and artificial neural networks as tools for assessing the efficiency of decision making units. Journal of the Operational Research Society, 47(8), 1000–1016. https://doi.org/10.1057/jors.1996.127
- Beatson, A., Lings, I., & Gudergan, S. (2008). Service staff attitudes, organisational practices and performance drivers. Journal of Management and Organization, 14(2), 168–179. https://doi.org/10.5172/jmo.837.14.2.168
- Bienstock, C. C., Mentzer, J. T., & Bird, M. M. (1997). Measuring physical distribution service quality. Journal of the Academy of Marketing Science, 25(1), 31. https://doi.org/10.1007/BF02894507
- Biswas, T. K., & Das, M. C. (2020). Selection of the barriers of supply chain management in Indian manufacturing sectors due to COVID-19 impacts. Operational Research in Engineering Sciences: Theory and Applications, 3(3), 1–12 https:///doi.org/10.31181/oresta2030301b.
- Brady, M. K., Cronin, J. J., Jr, & Brand, R. R. (2002). Performance-only measurement of service quality: A replication and extension. Journal of Business Research, 55(1), 17–31. https://doi.org/10.1016/S0148-2963(00)00171-5
- Bruhn, M., & Grund, M. A. (2000). Theory, development and implementation of national customer satisfaction indices: The Swiss Index of Customer Satisfaction (SWICS). Total Quality Management, 11(7), 1017–1028. https://doi.org/10.1080/09544120050135542
- Bungin, H. (2010). Burhan.(2010). Metode Penelitian Kuantitatif. Kencana Prenada Media Group.
- Burity, J. (2021). The importance of logistics efficiency on customer satisfaction. Journal of Marketing Development and Competitiveness, 15(3), 26–35 https://doi.org/10.33423/jmdc.v15i3.
- Cai, Q., Yang, M., Liu, D., Chen, J., Shu, D., Xia, J., … Yang, Y. (2020). Experimental treatment with favipiravir for COVID-19: An open-label control study. Engineering, 6(10), 1192–1198. https://doi.org/10.1016/j.eng.2020.03.007
- Chen, M.-C., Chang, K.-C., Hsu, C.-L., & Xiao, J.-H. (2015). Applying a Kansei engineering-based logistics service design approach to developing international express services. International Journal of Physical Distribution & Logistics Management, 45(6), 618–646. https://doi.org/10.1108/IJPDLM-10-2013-0251
- Chen, M.-C., Hsu, C.-L., Chang, K.-C., & Chou, M.-C. (2015). Applying Kansei engineering to design logistics services–A case of home delivery service. International Journal of Industrial Ergonomics, 48 July 2015 , 46–59. https://doi.org/10.1016/j.ergon.2015.03.009
- Chiu, H. N. (1995). The integrated logistics management system: A framework and case study. International Journal of Physical Distribution & Logistics Management 25 6 doi:https://doi.org/10.1108/09600039510093249 .
- Chow, I. H.-S., Lo, T. W.-C., Sha, Z., & Hong, J. (2006). The impact of developmental experience, empowerment, and organizational support on catering service staff performance. International Journal of Hospitality Management, 25(3), 478–495. https://doi.org/10.1016/j.ijhm.2005.03.002
- Closs, D. J., Goldsby, T. J., & Clinton, S. R. (1997). Information technology influences on world class logistics capability. International Journal of Physical Distribution & Logistics Management, 27(1), 4–17. https://doi.org/10.1108/09600039710162259
- Collins, A., Henchion, M., & O’Reilly, P. (2001). Logistics customer service: Performance of Irish food exporters. International Journal of Retail & Distribution Management, 29(1), 6–15. https://doi.org/10.1108/09590550110366299
- Cronin, J. J., Jr, & Taylor, S. A. (1992). Measuring service quality: A reexamination and extension. Journal of Marketing, 56(3), 55–68. https://doi.org/10.1177/002224299205600304
- Delfmann, W., Albers, S., & Gehring, M. (2002). The impact of electronic commerce on logistics service providers. International Journal of Physical Distribution & Logistics Management, 32(3), 203–222. https://doi.org/10.1108/09600030210426539
- Dhossche, D., Ferdinand, R., van der Ende, J., Hofstra, M., & Verhulst, F. (2002). Diagnostic outcome of self-reported hallucinations in a community sample of adolescents. Psychological Medicine, 32(4), 619–627. https://doi.org/10.1017/S003329170200555X
- Esper, T. L. (2020). Supply chain management amid the Coronavirus pandemic. Journal of Public Policy & Marketing 40 1 , 0743915620932150 https://doi.org/10.1177/0743915620932150.
- Fornell, C., & Larcker, D. F. (1981). Evaluating structural equation models with unobservable variables and measurement error. Journal of Marketing Research, 18(1), 39–50. https://doi.org/10.1177/002224378101800104
- Geisser, S. (1975). The predictive sample reuse method with applications. Journal of the American Statistical Association, 70(350), 320–328. https://doi.org/10.1080/01621459.1975.10479865
- Gerhart, B., Trevor, C. O., & Graham, M. E. (1996). New directions in compensation research: Synergies, risk, and survival. Research in Personnel and Human Resources Management, 14 August 1995 , 143–204 https://hdl.handle.net/1813/77077.
- Geyskens, I., Steenkamp, J.-B. E., Scheer, L. K., & Kumar, N. (1996). The effects of trust and interdependence on relationship commitment: A trans-Atlantic study. International Journal of Research in Marketing, 13(4), 303 doi:https://doi.org/10.1016/50167-8116(96)00006-7.
- Gummesson, E. (1998). Productivity, quality and relationship marketing in service operations Handbuch Dienstleistungsmanagement (pp. 843–864). Springer.
- Haig, B. D. (2005). Exploratory factor analysis, theory generation, and scientific method. Multivariate Behavioral Research, 40(3), 303–329. https://doi.org/10.1207/s15327906mbr4003_2
- Hair Jr, J. F., Jr, Matthews, L. M., Matthews, R. L., & Sarstedt, M. (2017). PLS-SEM or CB-SEM: Updated guidelines on which method to use. International Journal of Multivariate Data Analysis, 1(2), 107–123. https://doi.org/10.1504/IJMDA.2017.10008574
- Hair, J. F., Jr, Howard, M. C., & Nitzl, C. (2020). Assessing measurement model quality in PLS-SEM using confirmatory composite analysis. Journal of Business Research, 109 (March 2020) , 101–110. https://doi.org/10.1016/j.jbusres.2019.11.069
- Hair, J. F., Jr, Hult, G. T. M., Ringle, C., & Sarstedt, M. (2016). A primer on partial least squares structural equation modeling. Sage publications.
- Hair, J. F., Ringle, C. M., & Sarstedt, M. (2011). PLS-SEM: Indeed a silver bullet. Journal of Marketing Theory and Practice, 19(2), 139–152. https://doi.org/10.2753/MTP1069-6679190202
- Hair, J. F., Risher, J. J., Sarstedt, M., & Ringle, C. M. (2019). When to use and how to report the results of PLS-SEM. European Business Review, 31(1), 2–24. https://doi.org/10.1108/EBR-11-2018-0203
- Hair, J. F., Jr, Sarstedt, M., Hopkins, L., & Kuppelwieser, V. G. (2014a). Partial least squares structural equation modeling (PLS-SEM):A useful tool for family business researchers. Journal of Family Business Strategy 5 (1) 105–15 doi:https://doi.org/10.1016/j.jfbs.2014.01.002 .
- Hair, J. F., Jr, Sarstedt, M., Hopkins, L., & Kuppelwieser, V. G. (2014b). Partial least squares structural equation modeling (PLS-SEM): An emerging tool in business research. European Business Review 26 (2) 106–121 doi:https://doi.org/10.1018/EBR-10-2013-0128 .
- Hallowell, R. (1996). The relationships of customer satisfaction, customer loyalty, and profitability: An empirical study. International Journal of Service Industry Management, 7(4), 27–42. https://doi.org/10.1108/09564239610129931
- Hartono, M. (2020). The modified Kansei engineering-based application for sustainable service design. International Journal of Industrial Ergonomics, 79 (September 2020) , 102985. https://doi.org/10.1016/j.ergon.2020.102985
- Henson, R. K., & Roberts, J. K. (2006). Use of exploratory factor analysis in published research: Common errors and some comment on improved practice. Educational and Psychological Measurement, 66(3), 393–416. https://doi.org/10.1177/0013164405282485
- Heyd, C. P., Desiato, V. M., Nguyen, S. A., O’Rourke, A. K., Clemmens, C. S., Awad, M. I., Worley, M. L., & Day, T. A. (2020). Tracheostomy protocols during COVID -19 pandemic. Head & Neck, 42(6), 1297–1302. https://doi.org/10.1002/hed.26192
- Hu, L.-T., & Bentler, P. M. (1998). Fit indices in covariance structure modeling: Sensitivity to underparameterized model misspecification. Psychological Methods, 3(4), 424. https://doi.org/10.1037/1082-989X.3.4.424
- Huang, Y., Chen, C.-H., & Khoo, L. P. (2012). Kansei clustering for emotional design using a combined design structure matrix. International Journal of Industrial Ergonomics, 42(5), 416–427. https://doi.org/10.1016/j.ergon.2012.05.003
- Ishihara, S., NAGAMACHI, M., SCHÜTTE, S., & EKLUND, J. (2008). Affective meaning: The kansei engineering approach product experience (pp. 477–496). Elsevier.
- Ishizaka Kenji, Nagamachi Mitsuo, Tanoue, Chitoshi, et al. (1997). Kansei Engineering: A study on perception of vehicle interior image. International Journal of Industrial Ergonomics, 19(2), 115–128. https://doi.org/10.1016/S0169-8141(96)00008-X
- Jacoby, J., & Kyner, D. B. (1973). Brand loyalty vs. repeat purchasing behavior. Journal of Marketing Research, 10(1), 1–9. https://doi.org/10.1177/002224377301000101
- Janadari, M., Sri Ramalu, S., & Wei, C. (2016). Evaluation of measurment and structural model of the reflective model constructs in PLS–SEM The 6th International Symposium Oluvil, Sri Lanka (South Eastern University of Sri Lanka)pp. 20–21 .
- Jiao, J., Zhang, Y., & Helander, M. (2006). A Kansei mining system for affective design. Expert Systems with Applications, 30(4), 658–673. https://doi.org/10.1016/j.eswa.2005.07.020
- Jones, T., Fox, G. L., Taylor, S. F., & Fabrigar, L. R. (2010). Service customer commitment and response. Journal of Services Marketing, 24(1), 16–28. https://doi.org/10.1108/08876041011017862
- Juga, J., Juntunen, J., & Grant, D. B. (2010). Service quality and its relation to satisfaction and loyalty in logistics outsourcing relationships. Managing Service Quality: An International Journal, 20(6), 496–510 doi:https://doi.org/10.1108/09604521011092857.
- Kanter, R. M. (1968). Commitment and social organization: A study of commitment mechanisms in utopian communities. American Sociological Review, 33(4), 499–517. https://doi.org/10.2307/2092438
- Kepha, O., Mukulu, E., & Waititu, G. A. (2014). The influence of recruitment and selection on the performance of employees in research institutes in Kenya. International Journal of Science and Research, 3(5), 132–138 https://ijsr.net/paper_id=12041401.
- Kubasáková, I., Kampf, R., & Stopka, O. (2014). Logistics information and communication technology. Communications-Scientific Letters of the University of Zilina, 16(2), 9–13. https://doi.org/10.26552/com.C.2014.2.9-13
- Lai, K.-H. (2004). Service capability and performance of logistics service providers. Transportation Research Part E: Logistics and Transportation Review, 40(5), 385–399. https://doi.org/10.1016/j.tre.2004.01.002
- Lin, S., Shen, T., & Guo, W. (2021). Evolution and emerging trends of Kansei engineering: A visual analysis based on citespace. IEEE Access, 9 (1) , 111181–111202. https://doi.org/10.1109/ACCESS.2021.3102606
- Liu, S.-F., Hsu, Y.-C., & Tsai, H.-C. (2019). Development of a new cultural design process using Kansei engineering and fuzzy techniques: A case study in Mazu crown design. International Journal of Clothing Science and Technology, 31(5), 663–684. https://doi.org/10.1108/IJCST-12-2017-0183
- Loebbecke, C., & Powell, P. (1998). Competitive advantage from IT in logistics: The integrated transport tracking system. International Journal of Information Management, 18(1), 17–27. https://doi.org/10.1016/S0268-4012(97)00037-6
- Luarn, P., & Lin, -H.-H. (2003). A customer loyalty model for e-service context. J. Electron. Commerce Res, 4(4), 156–167 www.jecr.org/sites/default/files/04_04_p03_0.pdf.
- Lummus, R. R., Krumwiede, D. W., & Vokurka, R. J. (2001). The relationship of logistics to supply chain management: Developing a common industry definition. Industrial Management & Data Systems, 101(8), 426–432. https://doi.org/10.1108/02635570110406730
- Malhotra, N. 2008. Essentials of marketing: An applied orientation Pearson Education. Randle, WM (1995). Delivering the future: Redefining the role of banks in new competitive environment. Bank.
- Marakanon, L., & Panjakajornsak, V. (2017). Perceived quality, perceived risk and customer trust affecting customer loyalty of environmentally friendly electronics products. Kasetsart Journal of Social Sciences, 38(1), 24–30.
- Martínez, R., & Rodríguez, J. F. (1997). Quality services model oriented to customers. Computers & Industrial Engineering, 33(1–2), 153–156. https://doi.org/10.1016/S0360-8352(97)00063-6
- Masudin, I. (2013). Facility location modeling in multi-echelon distribution system: A case study of Indonesian Liquefied petroleum gas supply chain. Aceh International Journal of Science and Technology, 2(1), 37–43 doi:https://doi.org/10.13170/aijst.2.1.595.
- Masudin, I., Lau, E., Safitri, N. T., Restuputri, D. P., & Handayani, D. I. (2021). The impact of the traceability of the information systems on humanitarian logistics performance: Case study of Indonesian relief logistics services. Cogent Business & Management, 8(1), 1906052. https://doi.org/10.1080/23311975.2021.1906052
- Masudin, I., Safitri, N. T., Restuputri, D. P., Wardana, R. W., & Amallynda, I. (2020). The effect of humanitarian logistics service quality to customer loyalty using Kansei engineering: evidence from Indonesian logistics service providers. Cogent Business & Management, 7(1), 1826718. https://doi.org/10.1080/23311975.2020.1826718
- Masudin, I., Wastono, T., & Zulfikarijah, F. (2018). The effect of managerial intention and initiative on green supply chain management adoption in Indonesian manufacturing performance. Cogent Business & Management, 5(1), 1485212. https://doi.org/10.1080/23311975.2018.1485212
- Matsubara, Y., & Nagamachi, M. (1997). Hybrid Kansei engineering system and design support. International Journal of Industrial Ergonomics, 19(2), 81–92. https://doi.org/10.1016/S0169-8141(96)00005-4
- McGinnis, M. A., & Kohn, J. W. (2002). Logistics strategy—revisited. Journal of Business Logistics, 23(2), 1–17. https://doi.org/10.1002/j.2158-1592.2002.tb00023.x
- Mentzer, J. T., Flint, D. J., & Hult, G. T. M. (2001). Logistics service quality as a segment-customized process. Journal of Marketing, 65(4), 82–104. https://doi.org/10.1509/jmkg.65.4.82.18390
- Mentzer, J. T., Flint, D. J., & Kent, J. L. (1999). Developing a logistics service quality scale. Journal of Business Logistics, 20(1.1999 1–68 http://citeseerx.ist.psu.edu/viewdoc/download?doi=10.1.1.130.3942&rep=rep1&type=pdf).
- Meyer, J. P., & Allen, N. J. (1991). A three-component conceptualization of organizational commitment. Human Resource Management Review, 1(1), 61–89. https://doi.org/10.1016/1053-4822(91)90011-Z
- Minta, Y. (2018). Link between satisfaction and customer loyalty in the insurance industry: Moderating effect of trust and commitment. Journal of Marketing Management, 6(2), 25–33 https://doi.org/10.15640/jmm.v6n2a3.
- Morgan, R. M., & Hunt, S. D. (1994). The commitment-trust theory of relationship marketing. Journal of Marketing, 58(3), 20–38. https://doi.org/10.1177/002224299405800302
- Nagamachi, M. (1995). Kansei engineering: A new ergonomic consumer-oriented technology for product development. International Journal of Industrial Ergonomics, 15(1), 3–11. https://doi.org/10.1016/0169-8141(94)00052-5
- Ndayizigamiye, P., Kante, M., & Shingwenyana, S. (2020). An adoption model of mHealth applications that promote physical activity. Cogent Psychology, 7(1), 1764703. https://doi.org/10.1080/23311908.2020.1764703
- Novack, R. A., Rinehart, L. M., & Wells, M. V. (1992). Rethinking concept foundations in logistics management. Journal of Business Logistics, 13(2), 233 https://www.proquest.com/openview/85be26a6665a96268574d5a31675560a/1?pq-origsite=gscholar&cbl=36584.
- Parasuraman, A., Zeithaml, V. A., & Berry, L. L. (1988). Servqual: A multiple-item scale for measuring consumer perc. Journal of Retailing, 64(1), 12.
- Paul, S. K., Chowdhury, P., Chowdhury, M. T., Chakrabortty, R. K., & Moktadir, M. A. (2021). Operational challenges during a pandemic: An investigation in the electronics industry. The International Journal of Logistics Management, Ahead-of-print(ahead-of-print). https://doi.org/10.1108/IJLM-05-2021-0307
- Paul, S. K., Chowdhury, P., Moktadir, M. A., & Lau, K. H. (2021). Supply chain recovery challenges in the wake of COVID-19 pandemic. Journal of Business Research, 136 (November 2021) , 316–329. https://doi.org/10.1016/j.jbusres.2021.07.056
- Paul, S. K., Moktadir, M. A., & Ahsan, K. (2021). Key supply chain strategies for the post-COVID-19 era: Implications for resilience and sustainability. The International Journal of Logistics Management, Ahead-of-print(ahead-of-print). https://doi.org/10.1108/IJLM-04-2021-0238
- Paul, S. K., Moktadir, M. A., Sallam, K., Choi, T.-M., & Chakrabortty, R. K. (2021). A recovery planning model for online business operations under the COVID-19 outbreak. International Journal of Production Research, 1–23 doi:10.1080/00207543.2021.1976431 .
- Ramayah, T., Cheah, J., Chuah, F., Ting, H., & Memon, M. (2018). . Partial least squares structural equation modeling (PLS-SEM) using smartPLS 3.0: An updated guide and practical guide to statistical analysis 2nd ed. (Kuala Lumpur, Malaysia: Pearson) .
- Ramayah, T., Yeap, J. A., Ahmad, N. H., Halim, H. A., & Rahman, S. A. (2017). Testing a confirmatory model of Facebook usage in SmartPLS using consistent PLS. International Journal of Business and Innovation, 3(2), 1–14 http://www.theijbi.net/.
- Restuputri, D. P., Indriani, T. R., & Masudin, I. (2021). The effect of logistic service quality on customer satisfaction and loyalty using kansei engineering during the COVID-19 pandemic. Cogent Business & Management, 8(1), 1906492. https://doi.org/10.1080/23311975.2021.1906492
- Restuputri, D. P., Masudin, I., & Sari, C. P. (2020). Customers perception on logistics service quality using Kansei engineering: Empirical evidence from indonesian logistics providers. Cogent Business & Management, 7(1), 1751021. https://doi.org/10.1080/23311975.2020.1751021
- Roy, R., Goatman, M., & Khangura, K. (2009). User-centric design and Kansei Engineering. CIRP Journal of Manufacturing Science and Technology, 1(3), 172–178. https://doi.org/10.1016/j.cirpj.2008.10.007
- Rust, R. T., & Zahorik, A. J. (1993). Customer satisfaction, customer retention, and market share. Journal of Retailing, 69(2), 193–215. https://doi.org/10.1016/0022-4359(93)90003-2
- Sarkis, J. Supply chain sustainability: Learning from the COVID-19 pandemic. (2020). International Journal of Operations & Production Management, 41(1), 63–73. Production Management. https://doi.org/10.1108/IJOPM-08-2020-0568
- Sarstedt, M., Hair, J. F., Ringle, C. M., Thiele, K. O., & Gudergan, S. P. (2016). Estimation issues with PLS and CBSEM: Where the bias lies!. Journal of Business Research, 69(10), 3998–4010. https://doi.org/10.1016/j.jbusres.2016.06.007
- Schütte, S. T., Eklund, J., Axelsson, J. R., & Nagamachi, M. (2004). Concepts, methods and tools in Kansei engineering. Theoretical Issues in Ergonomics Science, 5(3), 214–231. https://doi.org/10.1080/1463922021000049980
- Setiawan, B. M., & Ghozali, I. (2016). The effect of budget participation on budgetary slack in local government with organizational commitment and environmental uncertainty as the moderating variable. International Journal of Applied Business and Economic Research, 14(10), 7099–7120 https://serialsjournals.com/abstract/46235_ch-61_ghozali_imam.pdf.
- Shahed, K. S., Azeem, A., Ali, S. M., & Moktadir, M. A. (2021). A supply chain disruption risk mitigation model to manage COVID-19 pandemic risk. Environmental Science and Pollution Research 2021 (January 2021) . https://doi.org/10.1007/s11356-020-12289-4
- Singh, S., Kumar, R., Panchal, R., & Tiwari, M. K. (2020). Impact of COVID-19 on logistics systems and disruptions in food supply chain. International Journal of Production Research 59 (7) , 1–16 doi:https://doi.org/10.1080/00207543.2020.1792000.
- Sohrabi, C., Alsafi, Z., O’Neill, N., Khan, M., Kerwan, A., Al-Jabir, A.,andAgha, R. (2020). World Health Organization declares global emergency: A review of the 2019 novel coronavirus (COVID-19). International Journal of Surgery 76 (April 2020) 71–76 https://doi.org/10.1016/j.ijsu.2020.02.034.
- Srinivas, S. S., & Marathe, R. R. (2021). Moving towards “mobile warehouse”: Last-mile logistics during COVID-19 and beyond. Transportation Research Interdisciplinary Perspectives, 10 (June 2021) , 100339. https://doi.org/10.1016/j.trip.2021.100339
- Steinberg, F., Tursch, P., & Woll, R. (2015). The improvement of Kansei engineering by using the repertory grid technique. Management and Production Engineering Review, 6(3), 77–82. https://doi.org/10.1515/mper-2015-0029
- Stone, M. (1974). Cross-validation and multinomial prediction. Biometrika, 61(3), 509–515. https://doi.org/10.1093/biomet/61.3.509
- Tabrani, M., Amin, M., & Nizam, A. (2018). Trust, commitment, customer intimacy and customer loyalty in Islamic banking relationships. International Journal of Bank Marketing, 36(5), 823–848. https://doi.org/10.1108/IJBM-03-2017-0054
- Tenenhaus, M., Vinzi, V. E., Chatelin, Y.-M., & Lauro, C. (2005). PLS path modeling. Computational Statistics & Data Analysis, 48(1), 159–205. https://doi.org/10.1016/j.csda.2004.03.005
- Trung, N. V. H., & Khalifa, G. S. (2019). Impact of destination image factors on revisit intentions of hotel’s international tourists in Ba Ria-Vung Tau (br-vt) the mediating role of positive word of mouth. International Journal on Recent Trends in Business and Tourism (IJRTBT), 3(2), 106–115 https://ejournal.lucp.net/index.php/ijrtbt/article/view/78.
- Wang, Y., Lo, H.-P., & Yang, Y. (2004). An integrated framework for service quality, customer value, satisfaction: Evidence from China’s telecommunication industry. Information Systems Frontiers, 6(4), 325–340. https://doi.org/10.1023/B:ISFI.0000046375.72726.67
- Wilson, P. A. (1995). The effects of politics and power on the organizational commitment of federal executives. Journal of Management, 21(1), 101–118. https://doi.org/10.1177/014920639502100106
- Wong, -K.-K.-K. (2013). Partial least squares structural equation modeling (PLS-SEM) techniques using SmartPLS. Marketing Bulletin, 24(1), 1–32 http://marketing-bulletin.massey.ac.nz/v24/mb_v24_t1_wong.pdf.
- Wu, X., Zhou, H., & Wu, D. (2012). Commitment, satisfaction, and customer loyalty: A theoretical explanation of the ‘satisfaction trap’. The Service Industries Journal, 32(11), 1759–1774. https://doi.org/10.1080/02642069.2010.550043
- Yu, S.-H. (2007). An empirical investigation on the economic consequences of customer satisfaction. Total Quality Management & Business Excellence, 18(5), 555–569. https://doi.org/10.1080/14783360701240493
- Zaiţ, A., & Bertea, P. (2011). Methods for testing discriminant validity. Management & Marketing Journal, 9(2), 217–224 https://www.ceeol.com/search/article-detail?id=40081.
- Zuo, Y., & Wang, Z. (2020). Subjective product evaluation system based on Kansei Engineering and analytic hierarchy process. Symmetry, 12(8), 1340. https://doi.org/10.3390/sym12081340