
 ?Mathematical formulae have been encoded as MathML and are displayed in this HTML version using MathJax in order to improve their display. Uncheck the box to turn MathJax off. This feature requires Javascript. Click on a formula to zoom.
Abstract
Despite extensive study, performing Rapid visual screening is still a challenging task for many countries. The challenges include the lack of trained engineers, limited resources, and a large building inventory to detect. One of the most important aspect in rapid visual screening is to establish the building classification based on the guidelines’ specific criteria. This study proposes a general framework based on Convolutional Neural Network to perform automated building classification for the rapid visual screening procedure. The method classifies buildings based on the Federal Emergency Management Agency (FEMA)-154 guidelines and uses transfer learning techniques from a pre-trained network. The Indonesian building portfolio is used as a case study and a dataset of building images generated through web-scraping on Google Search™ engines and Google StreetView™ website is used for the method validation. Results show that the proposed framework has promising potential to automate the building classification based on FEMA-154 guidelines.
PUBLIC INTEREST STATEMENT
Identifying vulnerable buildings against earthquakes is very important to establishing a proper community’s earthquake disaster mitigation system. However, in many developing countries, building vulnerability assessment effort is still hindered by many aspects such as the limited trained inspectors and budget for assessment of the building inventory. This work highlights the application of Convolutional Neural Network (CNN) to automate building classification for rapid vulnerability assessment against earthquakes. The experiments show that a high-performing automated building classification process can be achieved, leading to reducing the dependency on human domain expertise in vulnerability assessment with improved efficiency and effectiveness. Finally, in the end, the paper can contribute to developing an earthquake-resilient community.
1. Introduction
Up till date, earthquakes have remained one of the natural hazards that cause huge losses for many communities worldwide (Ritchie & Roser, Citation2014). Due to the uncertain characteristics of an earthquake, it is challenging to predict its magnitude, time of occurrence, and location, albeit countless efforts to study and understand its nature. It leads to another challenging task which is to determine and identify the vulnerable structure against this hazard.
In civil engineering, identifying vulnerable structures due to earthquake hazards is part of the seismic risk assessment field (Porter, Citation2003). There are two categories of assessment methods, i.e., rapid assessment and detailed assessment methods (Kalman Šipoš & Hadzima-Nyarko, Citation2017). While rapid assessment is more convenient and faster than detailed assessment, both procedures are complementary and depend on several factors, including inventory size, resource availability, and assessment purposes.
Calvi et al. divide the vulnerability assessment method into two categories, i.e., the empirical method and the analytical/mechanical method (Calvi et al., Citation2006). In both methods, the damage scale is determined based on a probabilistic approach. In this approach, the damage scale is expressed by the vulnerability indices and damage probability matrix (DPM). Some probabilistic approach-based frameworks use capacity-demand relation to evaluate the vulnerability level (D’Ayala & Speranza, Citation2003; Lizundia et al., Citation2014; ATC, Citation1985). Then, several works also proposed the use of a vulnerability index (Brando et al., Citation2021) and damage probability matrix (DPM; Basaglia et al., Citation2018; Vicente et al., Citation2011) to determine building vulnerability. The latest development also proposed a hybrid method that combines both vulnerability index and DPM to derive the vulnerability of the large urban area (Alberto Basaglia et al., Citation2018).
The simple application of rapid assessment allows for the development of rapid visual assessment using a classification system developed by the aforementioned technique (Ajay Kumar, Rajaram, Mishra, Pradeep Kumar & Karnath, Citation2017; Achs & Adam, Citation2012; Albayrak et al., Citation2015; Karbassi & Nollet, Citation2007; Ningthoujam & Nanda, Citation2018; Sucuoglu & Yazgan, Citation2003). Due to the variety of seismic characteristics, building inventory and materials properties, the parameters for rapid seismic vulnerability assessment may be different for each rapid screening method. Rapid visual screening procedures can benefit from well-recorded building inventory, spatial data and earthquake hazard history. The work by Basaglia et al. shows that automated procedures to process this data can make the vulnerability assessment of large urban areas becoming more efficient and effective (Basaglia et al., Citation2018). However, this record system may not always be available in every country. Hence, many countries prefer to adopt the well-established RVS system for their standard. Among the well-established rapid assessment guidelines, the FEMA-154 RVS procedure is the most widely adopted in developing countries (Alam et al., Citation2012). It uses a probabilistic approach to assess building vulnerability and identify the structural integrity based on visual inspection of the building from a sidewalk survey. The FEMA-154 introduce a scoring system to measure the level of structure vulnerability. These scoring systems evaluate several building attributes, such as building classes, building irregularities, soil condition, pounding effect, etc, and the information of these building attributes are summarized in the data collection form. The main task of the field survey is to identify and quantify those attributes in the assessed building. The expert will compile the gathered information and evaluate the building score by the following equation:
where SB is the basic score that considering the building typology and n is a number of building attributes. Based on this building score, the expert then proposes a recommendation for further action to keep the building still adhere to the acceptable vulnerability level.
The FEMA-154 technique heavily relies on a qualified screener to understand the building information and calculate the building score. The screener will identify building qualities, depending on the survey form during the field survey. The screener gets this information through visual recognition from the sidewalk to make a quick visual assessment. It is critical to precisely determine the building classification during the field survey to calculate the structure’s vulnerability using the FEMA-154 technique. Currently, the trained/expert screener is in charge of this task. Due to the limited number of experienced screeners doing RVS, the reliance on a trained screener can be a bottleneck for vulnerability assessment work. Automating the RVS procedure using Artificial Intelligence (AI) maybe be a solution to this challenge.
AI has progressed from theoretical knowledge to well-implemented technology in the last decade, affecting many facets of human civilization. It alters how humans interact with machines and how machines improve their ability to tackle social problems. The incredible advancement of hardware technology also enables AI to be used for increasingly advanced and difficult activities that were previously impossible to complete without the assistance of humans. The AI has resulted in a major change away from a traditional technique that heavily relies on human intervention and toward an automated system controlled by the machine. Machine Learning (ML) and Deep Learning (DL) are some of the more comprehensive branches of AI (Salehi & Burgueño, Citation2018). The goal of all branches is to provide the machine with the ability to solve complicated issues (e.g., clustering, classification, recognition, and planning).
ML is a trending topic in AI that focuses on enabling the computer to learn through experience automatically (Jordan & Mitchell, Citation2015). ML has emerged as a powerful method to train a machine to perform computer vision, speech recognition, natural language processing, expert system, control, and many more (Fadlullah et al., Citation2017; Grigorescu et al., Citation2020; Otter et al., Citation2020). Conventional machine learning techniques have a drawback on the dependency in domain expertise to extract the important component from a raw dataset and use it to identify the input. A new class of machine learning technique called deep learning was introduced to reduce the domain knowledge dependency (Lecun et al., Citation2015). Deep learning is multiple computational layers that try to learn the raw data automatically by recognising the representation of raw data from a basic interpretation into a deeper and abstract representation. This approach is different from the traditional machine learning technique which more focus on improving the learning process based on input data that has already been processed through feature and data engineering based on human expertise. Meanwhile, instead of relying on domain expertise interpretation, DL recognizes the pattern, exposes the representation and find a significant feature in the raw data. Hence, the more accessible dataset nowadays, makes the deep learning technique becoming more popular and robust since that huge dataset can be used to properly train deep learning architecture and make DL model more accurate.
The robust development of the DL technique enables a machine to substitute humans on various tasks that previously required human intervention. However, there is still strong scepticism in implementing the DL method to replace humans on RVS procedure since it heavily relies on human perception to determine information from the inspected building. Hence, the questions arise regarding DL’s application in RVS procedure, i.e., 1) In what aspect DL techniques can reduce the dependency on human screener in RVS? and 2) What is the main issue that can hinder its implementation in automating the RVS process?
Previous research has attempted to implement DL to optimize spatial vulnerability analysis by automating building detection and spatial clustering based on satellite imagery (d’Oleire-Oltmanns et al., Citation2011; Geib et al., Citation2019; Kang et al., Citation2018; Miura & Midorikawa, Citation2003; Pushparaj et al., Citation2017). These previous works focused on detecting building in broader areas and predicting building typology based on building’s plain view obtained from satellite imaging. However, using satellite imagery data for predicting building type can reduce the DL ability to extract features important for more detailed and specific building classes. Pamuncak et al. (Citation2019) use DL to predict load rating based on the bridge image. This work shows that DL can extract bridge’ load rating information from an image as long as DL has been trained with suitable data. The work to use building façade images to identify the building was proposed by Taoufiq et al (Taoufiq et al., Citation2020). However, this work only focus on classifying the land-use depending on building occupancy criteria. Furthermore, DL framework was also developed to detect the façade of the building (G. G. Zhang et al., Citation2022). In more detailed inspection, several works tried to investigate the DL application to identify the crack or defect in the structure based on image input (Dung & Anh, Citation2019; Long et al., Citation2021; Perez & Tah, Citation2021). The latest work on determining building soft-storey using images was proposed Yu et al. (Citation2020). In this work, the building soft-storey based on FEMA-154 definition was determined by using DL method. Wang et al. (Citation2021) proposed the method to discern the unreinforced masonry(URM) structure based on image input from Google StreetView™. The conclusion from these works emphasises the robust performance of DL in object detection and classification for structural assessment. However, exploiting DL ability to reduce the human intervention in rapid visual screening is still challenging.
This paper proposes a framework for automated building classification based on FEMA-154 guidelines using the CNN technique. Instead of satellite imagery, which is lack in the information of building detail, structural type and material visualization, this research uses a dataset generated through web-scraping of building images on the internet, which nowadays are easy to get due to the widespread use of smartphones.
This study is synthesized into the following sections: Section 2 explains the methodology of the proposed framework. Section 3 presents the implementation of the proposed framework with specific building classification in Indonesia. Section 4 discusses the result of implementing the proposed method. Finally, the conclusion of this research and suggestion for future work are represented in section 5
2. Materials and methods
This research automates the building classification task in the FEMA-154 Rapid Visual Screening (RVS) process. Hence, to achieve that goal, the framework, as depicted in Figure , is proposed.
Figure 1. The proposed framework for automated building classification by using.
Convolutional Neural Network
It consists of four main steps: 1) Data collection of building images from the internet using Google Search™ and Google StreetView™, 2) Generating dataset by grouping and labeling of the images based on FEMA-154 building typology, 3) Training and validation of the built network based on transfer learning technique from VGG16 model, and 4) Testing the prediction performance of the network on building image in the testing dataset. There are 17 building classifications introduced in FEMA-154 representing building material and structural systems as described in Table .
Table 1. List of FEMA building classification
Determining the building classification based on FEMA building typology is one of the main challenges in the sideways survey. However, this attribute is crucial to determine the basic score in the screening process since FEMA building classification represents building material and structural system. FEMA-154 provides a guideline to identify the most suitable building topology based on the visual impression from the sidewalk by judgment based on building architecture, age and shape.
The most significant benefit of using Convolutional Neural Network (CNN) to handle the problem is that it can extract features from raw data without requiring human intervention. Transfer learning is the idea of using a pre-trained model’s previous knowledge to tackle a new task. Because the pre-trained model has acquired most of the knowledge, this notion is practical for saving resources and avoiding complexity in model training.
3. Case study of building classification in Indonesia
Indonesia can be benefitted from an abundant resource of structure raw materials. However, due to the lack of industrialization and manufacturing, that resource cannot be fully exploited to develop Indonesia’s construction industry. Indeed, the construction know-how from the colonial era is still preserved and applied in many places in Indonesia. The effort from the Indonesian government to standardise the construction work by introducing Indonesia National Standard (SNI) cannot be underestimated. This standard is mainly adopting the US construction standard, i.e., FEMA, ACI, AISC, etc, as a reference. Indonesian construction practitioners also take a lesson to learn from various earthquake disaster that hit the country. They learn reinforced building is more suitable for the seismic condition in Indonesia and no longer use URM building. However, the shortage of trained and certified construction workers still constrain the development of construction technology in Indonesia. This situation makes Indonesia’s building inventory is still limited to conventional building types with un-standardised structure design. Timber and concrete with simple one or two storeys structures are still the most preferable structure since it is cheap, less complicated to build and require low maintenance. The situation is improving in big cities which have better access to skilled workers and higher quality of construction material with cheaper prices compare to most of the areas in Indonesia. In this urban area, the building inventory is more varied in terms of the structural system and materials.
The author employs the proposed framework to conduct building classification based on FEMA-154 in Indonesia. The following sub-chapters describe the workflow for implementing the framework for Indonesia,
3.1. Data collection, pre-processing
The dataset was collected from various resources using a web-scraping technique on Google Search™ and Google StreetView™. As illustrated in Figure , the web-scraping technique successfully gathers 11,029 images comprising 9,358 images for training, 631 images for validation, and 1040 images for testing. The image for training and validation process is obtained from web-scrapping using Google Search™ and Google StreetView™ website, whilst the testing process only uses the image from Google StreetView™ in a specific area that was not explored for obtaining the training and validation dataset. This process is selected since the trained model must be evaluated against the testing dataset that has not been used for the training and validation process.
Figure 2. Number of images obtained for each building type by using a web-scraping technique.
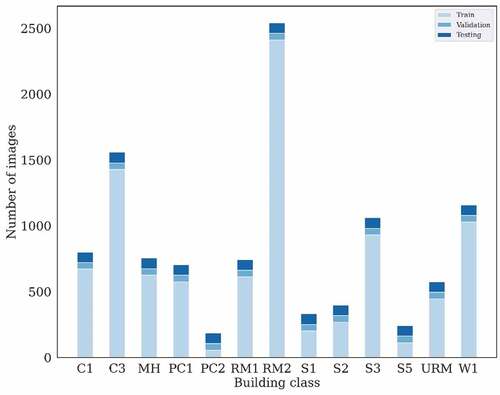
The images collected from the internet were searched with the keyword from FEMA-154 building classes description as shown in Table . Furthermore, the searching process also used the Indonesian translation of FEMA building classes description to increase the chance of suitable building types to be captured in the web-scrapping of website in the Indonesian language. However, irrelevant images may appear in the searching process. Hence further screening process is required to make the dataset can accurately describing each building classification. The photos from each keyword were collected and manually identified with relevant building classes as per the guidelines mentioned in appendix E and D of FEMA-154. Furthermore, the image labelling process follows several assumptions as suggested by FEMA-154 for simplification.
3.2. Labelling
The main objective of this phase is to build the dataset of building in Indonesia based on FEMA-154 by considering local building characteristics and materials. There are several challenges to generating this dataset. One of the challenges in this research is that several FEMA building classes are rare or not in Indonesia. Hence, it is not easy to obtain an image of particular classes for the dataset.
Among FEMA building typologies, the application of timber structure in Indonesia is mainly for a one or two-story building of a single home or residential occupancy. Most of the traditional and old houses in Indonesia use timber as their material. In traditional Indonesian architecture, the timber structure is painted with resin coating or left exposed. This type of house lies under W1 and W1A building classes. However, differentiating the W1 and W1A building classes is requires more information on the plan area’s size. Hence, for simplification in this research, timber frame structures are associated only with the W1 class while W1A class is not considered.
A further challenge in generating datasets is those specific building criteria are not easily recognized from the façade view such as in S4 and C2 building types. Identifying both building types is challenging since the shear wall structure may not be observed from the front of the building because a façade often covers it. In Indonesia, these classes usually appear in a multi-storey buildings for an apartment, offices or commercial buildings that are mainly built in the big city. The S4 and C2 classes are not the main classes in the building inventory and are new building that implements Indonesian National Standard (SNI) code for building material and construction design. Shear walls and core walls are usually installed in the center of the building, mostly concealed as the elevator shaft. FEMA-154 mentions that unless the structure has an exposed shear wall, the prediction on this building type will not be accurate. Therefore, these building classes are excluded from this study.
Identifying URM building types in Indonesia is also challenging as this structure can be misinterpreted as RM building class. Most masonry building in Indonesia is covered with cement plaster which will make identification of the structural system becoming more challenging. However, the most common feature of URM is that it was previously used during the Dutch colonial era or pre-SNI standard era. Meanwhile, the Indonesian authority no longer considered URM in the building standard as it is not suitable for active seismic regions such as Indonesia. While most buildings constructed in the colonial era have been demolished or damaged due to independence war or natural disasters, the web-scraping technique still obtained several images of URM building, but with less variation compared to the other building class.
In the end, there were only 13 classes of building dataset that can be collected by a web-scrapping technique which was suitable for the re-training process.
3.3. Training and evaluation of convolutional neural network
In general CNN architecture consists of two phases, i.e., feature extraction and classification, which can be depicted in Figure as follow:
Figure 3. The general architecture of CNN.
In the feature extraction process, the convolution layer will examine the input and create a feature map by applying a filter or kernel. The pooling layer scales down the amount of data from the previous step and maintains only the most important data. By arranging convolution and pooling layers, the input image is passed through a series of convolution and pooling layers in the CNN model and generate a feature mapping.
The output from the feature extraction phase is then passed to the classification phases. The classification process is consist of a series of neuron nodes that connect each other by synapses and arrange a multi-layer neural network as depicted in Figure . The primary process in the node comprises of accepting the input, processing it by activation function and sending the output to other nodes. Each node contains a weight value that will transform the node’s output into the input for the next neuron layer.
Figure 4. General map of neural network for classification.
The process is mathematically written by the following equation:
This process continues forward until the value obtained at the output layer of the network. The value retrieved from the output layer is then compared with the expected result and back-propagated into the network for weight adjustment until the lowest error is obtained.
This study employs the transfer learning technique using a modified VGG16 network, which has excellent potential for classification tasks (Zhang et al., Citation2016). VGG16 use CNN architecture to achieve high performance in image classification. It was previously used in ImageNet Large Scale Visual Recognition Challenge (ILSVRC) in 2014 and outperformed other computer vision techniques in that challenge. In that challenge, the VGG16 model was evaluated based on its performance to identify 1000 classes of object in the ImageNet dataset. In VGG16 architecture, 13 convolutional layers and 5 layers of Pooling layers is used for the feature extraction phase. VGG16ʹs classifier process consists of two fully connected layers and a softmax layer. The fully connected layers will process the output from the convolutional phase into a single vector that can be used to activate the softmax layer to determine the probability of the image in each classes.
Since it had been trained with 1000 classes of ImageNet dataset, the VGG16 pre-trained network has already incorporated the adjusted weight based on the training with ImageNet dataset. Additional modifications on the VGG16 network should be performed to enable it to work on a new object class. In this research, the softmax output layer in the pre-trained VGG16 network is modified so that the modified VGG16 network can return 13 outputs of FEMA building classes, as depicted in Figure .
Figure 5. Modified VGG16 network for building classification.
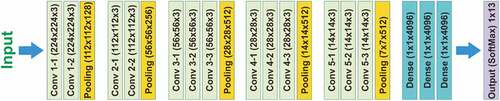
The images are pre-processed to transform all datasets into appropriate input for the VGG16 pre-trained network. The input for the modified network follows the default input of the VGG16 pre-trained network, which is 224 × 224 × 3. For a single epoch or iteration, the training dataset is fed into the neural network in batches. Each training batch contains 32 images. The stochastic gradient descent algorithm with a learning rate of 0.0001 and a momentum value of 0.9 is employed in the training process. The early stopping technique is employed to avoid overfitting by monitoring the validation accuracy value.
3.4. Testing and validation
One thousand forty testing images are captured from Google StreetView™. The selection of building images from Google StreetView™ is randomly selected within the Indonesian region. These images are then manually labelled based on the visual perception and interpretation from the human screener perspective. The algorithm processes validation and testing dataset through the network to validate and test the trained model. This work uses the confusion matrix, accuracy, precision, recall, and F1 score to measure trained network performance (Goutte & Gaussier, Citation2005). If the classification for each class is described as a binary classifier, then the possible outcome of the classifier will be:Figure
Figure 6. Classifier for prediction outcome
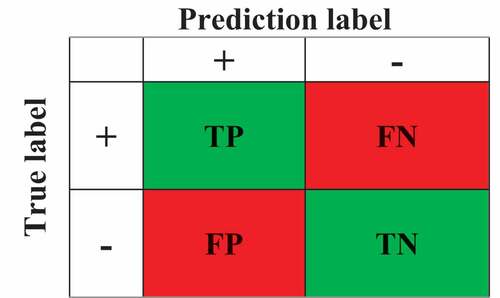
Then, the performance parameter of accuracy, precision, recall, and F1 score can be mathematically written as follows:
and
where TP is True Positive, TN is True Negative, FP is False Positive, and FN is False Negative.
3.5. Effect of color
The convolutional neural network extracts the feature by recognising the pattern in the dataset. In terms of image dataset, the color pattern can be a feature that can differentiate classes of the dataset. The sensitivity to the color pattern may be varied for each object class. Hence, the implementation of color variation to the CNN training process can also influence the prediction performance of trained model in a specific class.
In this work, the image color’s effect on the prediction performance is also investigated by examining the RGB and grayscale image dataset. VGG16 pre-trained model accepts a three-channel image, while the grayscale image has only one channel. Accordingly, the proposed method employs image pre-processing to transform the RGB image into a grayscale image that still have three channel instead of one channel. Since the weight in the pre-trained VGG16 model is adjusted based on the RGB image with three channels, it is interesting to see the viability of the modified network to predict the grayscale image.
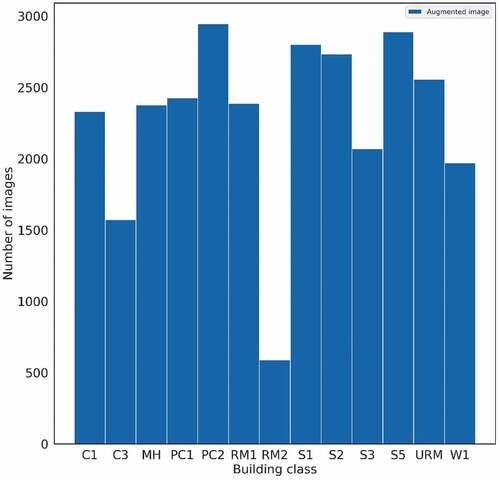
3.6. Effect of image augmentation
Ideally, the training process will produce well-adjusted weights if there is an adequate image. Meanwhile, certain building classes have few samples in this research since those building classes are rare in Indonesia. Accordingly, image augmentation is used to generate a new image by modifying the available image. The primary purpose is to create a new image that is slightly different from the source image to allow the model to extract the image’s main feature without overfitting the train image. This research uses rotation, noising, and mirroring to generate new augmented images. The image augmentation technique produced 29,635 images, with the proportion as depicted in Figure .
Figure 7. Dataset proportion for investigation of image augmentation effect on model prediction accuracy.
4. Results and discussion
The proposed framework establishes a trained neural network based on a modified VGG16 network. This network is then tested to predict the building class by using building images from the internet. The performance of training, validation, and testing of the re-trained network is described in the following sub-chapter.
4.1. Training and performance of model prediction
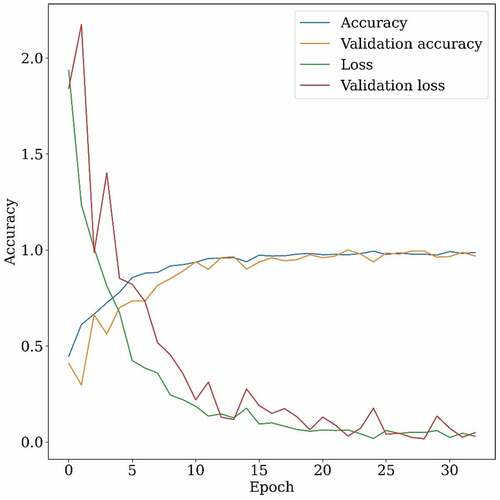
Figure describes the re-training process of the VGG16 model by using the RGB dataset. It shows that the training and validation accuracy has reached approximately 99% only in five epochs. After five epochs, the training and validation accuracy is not significantly improved, and the training process only needs 33 epochs to converge due to the early stopping parameter to avoid overfitting. Furthermore, there has been no significant discrepancy between training and validation accuracy at the beginning of the process. It indicates that the VGG16 pre-trained network was already well adjusted to classify the building. The re-training process improved the pre-trained model to better understand each building type based on FEMA-154 building classification.
Figure 8. Re-training and validation of VGG16 network with obtained FEMA 156 building classification dataset.
The testing process on the RGB model shows 71.9% of prediction accuracy. By investigating the result of RGB model’s prediction as depicted in Figure , it appears that the model has lower performance on predicting PC1, PC2, S1, and S5 classes as the TP prediction in those classes are significantly lower than other classes. In this work, further evaluation by precision, recall, and F1 scores matrix is carried out.
Figure 9. (a) Confusion matrix (b) precision, recall, and f1 score of the model trained with 9,358 RGB images dataset.
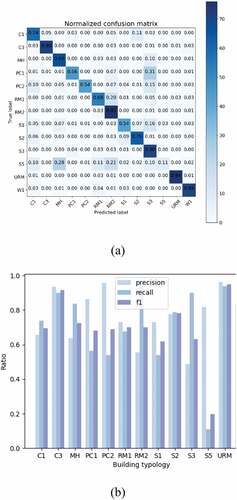
Figure shows that the RGB model has varied precision and recall values from each building class. However, having examined the precision and recall ratio of PC1, PC2, S1, and S5 classes, there is significantly higher precision than recall value in these classes, making the model tend to consider the input image is more relevant to these classes. Hence, this condition leads to a high false-positive prediction when many non-relevant images are predicted as correlated images. This condition causes lower accuracy on PC1, PC2, S1, and S5 classes.
However, instead of reducing the accuracy, considerably higher recall values in MH, RM2, and S3 classes make these classes’ accuracy among the best in all classes. This higher recall value means that the model not only identifies the most relevant images but is also less likely to exclude the correlated image. Hence, this high recall performance makes the accuracy still high even though the precision is low.
Considering precision or recall only is not proper to evaluate model performance, since both values only consider a single type of false prediction on each parameter, i.e., False-positive and False-Negative prediction, respectively. Hence, an f1 score is needed to determine the harmonic mean between precision and recall value when evaluating model performance. By evaluating the f1 score, significant precision and recall discrepancy cause a lower f1 score in several classes. The lower f1 score is also impacting a lower model performance to predict those classes. In this RGB model, the f1 score is significantly low for the S5 class, with the lowest accuracy.
Furthermore, having examined the confusion matrix in Figure , the false predictions on both S1 and S5-building classes are not clustered on specific classes. This behavior may occur due to unbalance dataset in which the size of the S1 and S5 dataset is among the lowest. Meanwhile, false exchange predictions between PC1 and PC2 occur in both classes. This behavior is understandable since the appearance of PC1 and PC2 building classes are similar and differs only on the construction methodology, which is challenging to be identified only from external shape.
Two parameters are investigated to determine the possible solution to increase the model’s performance, i.e., the variance in color and size of the dataset.
4.2. The impact of image color on prediction performance
The previous RGB dataset is modified to get the grayscale dataset. One thousand forty grayscale images are fed into the trained network. The confusion matrices, as depicted in Figure , are obtained.
Figure 10. (a) Confusion matrix (b) precision, recall, and f1 score of the model trained with grayscale images dataset
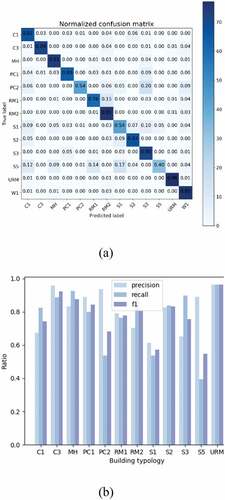
The network accuracy is increased 7% higher than the previous model. The confusion matrix in Figure shows that most class has increased accuracy rate, with PC1 and S5 classes showing the most significant rise. Hence, compared to the previous model, implementing the grayscale dataset does not significantly affect the accuracy of prediction for PC2, S1, and S5, which is still the lowest performance among other classes.
Further check on the precision, recall, and F1 score of the model as depicted in Figure shows the positive effect of the grayscale dataset on overall performance. Overall precision, recall, and f1 scores increased by 4.2%, 7%, and 7.8%, respectively. Interestingly, this model improves PC1 recall performance while PC2, S1, and S5 recall values are still the lowest compared to the RGB model. A significant discrepancy between precision and recall value in the previous RGB model is mainly reduced except in PC2 and S5 classes. Like the RGB model, PC2 and S5 classes in the grayscale model also have a high precision value with low recall performance, making the model prediction for both classes inaccurate compared to other classes. Hence, employing the grayscale dataset still cannot improve the model to identify both classes. The most probable cause of the different effects of the grayscale dataset in each building type’s prediction performance may be due to a different level of variation in the dataset. Dataset of building types with a wider variety will be less prone to overfitting behaviour than the less varied dataset.
4.3. Impact of dataset size for prediction performance
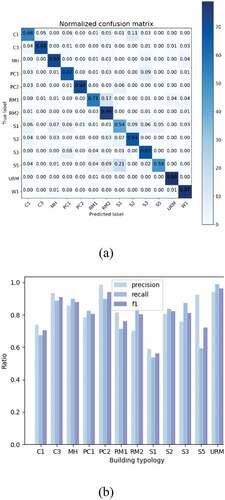
The available data from web-scraping were used to generate a new image by using image augmentation technique. The primary purpose of image augmentation is to create a new image that is slightly different from the source image to allow the model to extract the image’s main feature without overfitting the train image. This research use rotation, noising and mirroring of the source image to generate new images. Thirty-nine thousand images, including the original and augmented images, were used in training. This technique outperforms the accuracy of the previous method with a further 13.8% increase as the most significant rise. Furthermore, using augmented images for training improves overall precision, recall, and F1 scores by 5.9%, 9.9%, and 11.2%, respectively.
The network with RGB dataset displays poor precision performance for predicting RM2 and S3. In contrast, as shown in Figure ), the network with an augmented dataset shows significant improvement in which none of the prediction precision is lower than 60%. The recall score of the S5 building class is still the lowest score among other classes, and the model prediction is mixed up between S5 with S1 building classes. However, it is noticeable that the S1 recall performance significantly increases by using an augmented database, contributing to a higher f1 score of the S1 building type. Overall, increasing the size of the dataset will significantly improve the accuracy, precision, and the balance of network prediction.
Figure 11. (a) Confusion matrix (b) precision, recall, and f1 score of the model trained with augmented images dataset
5. Conclusion and future work
This research proposes a framework for automatic building classification based on FEMA-154 RVS procedure using CNN. In this approach, the RVS method takes advantage of the building images available on the internet via web-scraping as well as images provided by Google StreetView™. This work develops a building dataset that comprises 13 classes. The transfer learning method is used to train the model by implementing a pre-train VGG16 network. The trained model is then tested to predict the class of random buildings in Indonesia. The investigation shows that CNN can produce a good prediction for classifying buildings based on FEMA-154 building typology. The result shows that the transfer learning technique can be useful to reduce the effort for training neural network models on building classification since the training process can get higher accuracy at lower epochs. The investigation on the effects of image properties of the dataset shows that the classifier is not significantly susceptible to the color or image but more sensitive to the size of the dataset.
For building classification, the proposed method promises high accuracy and precision. However, it still shows a limitation in predicting buildings with concealed structural components. Although several classes incorporate images of structural members to train the network, it is not effective in improving prediction performance. Hence, this circumstance introduces uncertainty to the analysis, and further analysis should be conducted. Another disadvantage of the proposed method is that it is limited to Indonesian building characteristics. Creating a multilayer CNN that classifies the structure’s façade, interior, and structural features is one possible solution to these problems. Then, for post-processing, use a fuzzy logic method to reliably forecast building categorization. Furthermore, because each country’s construction and building design differ, more training datasets from other parts of the world must be included.
correction
This article has been corrected with minor changes. These changes do not impact the academic content of the article.
Acknowledgements
This work was supported by the Indonesian Endowment Fund for Education (LPDP), Ministry of Finance, the Republic of Indonesia. We also thank Lembaga Penelitian dan Pengabdian Masyarakat (LPPM) Universitas Islam Riau for the support on proofreading and preparing the manuscript.
Disclosure statement
No potential conflict of interest was reported by the author(s).
Additional information
Funding
Notes on contributors
Augusta Adha
The authors are members of the University of Warwick Structural Health Monitoring (SHM) Research Group with the main focus on Structural Health Monitoring (SHM), Intelligent Infrastructure, Computer-aided Engineering and Disaster Management. The research group work on developing the system for disaster resilience, the implementation of Internet of Thing (IoT) and damage detection system for Infrastructure in the country. This paper is part of bigger research on developing a community-based system for improving disaster resilience in Indonesia. All authors in this paper participated in developing the concept, analysis, writing and revision under the supervision of the research group leader, Dr Irwanda Laory.
References
- Achs, G., & Adam, C. (2012). Rapid seismic evaluation of historic brick-masonry buildings in Vienna (Austria) based on visual screening. Bulletin of Earthquake Engineering, 10(6), 1833–19. https://doi.org/10.1007/s10518-012-9376-5
- Ajay Kumar, S., Rajaram, C., Mishra, S., Pradeep Kumar, R., & Karnath, A. (2017). Rapid visual screening of different housing typologies in Himachal Pradesh, India. Natural Hazards, 85(3), 1851–1875. https://doi.org/10.1007/s11069-016-2668-3
- Alam, N., Alam, M. S., & Tesfamariam, S. (2012). Buildings’ seismic vulnerability assessment methods: A comparative study. Natural Hazards, 62(2), 405–424. https://doi.org/10.1007/s11069-011-0082-4
- Albayrak, U., Canbaz, M., & Albayrak, G. (2015). A rapid seismic risk assessment method for existing building stock in urban areas. Procedia Engineering, 1181, 1242–1249. https://doi.org/10.1016/j.proeng.2015.08.476
- ATC. (1985) . ATC 13th edition:Earthquake damage evaluation data for California .Applied Technology Council . http://nisee.berkeley.edu/elibrary/Text/S22323
- Basaglia, A., Pilla, F., Pilla, F., & Pilla, F. (2018). Performance-based seismic risk assessment of urban systems. International Journal of Architectural Heritage, 12(7–8), 1131–1149. https://doi.org/10.1080/15583058.2018.1503371
- Brando, G., Cocco, G., Mazzanti, C., Peruch, M., Spacone, E., Alfaro, C., Sovero, K., & Tarque, N. (2021). Structural survey and empirical seismic vulnerability assessment of dwellings in the historical centre of Cusco, Peru. International Journal of Architectural Heritage, 15(10), 1395–1423. https://doi.org/10.1080/15583058.2019.1685022
- Calvi, G. M., Pinho, R., Magenes, G., Bommer, J. J., Restrepo-Vélez, L. F., & Crowley, H. (2006). Development of seismic vulnerability assessment methodologies over the past 30 years. ISET Journal of Earthquake Technology, 43(3), 75–104. https://iset.org.in/public/publications/15932_472.pdf
- D’Ayala, D., & Speranza, E. (2003). Definition of collapse mechanisms and seismic vulnerability of historic masonry buildings. Earthquake Spectra, 19(3), 479–509. https://doi.org/10.1193/1.1599896
- d’Oleire-Oltmanns, S., Coenradie, B., & Kleinschmit, B. (2011). An object-based classification approach for mapping migrant housing in the mega-urban area of the pearl river delta (China). Remote Sensing, 3(8), 1710–1723. https://doi.org/10.3390/rs3081710
- Dung, C. V., & Anh, L. D. (2019). Autonomous concrete crack detection using deep fully convolutional neural network. Automation in Construction, 99(2019), 52–58. https://doi.org/10.1016/j.autcon.2018.11.028
- Fadlullah, Z. M., Tang, F., Mao, B., Kato, N., Akashi, O., Inoue, T., & Mizutani, K. (2017). State-of-the-art deep learning: evolving machine intelligence toward tomorrow’s intelligent network traffic control systems. IEEE communications surveys and tutorials,19(4),2432, . https://doi.org/10.1109/COMST.2017.2707140
- Geib, C., Pelizari, P. A., Marconcini, M., & Sengara, W. (2019). Estimation of seismic building structural types using multi-sensor remote sensing and machine learning techniques. DLR Deutsches Zentrum Fur Luft- Und Raumfahrt e.V. - Forschungsberichte, 2019(10), 385–412. https://doi.org/10.1016/j.isprsjprs.2014.07.016 Janua
- Goutte, C., & Gaussier, E. (2005). A probabilistic interpretation of precision, recall and f-score, with implication for evaluation, 27th European Conference on IR Research, 2005(3408), 345–359, Santiago de Compostela, Spain. https://doi.org/10.1007/978-3-540-31865-1_25
- Grigorescu, S., Trasnea, B., Cocias, T., & Macesanu, G. (2020). A survey of deep learning techniques for autonomous driving. Journal of Field Robotics, 37(3), 362–386. https://doi.org/10.1002/rob.21918
- Jordan, M. I., & Mitchell, T. M. (2015). Machine learning: Trends, perspectives, and prospects. Science, 349(6245), 255–260. https://doi.org/10.1126/science.aaa8415
- Kalman Šipoš, T., & Hadzima-Nyarko, M. (2017). Rapid seismic risk assessment. International Journal of Disaster Risk Reduction, 24(March), 348–360. https://doi.org/10.1016/j.ijdrr.2017.06.025
- Kang, J., Körner, M., Wang, Y., Taubenböck, H., & Zhu, X. X. (2018). Building instance classification using street view images. ISPRS Journal of Photogrammetry and Remote Sensing, 145(Part A), 44–59. https://doi.org/10.1016/j.isprsjprs.2018.02.006
- Karbassi, A., & Nollet, M. J. (2007). The adaptation of the FEMA 154 methodology for the rapid visual screening of existing buildings in accordance with NBCC-2005. Ninth Canadian conference on earthquake engineering, Ottawa, CAEE.
- Lecun, Y., Bengio, Y., & Hinton, G. (2015). Deep learning. Nature, 521(7553), 436–444. https://doi.org/10.1038/nature14539
- Lizundia, B., Durphy, S., Griffin, M., Hortacsu, A., Kehoe, B., Porter, K., & Welliver, B. (2014). Rapid visual screening of buildings for potential seismic hazards: FEMA 154 and FEMA 155 updates. NCEE 2014 - 10th U.S. national conference on earthquake engineering: frontiers of earthquake engineering. Anchorage, USA: Earthquake Engineering Research Institute (EERI), (January). https://doi.org/10.4231/D3M90238V
- Long, X. Y., Zhao, S. K., Jiang, C., Li, W. P., & Liu, C. H. (2021). Deep learning-based planar crack damage evaluation using convolutional neural networks. Engineering Fracture Mechanics, 246(April), 107604. https://doi.org/10.1016/j.engfracmech.2021.107604
- Miura, H., & Midorikawa, S. (2003). Automated building detection from high-resolution satellite image for updating GIS building inventory data,13th World Conference on Earthquake Engineering,Vancouver, Canada,13(678) . https://doi.org/10.11314/jisss.5.37
- Ningthoujam, M. C., & Nanda, R. P. (2018). Rapid visual screening procedure of existing building based on statistical analysis. International Journal of Disaster Risk Reduction, 28(June), 720–730. https://doi.org/10.1016/j.ijdrr.2018.01.033
- Otter, D. W., Medina, J. R., & Kalita, J. K. (2020). A survey of the usages of deep learning for natural language processing. IEEE Transactions on Neural Networks and Learning Systems, 32(2), 604–624. https://doi.org/10.1109/tnnls.2020.2979670
- Pamuncak, A., Guo, W., Khaled, A. S., & Laory, I. (2019). Deep learning for bridge load capacity estimation in post-disaster and -conflict zones (pp. 6( 12). Royal Society Open Science. https://doi.org/10.1098/rsos.190227
- Perez, H., & Tah, J. H. M. (2021). Deep learning smartphone application for real-time detection of defects in buildings. Structural Control and Health Monitoring, 28(7), e2751. https://doi.org/10.1002/stc.2751
- Porter, K. A. (2003). An overview of PEER’s performance-based earthquake engineering methodology. Ninth international conference on applications of statistics and probability in civil engineering, July 6-9(1),1–8. California, USA. https://citeseerx.ist.psu.edu/viewdoc/download?doi=10.1.1.534.8493&rep=rep1&type=pdf
- Pushparaj, J., Hegde, A. V., & Song, T. (2017). A comparative study on extraction of buildings from Quickbird-2 satellite imagery with & without fusion. Cogent Engineering, 4(1), 1291118. https://doi.org/10.1080/23311916.2017.1291118
- Ritchie, H., & Roser, M. (2014). Natural Disasters. Our World in Data. Retrieved Februry 15, 2022, from https://ourworldindata.org/natural-disasters
- Salehi, H., & Burgueño, R. (2018). Emerging artificial intelligence methods in structural engineering. Engineering Structures, 171(September), 170–189. https://doi.org/10.1016/j.engstruct.2018.05.084
- Sucuoglu, H., & Yazgan, U. (2003). Simple survey procedures for seismic risk assessment in urban building stocks BT - seismic assessment and rehabilitation of existing buildings. (S. T. Wasti & G. Ozcebe, Eds.). Springer Netherlands.
- Taoufiq, S., Nagy, B., & Benedek, C. (2020). Hierarchynet: Hierarchical CNN-based urban building classification. Remote Sensing, 12(22), 1–20. https://doi.org/10.3390/rs12223794
- Vicente, R., Parodi, S., Lagomarsino, S., Varum, H., & Silva, J. A. R. M. (2011). Seismic vulnerability and risk assessment: Case study of the historic city centre of Coimbra, Portugal. Bulletin of Earthquake Engineering, 9(4), 1067–1096. https://doi.org/10.1007/s10518-010-9233-3
- Wang, C., Antos, S. E., & Triveno, L. M. (2021). Automatic detection of unreinforced masonry buildings from street view images using deep learning-based image segmentation. Automation in Construction, 132(December), 103968. https://doi.org/10.1016/j.autcon.2021.103968
- Yu, Q., Wang, C., McKenna, F., Yu, S. X., Taciroglu, E., Cetiner, B., & Law, K. H. (2020). Rapid visual screening of soft-story buildings from street view images using deep learning classification. Earthquake Engineering and Engineering Vibration, 19(4), 827–838. https://doi.org/10.1007/s11803-020-0598-2
- Zhang, G., Pan, Y., & Zhang, L. (2022). Deep learning for detecting building façade elements from images considering prior knowledge. Automation in Construction, 133(January), 104016. https://doi.org/10.1016/j.autcon.2021.104016
- Zhang, X., Zou, J., He, K., & Sun, J. (2016). Accelerating Very Deep Convolutional Networks for Classification and Detection. IEEE Transactions on Pattern Analysis and Machine Intelligence, 33(10), 1943–1955. https://doi.org/10.1109/TPAMI.2015.2502579