
 ?Mathematical formulae have been encoded as MathML and are displayed in this HTML version using MathJax in order to improve their display. Uncheck the box to turn MathJax off. This feature requires Javascript. Click on a formula to zoom.
Abstract
The present research work focuses on understanding the tension-tension fatigue durability of autoclave cured carbon/epoxy quasi-isotropic laminates. Based on the experimental results, S-N curve and stiffness degradation behaviour were developed. Damage growth mechanisms were studied based on the energy dissipated in each loading cycle at different stress levels. C-Scan and Scanning Electron Microscope were used to characterize the micro-crack growth and nature of fatigue failure. A bilinear trend was observed in the stress–strain curve with the failure of 90° oriented fibres in the initial phase followed by 0° oriented fibres. The energy dissipated and damage growth of the laminates at different stress levels followed a characteristic damage state curve. The C-Scan images showed the initiation of cracks on the specimen edges and propagating towards the center in the transverse direction.
PUBLIC INTEREST STATEMENT
Fatigue failure is the process of progressive localized permanent structural damage induced in a material subjected to conditions that produce fluctuating stresses at the localized points. The continuous cyclic application of stress or strain will produce cumulative cracks or complete fractures of the specimens. This research article focused on studying the fatigue damage growth behaviour of quasi-isotropic carbon/epoxy laminates. The damage growth mechanism of the laminates was studied by the energy dissipated during fatigue loading and using non-destructive techniques.
1. Introduction
Carbon fibre reinforced composites (CFRP) are the primary choice of materials in the automotive, aerospace, marine, civil, and sports industry due to their lightweight, low density, higher stiffness–weight ratio, better fatigue strength, and fatigue damage tolerance. Near net shape manufacturing process and parts integration, reduction in several assembly processes make CFRP as a substitute for conventional metals in structural applications(Vassilopoulos, Citation2020). The use of CFRP also provides an advantage of tailoring the mechanical properties according to the requirements of structures. This can be achieved by the orientation of fibre fabrics, hybridization of fibres, varying the number of layers of fabrics, and adopting a suitable manufacturing process. In-service life, most of the structural members are subjected to compressive, shear, tensile, fluctuating loads, etc. The application of fluctuating loads to the structures will result in fatigue failure at stress levels below the monotonic failure stress of the structures. Fatigue failure accounts for a larger percentage of structural failures in the engineering field. Intensive research has been conducted by the scientific community to develop an experimental/design database for individual engineering materials(Alam et al., Citation2019; Ansari et al., Citation2018; Capela et al., Citation2019; Vassilopoulos, Citation2020). The complexity of composite structures is a barrier to the development of universal acceptable fatigue design criteria. The research community is continuously working to develop a universally acceptable multi-damage mechanism for composite materials.
The fatigue behaviour of CFRP depends on the type of matrix material, type of fibre, volume fraction of fibre, fibre orientation, the architecture of fibre, manufacturing method, and environmental conditions. Addis et al. (Tessema et al., Citation2018) studied the damage evolution method during tension-tension loading of quasi-isotropic CFRP. Damage growth or formation of micro-cracks initiated in the matrix and 90° plies. These cracks propagated towards ±45° and 0° plies. The difference in stiffness of adjacent plies induced shear lagging and induced complete delamination in the specimens. Fatigue failure behaviour studied by Mazlina et al.(Mohd Tahir et al., Citation2018) showed that micro-cracks initiated and extended through fibre-rich clusters due to lack of resin impregnation. Major cracks propagated from the edges to the central zone of the specimen. Sanjay Sisodia et al. (Sisodia et al., Citation2015) showed that the intensity of crack formation in CFRP during fatigue loading depended on void content. The presence of voids resulted in the formation of localized stress concentrations and developed transverse cracks in the material. The voids are interconnected by transverse cracks and initiated the formation of cracks in the void-free zone and resulted in complete failure of the specimens. Fatigue damage depends on the applied stress level. Studies conducted by Vahid et al. (Movahedi-Rad et al., Citation2018) on (±45)2S glass/epoxy angle ply laminates showed that, the presence of severe and localized fatigue damage at high-stress levels and less severe and uniformly distributed damage at low-stress levels. Dian Sen et al. (Sen et al., Citation2015) observed that size of the specimens will vary the fatigue life of the material. 3D E Glass/Epoxy long specimens (gauge length = 100 mm) showed better fatigue life than short specimens (gauge length = 10 mm) due to the presence of a larger area to develop and propagate the micro-cracks during fatigue loading.
The damage developed in fibre reinforced polymers (FRP) during fatigue loading was analyzed by monitoring stiffness degradation, energy dissipation, acoustic emission, and infrared thermography techniques. Fuqiang Wu et al. (Wu & Yao, Citation2010) developed a phenomenological fatigue damage model based on stiffness degradation. A developed model is able to predict the damage accumulated in a different set of experiments. The energy dissipated and hysteresis energy model developed by Naderi et al. (Naderi & Khonsari, Citation2013) showed that damage growth of glass/epoxy composites can be represented in three stages. Growth of damage will begin with the rapid formation of matrix cracks followed by a steady increase in cracks and debonding. In the third stage, abrupt fibre breakage will cause catastrophic failure of specimens. Friction between the delaminated fibre surfaces increased the energy dissipation as the number of cycles increased at any stress levels. The damage growth in composite materials can be studied by estimating the crack density during the fatigue loading. Infrared thermography technique is extensively used to quantify the damage accumulation and crack propagation during fatigue loading (Carraro & Quaresimin, Citation2015; De Finis & Palumbo, Citation2020; De Finis et al., Citation2021; Huang et al., Citation2019). The residual stiffness reduction model developed by Lolbet et al. for Carbon/Epoxy laminates showed two stages. The initial stage represents the multiple fibre failure and matrix cracks and the second stage is characterized by the drastic reduction in stiffness due to the linkage of multiple fibre failures (Llobet et al., Citation2017). The energy dissipated and temperature rise in each fatigue loading cycle can be correlated to develop the damage model. The energy dissipated in each cycle increases with the increase of damage intensity (Montesano et al., Citation2013). Stiffness-based damage model developed by Junda Zong et al. (Zong & Yao, Citation2017) successfully predicted the fatigue life of CFRP and glass fibre reinforced polymers (GFRP). With the aid of the proposed model, fatigue damage and life of the structures can be predicted by using an initial 20% of the Residual stiffness, energy dissipated fatigue damage models will help in monitoring the stiffness degradation of the specimens non-destructively.
The main objective of the present research work is to estimate the fatigue life and to develop a fatigue damage growth model for quasi-isotropic Carbon/Epoxy composites. Specimens with a stacking sequence of [0/90/±45]s are fabricated using an autoclave curing process. Tension-Tension fatigue test at different stress levels was conducted at a frequency of 2 Hz and a stress ratio of 0.1. Damage growth mechanisms for the composites were established by evaluating energy dissipated in each loading cycle and material parameters were estimated. C-Scan and Scanning Electron Microscope (SEM) techniques were used to analyze the damage footprints and failure patterns.
2. Experimental methods
2.1. Materials
The quasi-isotropic Carbon/Epoxy laminates were prepared by the Autoclave curing process. The unidirectional Carbon/Epoxy prepreg with 38% resin content was procured from Bhor Chemicals and Plastics Pvt Ltd., India. The carbon fibre fabric used in the prepreg has a density of 1.8 g/cm3, and a tensile modulus of 240 GPa. The epoxy used as a matrix material in the prepreg has a tensile modulus of 2.91 GPa. The Carbon/Epoxy quasi-isotropic laminates containing eight layers of prepreg manufactured with a stacking sequence of [0/90/±45]s. The laminates were cured in a lab-scale Autoclave at a prescribed pressure and temperature(Padmaraj, Vijaya, Shreepannaga et al., Citation2021). The average thickness, void content, and density of the prepared laminates were found to be 1.7 mm, 1.54 ± 0.041 g/cm3, and 1.315% respectively as reported in (Padmaraj, Vijaya, Shreepannaga et al., Citation2021).
2.2. Quasi-Static tensile test
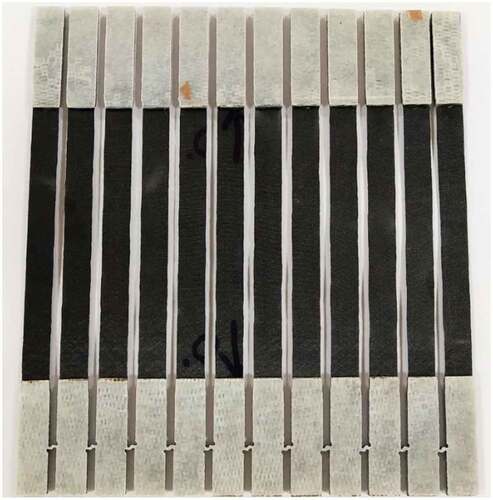
The quasi-static tensile tests of Carbon/Epoxy quasi-isotropic laminates were conducted as per ASTM D-3039 at a feed rate of 2 mm/min. BiSS India (ITW) make a 50 kN universal testing machine was used for conducting the test. From the fabricated laminates tensile specimens with dimensions of 250 × 15 × 1.76 mm were cut using the abrasive water jet technique facility at Stonemax Pvt Ltd Kochi, India. To avoid gripping stresses and to eliminate the failure of specimens within the gripping zone, 50 mm long and 2 mm thick Glass/Epoxy tabs were attached to the Carbon/Epoxy specimens using Epoxy adhesives and are shown in Figure .
Figure 1. Quasi-isotropic Carbon/Epoxy laminates with end Glass/Epoxy end tabs.
2.3. Tension-tension fatigue test
Constant amplitude tension-tension fatigue tests were conducted using BiSS India (ITW) make 50 kN servohydraulic fatigue testing machine according to the recommendations of ASTM D 3479. The tests were performed using sinusoidal load control mode in ambient conditions. The cyclic loading of specimens was performed at a stress ratio R = 0.1 and a frequency of 2 Hz. The low testing frequency was selected to limit the self-heating of the specimens during fatigue loading. Experiments were conducted at four stress levels (0.8, 0.7, 0.6, and 0.5). The maximum and minimum stress applied in each stress level were the percentages of the stress to failure in the quasi-static tensile test. The tests were performed until the complete failure of the specimens or up to 106 cycles.
2.4. Fatigue damage characterization
Fatigue damage growth during the loading in each stress level is characterized by considering two parameters such as stiffness variation and energy dissipated in each cycle. The rate of stiffness degradation of the specimens during the fatigue loading at different stress levels was evaluated using the experimental stress-strain values from each cycle. The individual fatigue loading cycle consists of two phases. In the first phase (loading phase), the applied load will increase from the minimum to maximum, and in the second phase (unloading phase) applied load will decrease from maximum to minimum as represented in Figure . These kinds of loading induce permanent deformation in the specimens and result in energy loss in each cycle. In the loading phase; energy will be dissipated and in the unloading phase energy will be released. The residual energy will be utilized to develop new defects in the specimens during each loading cycle.
Figure 2. Schematic representation of individual loading cycle and hysteresis area estimation.
Estimating and analyzing the energy dissipated in each cycle will help in understanding the damage growth in the specimens. The energy dissipated (H) is estimated from the hysteresis loop of each loading cycle as shown in Figure and according to EquationEq. (1(1)
(1) ; Giancane et al., Citation2010).
Where N is the total no of cycles, σ is the stress applied and is the strain developed in the material in each loading cycle. The strain developed in the individual cycle was estimated within the gauge length (150 mm) of the specimen.
The fatigue damage developed in the specimens at different stress levels was estimated based on the energy loss in each loading cycle as per EquationEq. (2(2)
(2) ; Giancane et al., Citation2010; Padmaraj et al., Citation2020; Padmaraj, Vijaya, Dayananda et al., Citation2021), (De Finis & Palumbo, Citation2020), (Llobet et al., Citation2017).
Where D(n) is the fatigue damage and varies from 0 to 1. Ho, Hf and Hn are the energy dissipated in the initial loading cycle, at the specimen failure point, and the nth cycle respectively.
Theoretical fatigue damage at different stress levels at all points of fatigue loading is described as per EquationEq. (3(3)
(3) ; Wu & Yao, Citation2010).
Where n is the number of cycles completed, N is the total number of cycles, and A and B are the material parameters.
The rate of fatigue damage growth in the initial and final loading cycles is estimated by modifying EquationEq.(3)(3)
(3) and as per EquationEq.(4
(4)
(4) ; Wu & Yao, Citation2010).
Where, is the rate of fatigue damage,
, A and B are the material parameters obtained as per EquationEq.(3)
(3)
(3) .
2.5. Damage analysis
The damage growth footprints developed in the specimens during fatigue loading were analyzed using the C-Scan technique. The water coupled through transmission C—Scan performed using Dhvani Research and Development Solution Pvt Ltd, Chennai, India. C-Scan was performed on specimens subjected to fatigue loading at 0.7, 0.6, and 0.5 stress levels before the complete failure. Through transmission type C-Scan technique, ultrasonic waves are transmitted from the transmitter and will pass through the specimen thickness. The waves will be picked by receiving unit on the other end of the specimen. The interaction of ultrasound waves with defects will reduce the energy level of waves as compared to uninterrupted waves(Mallick, Citation2007). The obtained images were compared with the neat specimen. The scanning was performed using a 5 MHz Olympus ultrasonic transducer. In-built data acquisition software acqUT is used to acquire the images and the obtained images are analyzed using extUT C-Scan post-processor.
Scanning Electron Microscope (SEM) was used to analyze the post fatigue failure patterns of the specimens subjected to loading at 0.8, 0.7, and 0.6 stress levels. Required specimens for scanning were extracted from the failure zone and subjected to the gold sputtering process.
3. Results and discussion
3.1. Stress–strain curve
The stress–strain curve of quasi-isotropic Carbon/Epoxy laminates is shown in Figure (a). Five samples were used for the test and average failure stress and failure strains were estimated. Stress for each specimen was obtained from the force data obtained through a 50 kN load cell and strain estimated within the gauge length of the specimen.
Figure 3. Stress-strain curve of quasi-isotropic Carbon/Epoxy laminate.
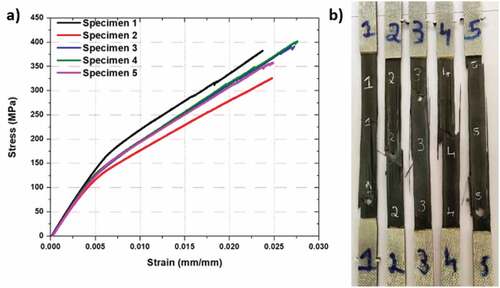
The average failure stress and strain of the laminate were found to be 372.16 ± 30.51 MPa and 0.0256 ± 0.0017, respectively. The obtained stress–strain curve is composed of two different slopes and can be considered as a bilinear curve. The point of intersection of two linear curves is known as the knee point. The knee point of the curve represents the failure of 90° oriented plies. The final failure of the laminate occurred at the failure stress of 0° oriented plies. The elastic modulus of the laminate was evaluated from the slope of the curve and was found to be 15.17 ± 1.05 GPa. The complete failure of the specimens is characterized by multiple modes within the gauge length. The 0° oriented plies showed longitudinal splitting with a broom type of pattern in the failure region as shown in Figure (b). Plies with ±45° and 90° orientation were failed due to interfacial debonding and shear failure.
3.2. S-N curve
The experimental results of tension-tension fatigue of quasi-isotropic carbon/epoxy laminates were shown in Table . The S-N curve for the laminates was developed based on Table and is shown in Figure . S-N curve shows relatively higher scattering in fatigue life at high-stress levels.
Figure 4. S-N curve for quasi-isotropic Carbon/Epoxy laminate.
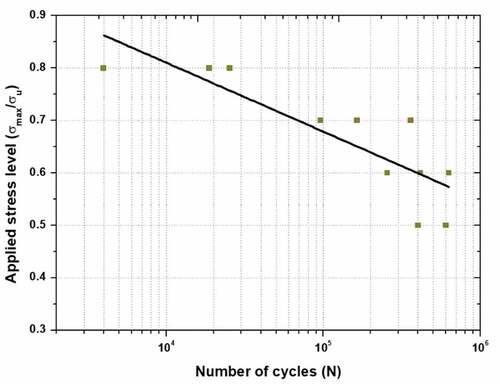
Table 1. Experimental values of tension-tension fatigue test of quasi-isotropic laminates
A linear fitting was developed between the applied stress level and the number of cycles using the least square method and according to EquationEq. (5(5)
(5) ; Vieira et al., Citation2018; Wang et al., Citation2019).
Where, σmax is the maximum stress applied, σu is the average tensile strength of the laminate, A and B are the model parameters, and N is the total number of cycle at different stress levels. Model parameter for the present configuration Carbon/Epoxy laminate estimated based on EquationEq.(5)(5)
(5) . From the analysis, parameter A obtained as −0.1315, which is the slope of the curve and indicates the rate of fatigue life deterioration. The value of parameter B > 1 represents the curve intercept and was found to be 1.336. The accuracy of a curve fitting is represented by R2 = 0.8745 which is within the acceptable limit(Habibi et al., Citation2019; Ziemian et al., Citation2016).
3.3. Stiffness degradation
The change in the elastic modulus of the material during fatigue loading is a sign of damage growth. Normalized stiffness degradation during each loading cycle at 0.7, 0.6, and 0.5 stress level is shown in Figure . The stiffness of the material at any loading cycle is estimated based on the experimental stress-strain data collected from the data acquisition system.
Figure 5. Normalized stiffness degradation behaviour at 0.7, 0.6, and 0.5 stress level.
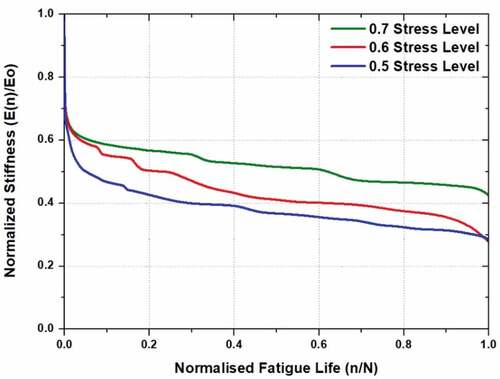
The experimental stiffness degradation curve (Figure ) can be divided into three phases such as initiation, propagation, and localization. In the initiation phase, a rapid reduction in stiffness was observed due to the crack openings in the matrix phase. The propagation phase is characterized by matrix/fibre debonding and delamination. In this phase, residual stiffness reduces linearly as shown in Figure , and contributes more than 80% of the life. In the localization phase, all the damages will get interconnected and lead to the sudden death of the specimens. Fatigue loading at 0.7, 0.6 and 0.5 stress level induced stiffness degradation of 57.5%, 72.5% and 71.7%, respectively. This indicates the fibre-dominated failures at higher stress levels and matrix-dominated failures at lower stress levels (Degrieck & Van Paepegem, Citation2001; Vassilopoulos, Citation2020).
3.4. Dissipation energy based damage growth analysis
The energy dissipated in each loading cycle at 0.7, 0.6, and 0.5 stress levels estimated according to EquationEq. (1(1)
(1) ), and normalized energy dissipated at different cycles is shown in Figure .
Figure 6. Normalized energy dissipation at different stress levels.
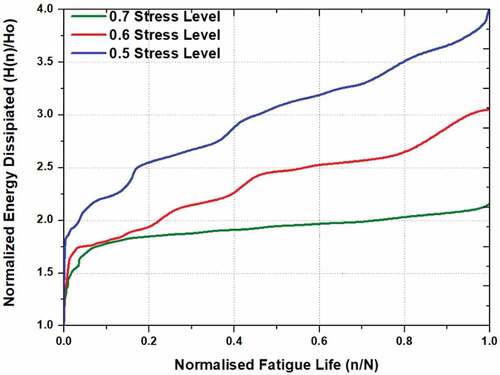
The energy dissipation curve is characterized by two transition points with different slopes. Figure reveals that energy dissipation is composed of three phases; initial rapid increase (Phase I), slow and steady dissipation (Phase II), and a sudden rise in dissipation (Phase III). Energy dissipation in Phase I and III covers 5% of the fatigue life and Phase II covers the remaining 95% of the life. Based on the experimental energy dissipation data and according to EquationEq. (2(2)
(2) ), damage growth behaviour of the Carbon/Epoxy laminates was developed and is shown in Figure . The theoretical damage growth model developed as per EquationEq. (3)
(3)
(3) and its comparison with experimental data is also shown in Figure . The damage growth trend is in line with the previously published literature (Alam et al., Citation2019; Ansari et al., Citation2018; Ziemian et al., Citation2016; Zong & Yao, Citation2017). At all stress levels, in the initial loading cycle damage growth was rapid and exhibited logarithmic evolution (Stage 1). This trend represents the rapid development of matrix debonding and multiple cracks. After the initial 5% of loading, the damage growth exhibited linear evolution (Stage II) and is mainly dominated by fibre/matrix delamination and random fibre fracture and covers a large part of the total fatigue life. Near the failure points, exponential evolution (Stage III) of the damage was observed and is due to the multiple fibre failures. The test conducted at a 0.5 stress level (Figure (c)) showed the exponential evolution of damage near the failure point. The theoretical damage growth model parameters (EquationEq. (3
(3)
(3) )) for Carbon/Epoxy laminates at 0.7, 0.6, and 0.5 stress levels were estimated by the least square method and are shown in Table . The R-Square value in Table indicates the accuracy of the fitting and with the help of the model parameter, it is possible to quantify the damage developed in the material at any given loading cycle.
Figure 7. Experimental and theoretical damage growth behaviour (a) 0.7, (b) 0.6 and (c) 0.5 stress level.
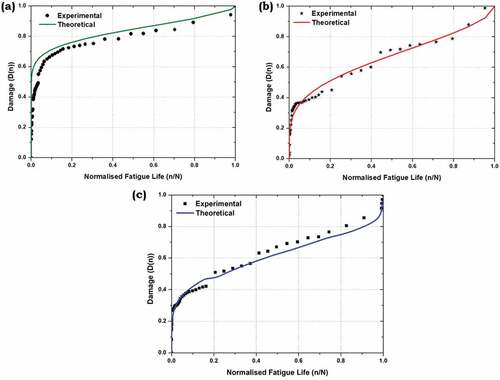
Table 2. Damage model parameters for Carbon/Epoxy quasi-isotropic laminates
The damage growth rate at different points of the loading cycle is estimated using EquationEq. (4)(4)
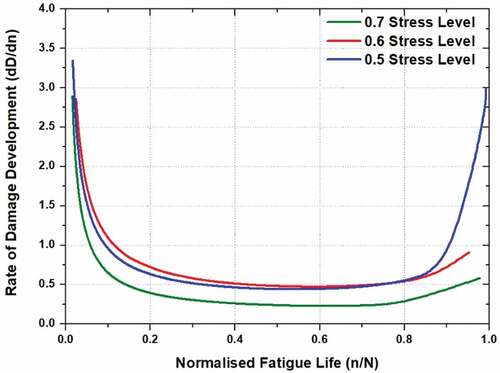
(4) and is shown in Figure . In general, the rate of damage growth during the initial and final loading cycles is found to be the same and at 0.5 stress level in particular. About 30% to 40% of the damage is developed during the initial loading cycles. At 0.7 and 0.6 stress levels, the failure is characterized by catastrophic fibre breakage. Hence, the damage growth rate near the failure points varies as compared to initial loading cycles.
Figure 8. Damage growth rate at the different points of loading cycles.
3.5. C-scan and SEM Observations
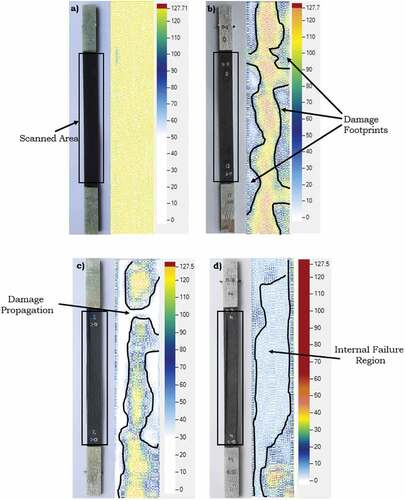
C-Scan is a non-destructive type of damage characterization technique, and scanning was conducted before the failure of the specimens. Scanning was performed on specimens after the completion of 2,00,000 cycles at 0.7 stress level, 4,50,000 cycles at 0.6 cycles, and 6,00,000 cycles at 0.5 stress level, and the obtained images were compared with neat specimen images. The comparison of damage propagation footprint at different stress levels is shown in Figure . The C-Scan of a neat or undamaged specimen (Figure )) shows a uniform color pattern and represents the complete transmission of ultrasound waves through its thickness. Fatigue loading of specimens at 0.5 stress level showed damage footprints along the specimen edges (Figure )) and it is also observed that these damage footprints propagated towards the center of the specimen. At 0.6 stress level, after the completion of 4, 50,000 cycles, micro-cracks/damage induced propagated towards the center of the specimen in the transverse direction. The white and light blue patches show the intensity of damage footprints. The amplitude of stress applied at 0.7 stress level was sufficient to induce fibre-oriented damages. C-Scan showed the presence of internal fibre failures (Figure )) at this stress level. Damage propagation and accumulation were observed in longitudinal and transverse directions.
Figure 9. C-scan images of Carbon/Epoxy laminate, (a) Neat specimen, (b) 0.5, (c) 0.6 and (d) 0.7 stress level.
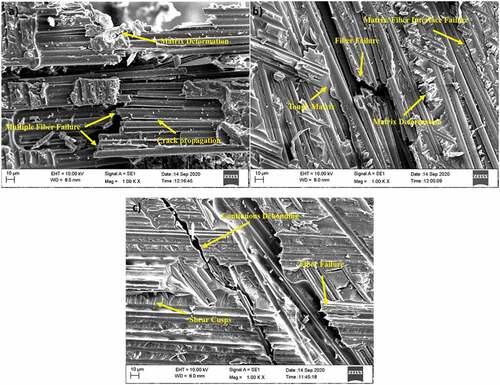
SEM images of completely failed specimens at 0.8, 0.7, and 0.6 stress levels are shown in Figure . At 0.8 stress level, multiple fibre failure and matrix deformation were observed (Figure )). High amplitude stress applied at this stress level is more than sufficient to induce the fibre failures and resulted in low fatigue life. As the applied stress level (0.7) decreased, the intensity of the matrix-dominated failures increased. Matrix deterioration, fibre/matrix interphase failure, and fibre failures were observed at the fracture surface (Figure )). Fatigue failure surface at 0.6 stress level, characterized by continuous debonding along the transverse direction, is shown in Figure (c). Abrasion or friction between the micro-cracks during fatigue loading introduced shear cusp or hackles on the matrix failure surface.
Figure 10. SEM images of fatigue failure surface, (a) 0.8, (b) 0.7 and (c) 0.6 stress level.
4. Conclusions
The present study has investigated the quasi-static and tension-tension fatigue behaviour of quasi-isotropic Carbon/Epoxy laminates. Experiments were conducted at a frequency of 2 Hz and a stress ratio of R = 0.1. Dissipated energy-based damage growth models were developed for different stress levels. Based on the study following conclusions were drawn;
The stress–strain curve showed a bilinear trend with two slopes separated by the intersection point or knee point. The knee point represented the failure point of 90° oriented fibres and the complete failure of the specimens occurred at a failure stress of 372.16 ± 30.51 MPa.
The stiffness degradation curve, energy dissipated, and damage growth curve at different stress levels are composed of three stages. These stages represent the damage/crack initiation, propagation, delamination, and fibre failure. The damage growth rate curve indicates the rapid growth of micro-cracks in the initial and final stages. In the second, steady and slow damage growth was observed. The theoretical damage model proposed based on energy dissipated is able to predict the fatigue damage at any point of the loading cycle.
C-Scan images showed damage growth and propagation along the transverse direction at a 0.5 stress level. At high-stress levels (0.6 and 0.7) high intensity of damage was observed within the internal plies.
SEM images of the failure surface showed the combination of the matrix as well as fibre-dominated failures at a 0.7 stress level. At 0.6 and 0.5 matrix dominated failures like continuous debonding and fibre/matrix interfacial debonding were observed.
Author statement
The authors are faculty members/research fellow at Manipal Institute of Technology, MAHE, Manipal, and are working in Advanced Composite Research Lab, Department of Aeronautical and Automobile Engineering. The research group focuses on studying the fatigue durability, wear characteristics, and moisture absorption behaviour of polymer matrix composites in various marine environments. Authors collectively participated in developing the concept, analysis, writing, and revision of the manuscript.
Acknowledgements
The authors gratefully acknowledge the Naval Research Board, Government of India (Project No: NRB-438/MAT/18-19) for providing the financial support. The authors also acknowledge the Department of Aeronautical and Automobile Engineering, MIT Manipal for providing manufacturing facilities.
Disclosure statement
No potential conflict of interest was reported by the author(s).
Additional information
Funding
Notes on contributors
Padmaraj N H
The authors are faculty members/research fellow at Manipal Institute of Technology, MAHE, Manipal, and are working in Advanced Composite Research Lab, Department of Aeronautical and Automobile Engineering. The research group focuses on studying the fatigue durability, wear characteristics, and moisture absorption behaviour of polymer matrix composites in various marine environments. Authors collectively participiated in developing the concept, analysis, writing, and revision of the manuscript.
Dayananda Pai K
The authors are faculty members/research fellow at Manipal Institute of Technology, MAHE, Manipal, and are working in Advanced Composite Research Lab, Department of Aeronautical and Automobile Engineering. The research group focuses on studying the fatigue durability, wear characteristics, and moisture absorption behaviour of polymer matrix composites in various marine environments. Authors collectively participiated in developing the concept, analysis, writing, and revision of the manuscript.
Shreepannaga Shreepannaga
The authors are faculty members/research fellow at Manipal Institute of Technology, MAHE, Manipal, and are working in Advanced Composite Research Lab, Department of Aeronautical and Automobile Engineering. The research group focuses on studying the fatigue durability, wear characteristics, and moisture absorption behaviour of polymer matrix composites in various marine environments. Authors collectively participiated in developing the concept, analysis, writing, and revision of the manuscript.
M Vijaya Kini
The authors are faculty members/research fellow at Manipal Institute of Technology, MAHE, Manipal, and are working in Advanced Composite Research Lab, Department of Aeronautical and Automobile Engineering. The research group focuses on studying the fatigue durability, wear characteristics, and moisture absorption behaviour of polymer matrix composites in various marine environments. Authors collectively participiated in developing the concept, analysis, writing, and revision of the manuscript.
References
- Alam, P., Mamalis, D., Robert, C., Christophe, F, Conchur, B (2019). The fatigue of carbon fibre reinforced plastics - A review. Composites Part B: Engineering, 166, 555–15. https://doi.org/10.1016/j.compositesb.2019.02.016
- Ansari, M. T. A., Singh, K. K., & Azam, M. S. (2018). Fatigue damage analysis of fiber-reinforced polymer composites—A review. Journal of Reinforced Plastics and Composites, 37(9), 636–654. https://doi.org/10.1177/0731684418754713
- Capela, C., Oliveira, S. E., & Ferreira, J. A. M. (2019). Fatigue behavior of short carbon fiber reinforced epoxy composites. Composites Part B: Engineering, 164, 191–197. https://doi.org/10.1016/j.compositesb.2018.11.035
- Carraro, P. A., & Quaresimin, M. (2015). A stiffness degradation model for cracked multidirectional laminates with cracks in multiple layers. International Journal of Solids and Structures, 58, 34–51. https://doi.org/10.1016/j.ijsolstr.2014.12.016
- De Finis, R., & Palumbo, D. (2020). Estimation of the dissipative heat sources related to the total energy input of a cfrp composite by using the second amplitude harmonic of the thermal signal. Materials (Basel), 13(12), 1–18. https://doi.org/10.3390/ma13122820
- De Finis, R., Palumbo, D., & Galietti, U. (2021). An experimental procedure based on infrared thermography for the assessment of crack density in quasi-isotropic CFRP. Engineering Fracture Mechanics, 258, 108108. https://doi.org/10.1016/j.engfracmech.2021.108108
- Degrieck, J., & Van Paepegem, W. (2001). Fatigue damage modeling of fibre-reinforced composite materials: Review. Applied Mechanics Reviews, 54(4), 279–300. https://doi.org/10.1115/1.1381395
- Giancane, S., Panella, F. W., & Dattoma, V. (2010). Characterization of fatigue damage in long fiber epoxy composite laminates. International Journal of Fatigue, 32(1), 46–53. https://doi.org/10.1016/j.ijfatigue.2009.02.024
- Habibi, M., Laperrière, L., & Hassanabadi, H. M. (2019). Effect of moisture absorption and temperature on quasi-static and fatigue behavior of nonwoven flax epoxy composite. Composites Part B: Engineering, 166, 31–40. https://doi.org/10.1016/j.compositesb.2018.11.131
- Huang, J., Pastor, M. L., Garnier, C., & Gong, X. J. (2019). A new model for fatigue life prediction based on infrared thermography and degradation process for CFRP composite laminates. International Journal of Fatigue, 120, 87–95. https://doi.org/10.1016/j.ijfatigue.2018.11.002
- Llobet, J., Maimí, P., Mayugo, J. A., Essa, Y., & Martin de la Escalera, F. (2017). A fatigue damage and residual strength model for unidirectional carbon/epoxy composites under on-axis tension-tension loadings. International Journal of Fatigue, 103, 508–515. https://doi.org/10.1016/j.ijfatigue.2017.06.026
- Mallick, P. K. (2007). Fiber- reinforced composites materials, manufacturing and design, third. CRC Press Taylor & Francis Group.
- Mohd Tahir, M., Wang, W. X., & Matsubara, T. (2018). Failure behavior of quasi-isotropic carbon fiber-reinforced polyamide composites under tension. Advanced Composite Materials, 27(5), 483–497. https://doi.org/10.1080/09243046.2017.1405605
- Montesano, J., Fawaz, Z., & Bougherara, H. (2013). Use of infrared thermography to investigate the fatigue behavior of a carbon fiber reinforced polymer composite. Composite Structures, 97, 76–83. https://doi.org/10.1016/j.compstruct.2012.09.046
- Movahedi-Rad, A. V., Keller, T., & Vassilopoulos, A. P. (2018). Fatigue damage in angle-ply GFRP laminates under tension-tension fatigue. International Journal of Fatigue, 109, 60–69. https://doi.org/10.1016/j.ijfatigue.2017.12.015
- Naderi, M., & Khonsari, M. M. (2013). On the role of damage energy in the fatigue degradation characterization of a composite laminate. Composites Part B: Engineering, 45(1), 528–537. https://doi.org/10.1016/j.compositesb.2012.07.028
- Padmaraj, N. H., Vijaya, K. M., & Dayananda, P. (2020). Experimental study on the tension-tension fatigue behaviour of glass/epoxy quasi-isotropic composites. Journal of King Saud University, Engineering Sciences, 32, 396–401. https://doi.org/10.1016/j.jksues.2019.04.007
- Padmaraj, N. H., Vijaya, K. M., & Dayananda, P. (2021). Experimental investigation on fatigue behaviour of glass/epoxy quasi-isotropic laminate composites under different ageing conditions. International Journal of Fatigue, 143, 105992. https://doi.org/10.1016/j.ijfatigue.2020.105992
- Padmaraj, N. H., Vijaya, K. M., Shreepannaga, S., Amritha, U., & Dayananda, P. (2021). Slurry erosion behaviour of carbon/epoxy quasi-isotropic laminates based on Taguchi’s optimization method. Engineering Failure Analysis, 123, 105274. https://doi.org/10.1016/j.engfailanal.2021.105274
- Sen, L. D., Jiang, N., Zhao, C. Q., Lei, J, Yi, T (2015). Experimental study on the tension fatigue behavior and failure mechanism of 3D multi-axial warp knitted composites. Composites Part B: Engineering, 68, 126–135. https://doi.org/10.1016/j.compositesb.2014.08.042
- Sisodia, S., Gamstedt, E. K., Edgren, F., & Varna, J. (2015). Effects of voids on quasi-static and tension fatigue behaviour of carbon-fibre composite laminates. Journal of Composite Materials, 49(17), 2137–2148. https://doi.org/10.1177/0021998314541993
- Tessema, A., Ravindran, S., & Kidane, A. (2018). Gradual damage evolution and propagation in quasi-isotropic CFRC under quasi-static loading. Composite Structures, 185, 186–192. https://doi.org/10.1016/j.compstruct.2017.11.013
- Vassilopoulos, A. P. (2020). The history of fiber-reinforced polymer composite laminate fatigue. International Journal of Fatigue, 134, 105512. https://doi.org/10.1016/j.ijfatigue.2020.105512
- Vieira, P. R., Carvalho, E. M. L., Vieira, J. D., & Toledo Filho, R. D. (2018). Experimental fatigue behavior of pultruded glass fibre reinforced polymer composite materials. Composites Part B: Engineering, 146, 69–75. https://doi.org/10.1016/j.compositesb.2018.03.040
- Wang, X., Zhao, X., & Wu, Z. (2019). Fatigue degradation and life prediction of basalt fiber-reinforced polymer composites after saltwater corrosion. Materials & Design, 163, 107529. https://doi.org/10.1016/j.matdes.2018.12.001
- Wu, F., & Yao, W. X. (2010). A fatigue damage model of composite materials. International Journal of Fatigue, 32(1), 134–138. https://doi.org/10.1016/j.ijfatigue.2009.02.027
- Ziemian, C. W., Ziemian, R. D., & Haile, K. V. (2016). Characterization of stiffness degradation caused by fatigue damage of additive manufactured parts. Materials & Design, 109, 209–218. https://doi.org/10.1016/j.matdes.2016.07.080
- Zong, J., & Yao, W. (2017). Fatigue life prediction of composite structures based on online stiffness monitoring. Journal of Reinforced Plastics and Composites, 36(14), 1038–1057. https://doi.org/10.1177/0731684417701198