
 ?Mathematical formulae have been encoded as MathML and are displayed in this HTML version using MathJax in order to improve their display. Uncheck the box to turn MathJax off. This feature requires Javascript. Click on a formula to zoom.
Abstract
This work emphasizes the investigation that was carried out on SiC powder reinforced Al–Si–Mg ternary alloy TIG weld composite for analyzing, predicting and optimizing the hardness using Taguchi and Response Surface Methodology (RSM). The study focused on optimizing the TIG welding parameters viz, welding current, welding speed, SiC wt.% and gas flow rate for the hardness of composite using RSM. Samples prepared with varying weight percentages of SiC (8,10,12) were subjected to the TIG welding process using ER5356 filler material. A second-order response surface model for hardness is established from experimental data. The predicted as well as measured values are fairly close by, which specifies that the established model can be well utilized to predict the hardness with 95% confidence intervals. Using such a model, one can achieve significant savings in time and cost. The signal to noise ratio of process parameters analysis shows that reinforcement quantity in the composite has the maximum ranking weightage (statistical influence 72.72%) followed by welding current (22.98%), other parameter effect is negligible. The 3D surface plot reveals that maximum hardness lies in the region obtained with the welding current of 210–220 A with 10–12 wt.% SiC and above. From the confirmatory experiments for hardness, it is seen that the experimental and mathematical model results were found fairly with a close agreement.
1. Introduction
Development in the field of materials revolution has incited innumerable novel resources. Al6061–SiC composites are one among the expanding classes of materials that are used for several applications, viz. marine, aviation, automobile, and construction industries. The extensive usage of these for several applications is a direct result of its value-added properties, viz. high strength, excellent weldability, resistance to corrosion, and high strength to weight ratio properties. Aluminium, copper, lead, magnesium, nickel, titanium and the alloys of these metals are important nonferrous metals and alloys. To comply with the requirements for some specific applications, pure metals are not used in the as-cast conditions. In addition, there are also a few special-purpose non-ferrous metals and their alloys. Aluminium, and its alloys are used in a variety of cast, wrought forms and heat-treated conditions. Forgings, sections, extrusions, sheets, plates, strips and wire are some examples of wrought forms, while castings are accessible as sand, pressure and gravity die castings. In practice merely very few elements have been confirmed to be appropriate as alloying add-ons in aluminium wrought and cast materials for structural use. They are magnesium, silicon, manganese, copper and zinc that are utilized as distinct elements besides as blends. These alloying add-ons expand the properties of aluminium when added in preferred proportions. Among the non-ferrous metals and alloys, the prime one is aluminium and its alloys (Senthilkumar et al., Citation2007; Urena et al., Citation2000).
Current day manufacturing industry trusts greatly weld components and structures. Thus, weld integrity turns out to be essential for adequate and consistent performance of components, and structures. Weld integrity is reliant on the base material, specifications, and joining processes. With the increasing intricacy of process, materials, and conditions, it is compulsory to have extensive, widespread knowledge of metallurgy and joining processes. Fusion welding of composites has been found challenging due to the dissimilar properties of base matrix and the particulate reinforcement. Uniqueness and comparative intricacy of composite enhance undesirable technical hitches to the challenging field leading to interruptions, ineffective and trustworthy weld joints in composites (Kumar & Sundarrajan, Citation2006).
The most common fusion welding practices are TIG and MIG welding. Except for tungsten inert gas (TIG) welding and metal inert gas (MIG) welding, all other conventional welding has been found ineffective (Chen et al., Citation2002). TIG welding is a high-quality weld that uses a non-consumable electrode. The current utilized in TIG welding is smaller than in MIG and it may or may not be used with a filler wire. Fusion welding methods usually result in defects like porosity, oxide formation and hot cracking. These defects are an outcome of various reasons during the process. Entrapment and dissolution of the gases in the weld zone during solidification leads to porosity that has been overcome by the TIG welding process which has less hydrogen gas contamination of the filler wire during melting. Using alternate current during the TIG welding process with appropriate shielding gas reduces the oxide formation, hence oxide inclusion in the weld metal. The hot cracking defect is reduced by using a filler metal possessing a melting point nearer to that of base metal. Above all, important parameters like the welding current, welding speed and gas flow rate are to be considered along with proper weld preparation and joint design (Jahangiri et al., Citation2013; Mathers, Citation2002). The chemical reaction is one key issue in most of the fusion welding processes for MMCs. This is due to the long contact period between a molten metal matrix and particulate reinforcement that leads to adverse chemical reactions. The liquid aluminium will react with SiC reinforcement to precipitate aluminium carbide (Al4C3) and also intensify the silicon content upon cooling down the molten metal matrix, according to the interface reaction (Urena et al., Citation2000).
TIG welding requires skilled operators because it joins additional metals and its alloys compared to other processes with appreciable quality and precision having pinpoint control. It produces appealing weld beads without the spatter, sparks, smoke or fumes. TIG welding is normally used when superior quality and precision welding are required. Flux is not used, on the other hand, the arc, and molten metal are safeguarded using inert gases like argon, helium, hydrogen, nitrogen or mixtures of certain these. Helium is commonly added to increase heat input to increase welding speed or weld penetration. TIG weld quality is powerfully categorized through the weld zone geometry and type of filler metal used. The weld geometry plays a vital role to determine the mechanical properties of weld. The filler metal contributes valuable properties by alloying and imparting wettability during the event of welding of composites. For that reason, it is very essential to select the welding process parameters for attaining an optimal weld zone geometry (Juang et al., Citation1998; Tarng et al., Citation1999; Zeng et al., Citation1993; Zhang et al., Citation1996). Commonly, the microstructure and the mechanical properties of an aluminium alloy will vary after welding because of the melting of base material in the course of the welding (Rajesh & Pandey, Citation2012). The ideal welding process of aluminium alloy is often TIG welding owing to its relatively easier applicability and enhanced economy (Singh et al., Citation2013). TIG welding is a good quality welding process used to weld thin metals and their alloy compared to other welding processes to produce joints of superior quality without atmospheric contamination with or without filler metal free of spatter and low distortion. TIG accompanies certain limitations like it requires greater welder dexterity than MIG and it is a slower process because of lower deposition rates and applies to smaller sections.
DOE is a technique to determine the correlation between the output of the process and factors affecting a process. Thus, it is generally defined as the “design of any information-gathering exercise where variation is present, under the control of the experiment or not”. This information is needed to control the process inputs to optimize the output. All variables affecting the process are varied systematically for determining the correlation between input and output. The whole process is carried out under a minimal number of experimental runs, time and money. DOE is the statistical technique that facilitates the investigator to conduct realistic research, evaluate facts proficiently, and draw significant inferences from the study and the novel purpose for the investigation. Experimental techniques are generally used in research as well as in industrial applications. A scientific method for planning an experiment is required to conduct it efficiently. A statistical plan of experiments is the method of planning an experimental trial so that information will be collected and investigated by statistical methods ensuing valid and unbiased conclusions. There are two features to any experimental problem, the design of the experiment and the statistical analysis of the data (Montgomery et al., Citation2005). Taguchi has envisaged a novel technique of conducting the design of experiments that are based on definite guidelines. This method uses orthogonal arrays that include the concept of line graphs, which helps a scientist or an engineer to design and analyze complicated experiments without requiring the knowledge of statistics by specifying the ways of conducting the least number of experiments that could give the complete information of all the factors that affect the performance. This technique is used to formulate the experimental layout to evaluate the influence of each welding parameter to achieve optimum conditions. This method has gained popularity in research as an effective tool for productivity improvement for producing quality products faster at a low cost (Bendell et al., Citation1989; R Shetty et al., Citation2008).
Analysis of variance (ANOVA) is a technique utilized for predicting the relative significance of process parameters and also to calculate the error that occurred. It reveals the percentage involvement of individual factors and offers a superior impression of the relative influence of different factors on experimental output. It is furthermore desirable for judging the error variance for the factor effect and the variance of forecasted error. ANOVA scrutinizes design parameters that significantly affect quality characteristics. This analysis is conducted for a significant level of 5%, i.e., for a level of confidence of 95% (Montgomery et al., Citation2005).
Response surface methodology was developed by Box and Wilson in the 1950s. It uses the design of experiments and statistical techniques for model construction and optimization. The surface finish, weld zone geometry and hardness of welded materials are significant in manufacturing engineering applications. While welding, the superiority of the parts can be attained through suitable welding settings. To be familiar with the surface quality and dimensional properties in advance, it is essential to hire theoretic models that make it viable to accurately forecast terms of the function of operational conditions (Sahin & Motorcu, Citation2005). RSM is a combination of experimental design and statistical techniques for modeling and optimization. RSM is a very useful tool designed for modeling and analysis in which the objective is to optimize the response which is influenced by several variables (Montgomery et al., Citation2005). The summary of literature referred pave the way for to use of statistical techniques for modeling and optimization to arrive at the fine-tuned value of the parameters chosen. In the earlier research, even though state-of-the-art experiments were conducted to find the feasible combination of process parameters for the improvement of mechanical characteristics on weldeded joints of Al-SiC-Mg based composits, the optimization of process parameters is shallow. Hence, our contribution in the present study is to predict and optimize the process parameters of TIG weld aluminium ternary alloy–SiC composite hardness. Taguchi and RSM statistical tools are used to analyze, predict and optimize the process parameters of TIG weld aluminium ternary alloy–SiC composite hardness. The novelty of the work is the detailed statistical analysis of the TIG welding parameters to optimize the process parameters for higher hardness of the joint.
2. Experimental details
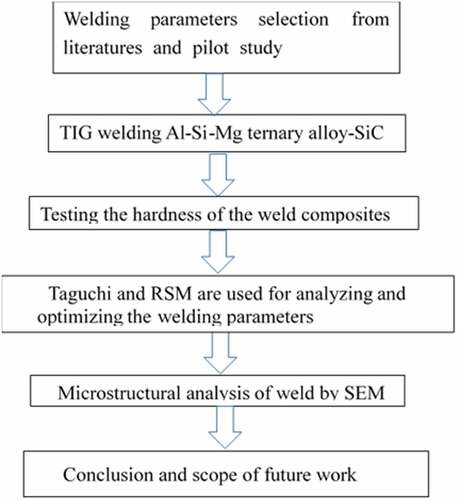
This section describes the experimental details of processing, hardness measurement as well as the design of experiments for Al–Si–Mg ternary alloy with SiC powder reinforcement composite. The methodology followed in the present research work is indicated in .
Figure 1. Flow chart shows the methodology of the work.
2.1. Fabrication
The material used is Al–Si–Mg ternary alloy with SiC powder as reinforcement. The SiC powder size (8, 10 and 12 wt.%) of a mean diameter 25 μm is used in this research work. The chemical composition of base metal, filler metal and weldment area used in the present work are shown in . The Butt welding specimens of the composite are prepared as per B.I.S No. 813–1986.
Table 1. Chemical composition of the base metal (Al–Si–Mg ternary alloy), filler material (ER5356) and weld
2.2. Welding experiments
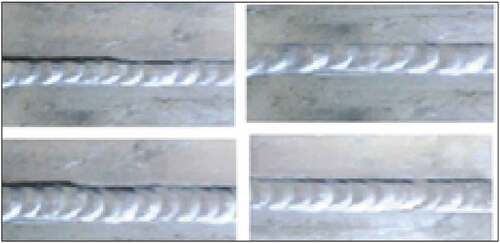
The servo mechanism is speed-controlled, and a non-consumable tungsten electrode is utilized to strike an arc between pieces to weld. Heat is generated with an electric arc meltdown the base metal and joined with ER5356 filler material. The welding power source is a thermal AC welding machine (HERO TIG 250P). The shielding gas used is argon and its flow rate is controlled by a valve meter. Further by changing the welding parameters viz., welding current, welding speed and gas flow rate, a single pass welding has been accomplished. Buttweld specimens are shown in .
Figure 2. Buttweld specimens.
2.3. Hardness measurement
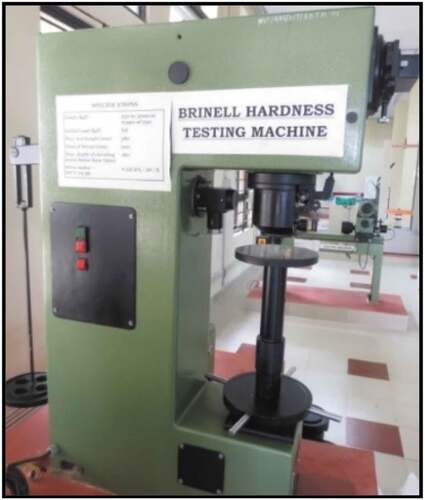
Hardness tests are done in Brinell hardness testing machine (SAROJ Brinell Hardness testing machine, Model: B/3000/00, Sl # 13/06/08-India; ) having indenter of a steel ball of 5 mm diameter with a load of 250 kgf. The samples for the hardness test were flattened.
Figure 3. Brinell hardness measuring machine.
shows the hardness values of the varying weight percentage SiC in the as-received condition. Rectangular-shaped specimens are cut and as-weld hardness is checked.
Table 2. Hardness of composites
2.4. Design of experiments
2.4.1. Taguchi experimental design
Taguchi analysis is conducted using the MINITAB software. The Signal-to-Noise (S/N) ratio characteristic (larger is better) is as given in EquationEquation (1)(1)
(1) .
where n is the number of observations and y is the witnessed data. S/N ratio values were calculated by taking the above equation into account (Montgomery et al., Citation2005). summarizes the welding test parameters and intensities with varying wt.% of SiC and the experimental plan of Taguchi L27 orthogonal array is as shown in . An orthogonal array is employed to find the ideal welding parameters for Al6061 with varying wt.% of SiC reinforced composite (PK Shetty et al., Citation2014).
Table 3. Levels of welding parameters and varying wt.% of SiC
Table 4. Taguchi’s L27 orthogonal array
2.4.2. RSM experimental design
In RSM, a second-degree polynomial regression equation is fit to experimental data, to model the correlation between hardness and welding parameters. Also, RSM is used for finding the optimum welding parameters. In RSM, a central composite design is used because it can establish a relationship between the response and the parameters with the least number of experiments without loss of accuracy (Myers et al., Citation2016). RSM model is developed using MINITAB software. shows the RSM experimental design matrix.
Table 5. RSM experimental design matrix
The relationship between the output variable “y” and the welding parameters (welding current, welding speed, gas flow rate and SiC wt.%) is expressed in the form of a second degree linear polynomial regression ; Montgomery, Citation2005).
where, β0, β1, β2, … .β14 are the regressor coefficients and ε is the random error.
3. Results and discussion
Statistical analysis for hardness
In welding, the weld quality mainly depends on metallurgical features and chemical compositions of the weld zone. The variables in welding are simplified using Taguchi design of experiments. The hardness was measured experimentally and predicted by RSM. shows the experimental and predicted results of hardness followed by an error. The maximum error obtained from the RSM prediction is less than 7%, which seems to be acceptable.
Table 6. Comparison of experimental values of hardness with the values predicted by RSM
Taguchi analysis reveals that a percentage increase in the reinforcement particle plays an important role in the enhancement of hardness values. Metallurgically, it is true because harder and high melting point reinforcement develops a strong interface in the matrix and the difference in melting point of the matrix and reinforcement develops a misfit strain at the interface, which reflects as hardness/ tensile strength increases. The main effect plots for the SN ratio and mean of means show that hardness increase with an increase in wt.% of the SiC particles. The SiC gradient shows a steeper curve than welding current, welding speed and gas flow rate. This infers that the influence of SiC particle is more and it escalates with a percentage increase. Both the plot shows that the Al–Si–Mg ternary alloy SiC-12 wt.%, followed by a welding current of 220 A, welding speed of 140 mm/min and gas flow rate of 14 L/min is the optimum condition attained to develop the maximum hardness value in the weld-zone. As welding current increases, since more temperature is induced at the interface in the weld zone further leading to more residual stress and brittleness resulting in poor weldability, even though hardness is of higher value. Such cases may require post welding heat treatment to recover the toughness (Kumar & Sundarrajan, Citation2006).
Figure 4. (a) Main effect plot for SN ratios for hardness; (b) mean of means for hardness.
In as-weld conditions, the hardness value escalates as the reinforcement is added in comparison to unreinforced alloy. In composites also the as-cast hardness value increases with an increase in the weight percentage of SiC. Escalation in the hardness is to be anticipated because SiC particles being a hard dispersoid completely add to the hardness of the composite (Kumar et al., Citation2010). The response in shows that SiC wt.% has the higher ranking weightage followed by welding current, welding speed and gas flow rate. Table indicates that the percentage of physical and statistical influence of SiC is 72.72%, followed by the welding current of 22.98%, welding speed of 1.54% and gas flow rate of 0.016% which has been automatically generated by the statistical tool used for the experimentation from the process output parameters obtained experimentally.
Condition: Larger is better.
Table 7. Response table of signal to noise ratios for hardness
The outcome of ANOVA for the response function hardness is shown in the following tables. The analysis is conducted for a significance level of 5%, i.e., for a level of confidence of 95%. From the analysis of , it is obvious that F calculated value is larger than the F-table value (F0.05, 9, 10 = 3.02), and hence second-order response function established is reasonably acceptable. clarifies that hardness drops with the increase of welding current and decreases with an increase in welding speed.
Table 8. Analysis of variance for signal to noise ratios of hardness
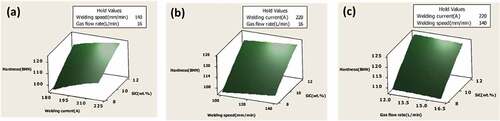
From the 3D surface plot (), it has been observed that maximum hardness is achieved at a welding current of 220 A, SiC 12 wt.%, 140 mm/min welding speed and gas flow rate of 12 L/min. Welding current in the range of 180–190 A and SiC 8–9 wt.% gives the minimum hardness region whereas welding current in the range 210–220 A with SiC 11–12% gives the maximum hardness. From the ANOVA and 3D surface plots, it may be concluded that wt.% of reinforcement (SiC quantity) has a maximum contribution to the hardness raise. Since SiC is a very hard particle, the overall matrix hardness increase depends upon the maximum strain incurred at the interface of the matrix and reinforcement. It will be reflected as hardness increases in the composite. Also, amperage of current increases the heat input in the weld zone, and allows faster rate of melting so that insoluble matrix phase inclusion in the weld zone is avoided. As the gas flow rate increases, contamination in the weld zone is minimized to form a clean joint with a good bead appearance. As welding speed increases, heat input reduces in the spot and decelerates the fusion process, which increases bead surface hardness due to a faster cooling rate.
Figure 5. 3D surface plot showing the interaction effects of (a) welding current and SiC; (b) welding speed and SiC; (c) gas flow rate and SiC for hardness.
3.1. Optimization and confirmation test
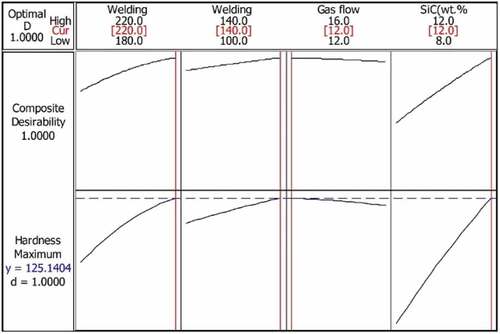
Here, response surface optimization is used for determining the best combination of welding parameters to achieve maximum hardness in weld composite. shows the hardness response optimization for welded composite. The optimum parameters obtained are welding current of 220 A, welding speed of 140 mm/min, gas flow rate of 12 L/min and SiC 12 wt.% for welded composite.
Figure 6. Hardness response optimization plot for weld composite.
A confirmation test has also been carried out on the optimized combination and found that the experimental values are slightly lower than the optimized condition values which in turn reveals that the optimized values are in good agreement as required with the values given by Taguchi’s analysis. Hardness confirmation revealed a small hike in the experimental values and thus proved to be satisfactory and supported the analysis values.
3.2. Microstructure of the as-weld composites
Microstructure reveals details of dispersion of the SiC particles in the weld zone of the as-weld composites. The analysis may be used for an in-depth study of the quality of composite. For confirming the degree of spread out of silicon carbide particles, the as-weld samples are examined by SEM. The images show the microstructure of Al6061alloy and its composites (8, 10 and 12 wt.% SiC). ) shows equiaxial grains without elongated or columnar shapes. It shows that self-cooling given to the weld is the optimum cooling rate to get the sound weld bead. Figure ) shows an 8 wt% SiC aluminium alloy composite weld bead. The reinforcement spread out is good in the matrix with a higher interparticle distance. ) shows a 10 wt% SiC reinforced aluminium alloy composite weld bead with particles well dispersed in the matrix. ) shows 12 wt% SiC reinforced aluminium alloy composite weld bead with more number of particles (Least interparticle distance as compared to (b) and (c)). The well defined grain structure is not visible in all composite weld conditions, which is the normal behavior observed in the weld joints of alloy composites. It confirms good spread out of SiC elements in the composite weld region without any reinforcement accumulation or cluster as shown in ( (a)–(d)).
Figure 7. Weld zone SEM of 10 µm for (a) Al ternary alloy, (b) Al ternary alloy—8 wt.% SiC, (c) Al ternary alloy—10 wt.% SiC and (d) Al ternary alloy—12 wt.% SiC composites.
3.3. Weld zone hardness measurement
In as-weld conditions, the hardness is taken along the weld direction and on the base metal of the composite. Using ER5356 filler material containing magnesium might give decent wettability of ceramic reinforced elements with equitable metal matrix bondage throughout the solidification of the liquefied puddle at the joint. Inner residual stress in the metal matrix during solidification and the existence of a great number of eutectic phases will take an impact on hardness in the weld zone (Wysocki et al., Citation2009). It was seen that at the weld zone the hardness value increases regardless of the reinforcement magnitude existing in the composite and hardness reduced by around 30–60% in the base metal when matched with that of the heat-affected zone. This is owing to the annealing effect made by the slower cooling of reinforced particles (Wysocki et al., Citation2009).
and show the hardness dissemination on the weld specimens perpendicular to the welding path in as-weld conditions.Ultimate hardness is witnessed in the weld zone, minimum at unweld zones (base metal) and moderate in the heat-affected zone. In the as-weld condition, the value of hardness number increases with the increase in the magnitude of reinforcement when compared with unreinforced alloy. Three reliable indentation readings are taken in each sample at different sites and average hardness is considered as the hardness number for each case. The hardness number at the weld zone in the as-weld condition is somewhat upper than in other regions. This may perhaps occur owing to the rapid cooling of the weld in the course of solidification (Zhao et al., Citation1991). Hardness measured along weld zone in as-weld condition and base metal found a great improvement for similar composite after homogenizing and age hardening treatment (Jayashree et al., Citation2021). In the other words, hardness distribution trend across the weld bead in all the composites remains same. Heat-affected zone experiences heat treatment and the hardness obtained is slightly higher than the region which is not affected by the heating and cooling process (welding or heat treatment).
Figure 8. Error bar chart shows the Hardness distribution at the weld zone and unweld zones.
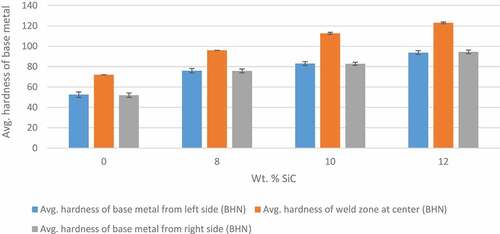
Table 9. Hardness distribution at the weld zone and unweld zones
4. Conclusions
Al–Si–Mg ternary alloy–SiC composites are TIG welded using filler metal and the hardness data obtained on the weld and heat-affected zones are recorded. The microstructure of composites is analyzed to confirm the uniform spread out of the reinforcement in the base metal. The following conclusion is the reflection of the work performed and is in line with the set objectives. By the methodology, performance test and analysis, the following conclusions have arrived:
As the reinforcement content and welding current increase, the hardness of the weld bead increases.
A second-order response surface model for hardness was established from the observed data. The predicted and measured values are honestly close, which specifies that the established model can be successfully used to forecast hardness with 95% confidence intervals. Using such a model, significant savings in time and cost can be achieved.
As per SN ratios and means reveal that 12 wt.% SiC has the greater influence for getting the maximum hardness.
The 3D surface plot reveals that the maximum hardness lies in the region obtained with the welding current of 210−220 A with 11–12 wt.% SiC and above.
RSM optimization of Al–Si–Mg ternary alloy–12 wt.% SiC composite shows excellent hardness in the group with a welding current of 220 A, welding speed of 140 mm/min and gas flow rate of 12 L/min.
From the confirmatory experiments for hardness, it is seen that the experimental results and mathematical model results are fairly close for all tests. There is scope for futurework with regard to the study conducted in this paper. Deformation assisted heat treatment (thermo mechanical treatment) may be given by selecting very small cold deformation density to improve the property further.
Disclosure statement
No potential conflict of interest was reported by the author(s).
References
- Bendell, A., Disney, J., & Pridmore, W. A. (1989). Taguchi methods—application in world application. In Ind Product Improv Case Study.
- Chen, M., Wu, C., & Gao, J. (2002). Welding of SiC particle reinforced 6061 Al matrix composite with pulsed TIG. Transactions of Nonferrous Metals, Society of China, 12(5), 805–18.
- Jahangiri, A., Idris, M. H., & Farahany, S. (2013). Investigation on tungsten inert gas welding of in situ Al-15 and 20 Mg2Si composites with an Al-Si filler. Journal of Composite Materials, 47(10), 1283–1291. https://doi.org/10.1177/0021998312446825
- Jayashree, P. K., Gowrishankar, M. C., Sharma, S., Shetty, R., Hiremath, P., & Shettar, M. (2021). The effect of SiC content in aluminum-based metal matrix composites on the microstructure and mechanical properties of welded joints. Journal of Materials Research and Technology, 12(3) , 2325–2339. https://doi.org/10.1016/j.jmrt.2021.04.015
- Juang, S. C., Tarng, Y. S., & Lii, H. R. (1998). A comparison between the back-propagation and counter-propagation networks in the modeling of the TIG welding process. Journal of Materials Processing Technology, 75(1–3), 54–62. https://doi/org/10.1016/S0924-0136(97)00292-6
- Kumar, A., & Sundarrajan, S. (2006). Selection of welding process parameters for the optimum butt-joint strength of an aluminum alloy. Materials and Manufacturing Processes, 21(8), 779–782. https://doi/org/10.1080/036025/50600/728117
- Kumar, G. B. V., Rao, C. S. P., Selvaraj, N., & Bhagyashekar, M. S. (2010). Studies on Al6061-SiC and Al7075-Al2O3 metal matrix composites. Journal of Minerals and Materials Characterization and Engineering, 9, 43–55 doi: 10.4236/jmmce/2010/91004.
- Mathers, G. (2002). The welding of aluminium and its alloys. Woodhead publishing.
- Montgomery, D. C. (2005). Design and analysis of experiments. John Wiley and Sons.
- Montgomery, D. C., Myers, R. H., Carter, J. W. H., & Vining, G. G. (2005). The hierarchy principle in designed industrial experiments. Quality and Reliability Engineering International, 21(2), 197–201. https://doi.org/10.1002/qre.615
- Myers, R. H., Montgomery, D. C., & Anderson-Cook, C. M. (2016). Response surface methodology: Process and product optimization using designed experiments. John Wiley & Sons.
- Rajesh, P. V., & Pandey, K. N. (2012). Investigation of fatigue life of 6061-T6 and 5083-O aluminium alloys welded by two welding processes-manual metal arc welding and metal inert gas welding. International Conference on Mechanical & Industrial Engineering. (Icmie)-9th S Dehradun.
- Sahin, Y., & Motorcu, A. R. (2005). Surface roughness model for machining mild steel with coated carbide tool. Materials & Design, 26(4), 321–326. https://doi.org/10.1016/j.matdes.2004.06.015
- Senthilkumar, T., Balasubramanian, V., Babu, M. Y. S., & Sanavullah, M. Y. (2007). Effect of pulsed current GTAW parameters on fusion zone microstructure of AA6061. International Journal of Mechanical and Materials, 13(4), 345–351. https://doi.org/10.1007/BF03027892
- Shetty, R., Pai, R. B., Rao, S. S., & Kamath, V. (2008). Machinability study on discontinuously reinforced aluminium composites (DRACs) using response surface methodology and Taguchi’s design of experiments under dry cutting condition. Maejo International Journal of Science and Technology, 2(1), 227–239.
- Shetty, P. K., Shetty, R., Shetty, D., Rehaman, N. F., & Jose, T. K. (2014). Machinability study on dry drilling of titanium alloy Ti-6Al-4V using L9 orthogonal array. Procedia Materials Science, 5(1), 2605–2614. https://doi.org/10.1016/j.mspro.2014.07.521
- Singh, G., Kumar, S., & Singh, A. (2013). Influence of current on microstructure and hardness of butt welding aluminium AA6082 using GTAW process. International Journal of Research in Mechanical Engineering and Technology, 3, 143–146. ISSN: 2249-5762 .
- Tarng, Y. S., Tsai, H. L., & Yeh, S. S. (1999). Modeling, optimization and classification of weld quality in tungsten inert gas welding. International Journal of Machine Tools and Manufacture, 39(9), 1427–1438. https://doi.org/10.1016/S0890-6955(99)00013-9
- Urena, A., Escalera, M. D., & Gil, L. (2000). Influence of interface reactions on fracture mechanisms in TIG arc-welded aluminium matrix composites. Composites Science and Technology, 60(4), 613–622. https://doi.org/10.1016/S0266-3538(99)00168-2
- Wysocki, J., Gawdzińska, K., & Lenart, S. (2009). Weld microstructure in cast AlSi9/SiC (p) metal matrix composites. Archives of Foundry Engineering, 9, 173–176.
- Zeng, X. M., Lucas, J., & Fang, M. T. C. (1993). Use of neural networks for parameter prediction and quality inspection in TIG welding. Transactions of the Institute of Measurement and Control, 15(2), 87–95. https://doi.org/10.1177/014233129301500204
- Zhang, Y. M., Kovacevic, R., & Li, L. (1996). Characterization and real-time measurement of geometrical appearance of the weld pool. International Journal of Machine Tools and Manufacture, 36(7), 799–816. https://doi.org/10.1016/0890-6955(95)00083-6
- Zhao, Z., Zhijian, S., & Yingkun, X. (1991). Effect of microstructure on the mechanical properties of an Al alloy 6061-SiC particle composite. Materials Science and Engineering A, 132, 83–88. https://doi.org/10.1016/0921-5093(91)90364-S