
 ?Mathematical formulae have been encoded as MathML and are displayed in this HTML version using MathJax in order to improve their display. Uncheck the box to turn MathJax off. This feature requires Javascript. Click on a formula to zoom.
Abstract
Distributed Generation (DG) integration into an existing electrical distribution system plays a great role in combating power system profile problems associated with load growth, overloading, lowquality of supply and non-reliability. Hence, there is a need to improve the technical benefits of DG integration by optimal sitting and sizing in a power system network. These benefits can potentially defer the investments to be made to upgrade the assets of the distribution system, extend equipment maintenance intervals, reduce electrical power losses, and improve the voltage profile and reliability of the distribution system. The aim of this research is therefore to minimize power losses and improve voltage profile of Bahir Dar distribution network using different types of DGs (type-1 DG, type-2 DG and type-3 DG). An improved particle swarm optimization (IPSO)-based methodology is applied to optimally allocate and size the required DG units. It is found that the proposed algorithm is more effective in enhancing the performance of distributions systems when compared with conventional optimization techniques. In particular, the percentage reduction in real power loss is 55.73%, 73.1% and 54.098% while the percentage reactive power loss reduction is 55.102%, 73.46% and 57.14% for type-1, type-2 and type-3 DGs, respectively. Moreover, the minimum voltage is significantly improved and all bus voltages are maintained above the permissible limit. Generally, the proposed optimization algorithm is found to be more efficient and robust for the performance enhancement of a radial distribution system using multiple DG integrations.
1. Introduction
The major components of a power system are generation units, transmission, sub-transmission, distribution system and utilities. Bulkpower is generated at low voltage which has to be steppedup to very high voltage levels before transferring to the customers via long transmission lines. This is done to increase the capacity of the transmission lines and reduce the line losses and voltage drops so that the overall efficiency becomes high (Control & Srinivasan, Citation2021; Purlu & Turkay, Citation2022). On the other hand, an electric power utility prioritizes on satisfying system load and the requirement of its customers by ensuring minimum operation cost on the condition that is acceptable to continuity and quality of electricity supply. However, delivering reliable and secure electric power with low cost and high quality to the consumers is still the most challenging task for electrical utilities due to improper network expansion, minimum monitoring and under/overutilization (Popov et al., Citation2020; Radosavljević et al., Citation2020; Wu et al., Citation2019). In addition to this, the day-to-day increase in the population at an alarming rate makes the utility companies to operate the generation unities and associated electrical devices beyond their limit (El-ela et al., Citation2020; Optimization et al., Citation2021).
Many of the solutions and policies to address these problems have been based on technological advancements (Ahmadi, Citation2019; Mohamed et al., Citation2019; Seet et al., Citation2019). In other words, new generation sources have been introduced and pollution mitigation devices installed, but air quality impacts from electricity production still exist and are unresolved issue yet (Location et al., Citation2022; Pandey & Bhadoriya, Citation2016). Because of this, traditional systems have remained largely unchanged, with the exception of simple technological upgrades (Aman et al., Citation2022; Control & Srinivasan, Citation2021; Selim et al., Citation2021). Hence, several techniques are introduced to address the inefficiency of traditional systems through the reconfiguration of electrical grids. The approach is referred to the integration of distributed generation (DG), which shifts the design and layout of power generation and distribution systems to reduce power losses by increasing efficiency and encouraging the inclusion of renewable energy sources.
DG is a small-scale power generation that is usually interconnected with the electric power system near to the load centers (Mahajan & Vadhera, Citation2016; Mohammadi & Faramarzi, Citation2012; Onlam et al., Citation2019). In other words, it can be defined as “the generation of electricity by facilities that are sufficiently smaller than central generating plants so as to allow interconnection at nearly any point in a power system”. DGs include synchronous generators, induction generators, reciprocating engines, micro-turbines, combustion gas turbines, fuel cells, solar photovoltaic, wind turbines and other small power sources. DGs can provide cost-effective, environmentally friendly, high-power quality and more reliable energy solutions than a conventional generation (Kouzou & Mohammedi, Citation2015; Radosavljević et al., Citation2020; Sajir et al., Citation2017).
Distribution generators can be broadly classified into four types based on the capability of delivering real and reactive power into the grid (Madhuri et al., Citation2022; Oluwole, Citation2016). However, in this research, only the first three types of DG are taken into account due to the fact that solar- and wind-type DG cannot inject reactive power only.
Type 1: DG capable of injecting real power only
Type 2: DG capable of injecting real and reactive power only
Type 3: DG capable of injecting real power but consuming reactive power
Type 4: DG capable of injecting reactive power only
Generally, the penetration of DG into distribution systems is becoming one of the most promising solutions to meet the ever-increasing electrical demand, thereby the greenhouse gas emission effect can be also reduced. For instance, in the United States, demand growth combined with plant retirements is projected to require as much as 1.7 million GWh of additional electrical energy by 2030, which is almost twice the growth of the last 20 years (Pavani & Singh, Citation2014).
The significant power loss and weak voltage profile problems in radial distribution systems are the other factors which motivate researchers to further investigate possible solutions. As stated above, renewable-based DG integration is still the best solution to improve the bus voltage and minimize the system losses. To achieve this objective, several analytical methods are proposed in (Location et al., Citation2022; Pandey & Bhadoriya, Citation2016; Prabha & Jayabarathi, Citation2016) to determine the optimal size and location of the required DG units. In addition to those methods, different artificial intelligence and hybrid methods are also discussed in (Popov et al., Citation2020; Shukla et al., Citation2010; Vasudevan et al., Citation2016; Wu et al., Citation2019). Moreover, the advantages of integrating DGs to distribution networks for minimizing the transmission active and reactive line losses are presented and discussed in (Mahajan & Vadhera, Citation2016; Sookananta & Kuanprab, Citation2010).
Surender R proposed Differential Evolution Algorithm (DEA) to solve power loss minimization problems in a distribution system with network reconfiguration, DG and D-STATCOM (Salkuti, Citation2021a). The simulation is performed considering the IEEE-69 bus system and results obtained show that 82.92% reduction in power losses is achieved. Besides, the voltage profile of the weakest bus is improved from 0.9805 p.u.to 0.9085 p.u. Similarly, the researcher conducted optimal network reconfiguration of a distribution network that consists of DG units and electric-vehicle-charging stations (Kim et al., Citation2020; Salkuti, Citation2021b, Citation2022). Considering the total cost of operation and power losses as a separate objectives function, the optimal network reconfiguration problem is solved with the help of crow search algorithm (CSA). However, the author did not consider the distribution lines maximum current-carrying capacity and the DG limits.
Among the optimization techniques, particle swarm optimization (PSO) algorithm has been widely practiced for optimal sitting and sizing of DG in distribution system. However, the conventional PSO has limitations since it considers constant inertia weight in all the iterations. This slows down the searching speed of the particles and takes more time to reach the optimal solution.
In this research paper, a robust and more efficient optimization method so-called improved particle swarm optimization (IPSO) technique which is based on variable inertia weight values is proposed and validated considering the standard IEEE-33 bus and a real test system.
1.1. Background of the real test system
The electricity demand in Ethiopia is growing fast due to the economic advancement and the increase in the population size (Taye et al., Citation2020). In this regard, the only power supplier company of the country, namely, Ethiopian Electric Power (EEP), is actively working on the expansion of DG besides the usual hydropower plants (Kefale et al., Citation2021).
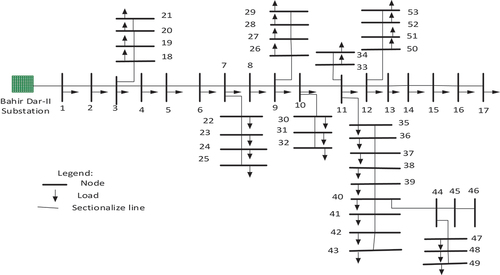
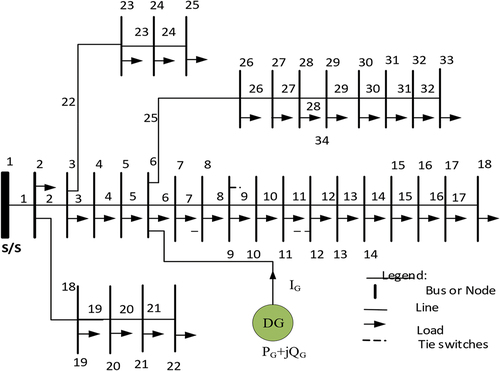
Hence, it is expected that a greater number of DG units will be integrated to the Ethiopian power distribution network. In this regard, studying the effects of DG penetration in compliance with recent power quality requirements is vital as it enable to determine the optimal location and corresponding size. This study is therefore carried out taking one of the most critical substations that exists in Ethiopia as real test system. This substation is found in the southwest of Bahir Dar city, Ethiopia, and called substation-II (400/230KV). The station is contained with three winding power transformers accompanied by other power system components. Each transformer has three similar rated output voltages of 230/66/15 kV, 230/132/15 kV and 230/132/15kV. The connection schemes of these power distribution systems are overhead radial connections. Detailed information about the feeder can be obtained from the single-line diagram shown in Figure . Also, the line and load data of the real system and IEEE-33 bus system are included in the Appendix section (A1-A4, and B1-B2).
Figure 1. Single-line diagram of papyrus feeder.
2. Sensitivity factor analysis
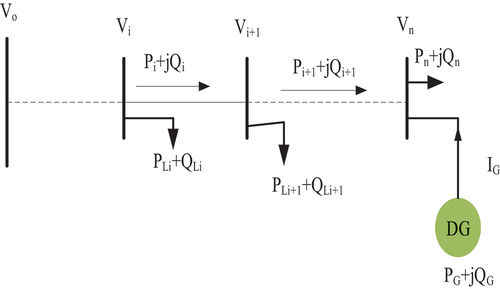
Sensitivity factor analysis of a power system helps to identify the weak buses for a given loading conditions. Commonly, two types of sensitivity factor are used in distribution system voltage profile and loss analysis. These are Loss Sensitivity Factor (LSF) and Voltage Sensitivity Factor (VSF). The modeling and the corresponding analysis is done considering a simple two bus radial distribution system depicted in Figure (Mohammadi & Faramarzi, Citation2012).
Figure 2. A simple two-bus distribution line.
Computation of real power loss in the branch “k” is the product of the current flowing through and the corresponding line resistance (Ik2*Rk), and the sample distribution network line loss can be formulated as:
In the same principle, the reactive power loss in branch “k” between “i” and “i + 1” can be expressed as:
Where:
PLi+1 is total effective active power supplied beyond the node “i + 1”.
QLi+1 is total effective reactive power supplied beyond the node “i + 1”.
Vi is voltage at node “i”.
Rk is the resistance of the branch “k”.
Xk is reactance of the branch “k”.
The loss sensitivity factor (LSF) is then calculated using the differential of the PLoss (k) with respect to the real power load as shown below (Radosavljević et al., Citation2020).
Finally, the loss sensitivity factors () are calculated from the base case load flow and the values are arranged in descending order in each node.
On the other hand, the voltage sensitivity factor (VSF) is the ratio of the base case voltage magnitudes at buses, i and the minimum limit of the IEEE voltage level, 0.950 p.u. (Prabha & Jayabarathi, Citation2016).
Where:
V (i) is the bus voltage of the system.
VSF(i) is deciding whether the buses need real and reactive compensation or not.
In this research, both loss sensitivity factor and voltage sensitivity factors are used in conjunction with the PSO algorithm. These methods are used simultaneously to reach the best solution faster by minimize the searching time of the particles.
3. Proposed methodology and problem formulation
The active and reactive power losses when a DG is installed at an arbitrary location in the network are given by Equationequations 11(11)
(11) and Equation12
(12)
(12) , whereas Equationequations 5
(5)
(5) –Equation10
(10)
(10) show the active and reactive power losses before the installation of DG (Raoofat & Malekpour,).
The power loss in the line section connecting buses i and i + 1 is computed as:
Then, the total power losses of the feeder, and
, can be determined by summing up the losses of all line sections of the feeder, which is given as:
When the DG is integrated to the distribution system as shown in Figure , the power loss equations derived above can be modified as:
Figure 3. Distribution system with DG.
As a result, the objective function is formulated as a minimization of the associated losses and the voltage deviation as shown in Equationequations 13(13)
(13) and Equation14
(14)
(14) . In this regard, the optimal location and the corresponding size of the required DG unit, which result in minimum power losses and minimum voltage deviation from the nominal value without violating the system constraints, will be systematically determined.
Minimize
3.1. Improved particle swarm optimization algorithm
Optimization algorithms are suitable to find the best feasible solutions to an optimization problem, minimizing or maximizing of a continuous and discrete function with respect to several subjects of equality and inequality constraints (Conference, Citation2018; Esmaeilian & Fadaeinedjad, Citation2015; CitationNasir et al., YYY). In this case, the problems include the optimal location and size of DG subjected to several constraints. In the conventional PSO algorithm, the inertia weights are fixed throughout the entire iteration. This slows down the searching speed of the particles, and hence takes more time to reach the optimal solution (Radosavljević et al., Citation2020).
Therefore, updating the inertia weights in all iterations is necessary to minimize the searching time and simplify the manipulation. This algorithm is called IPSO and is applied in this research work. In this condition, the inertia weight factor “w” is varied at each step by multiplying its updated value with the velocity of the particles obtained in the previous iteration, i.e. The particles velocity is sum of the inertia factor, the personal influence, and the social influence in the swarm and can be altered using the following equation.
Hence, evaluation of PSO is modified from iteration to iteration. In other words, unlike the conventional PSO, the linear recursive function is modified and the i-th particle position is also updated using following equation.
For i = 1, 2 … n, and d = 1, 2 … m
However, velocity values are restricted to some minimum and maximum value [Velmin, Velmax] using the following equation.
Generally, the procedures for IPSO algorithm are presented in the flow chart depicted in Figure .
Figure 4. The flow chart of PSO.
4. Simulation results and discussions
In this research work, more emphasis is given to real power loss reduction since active power loss has a considerable impact on the total cost of operation. Thus, taking this into consideration, a study of the effect of the weights on the fitness values was done so as to determine the best weights combination while satisfying the multi-objective function formulated previously. Accordingly, the weight factor for the active power loss is kept between 0.5 and 0.8, whereas the remaining percentage is given for reactive power loss and voltage deviation. The evaluation of these various weight factor combinations on the fitness value is presented in Table .
As shown in Table , the best fitness is obtained when the weighting factors for active power loss, reactive power loss and voltage deviation are 0.7, 0.2 and 0.1, respectively. Hence, the objective function can be written as follows.
Table 1. Effects of weights on fitness function
4.1. Case 1: results using IEEE-33 test system
The proposed algorithm is first tested and validated considering the standard IEEE 33-bus radial distribution system. The system has 32 sectionalizing branches, 33-bus, nominal voltage of 12.66 kV, and a total system load of 3.72 MW and 2.3 MVAr. Pandey & Bhadoriya (Citation2016) reported that the base case system real power loss of this system is 206.9 kW. This value was obtained using backward-forward sweep power flow method. When load flow is executed, we obtained similar real power loss and reactive power loss of 140 kVAr. Thus, for comparison purposes, the real and reactive power losses of the 33-bus test system before DG installation were taken to be 206.9 kW and 140 kVAr, respectively. Similarly, sensitivity factor analysis is done, and the candidate buses are determined to be 6, 8, 28, 29, 9, 13, 10 and 3.
Results for Real and Reactive Power Losses
For validation purpose of the proposed methodology, it is important to compare the results obtained using IPSO method and conventional PSO. As shown in Table , both the active and reactive power loss reductions are high when the conventional PSO algorithm is applied. In other words, the active and reactive percentage power losses are 69.62% and 65.04%, respectively. Also, the size of the required DG is minimized when the proposed optimization technique is considered.
Bus Voltages Comparisons
Table 2. Comparison of real and reactive power losses
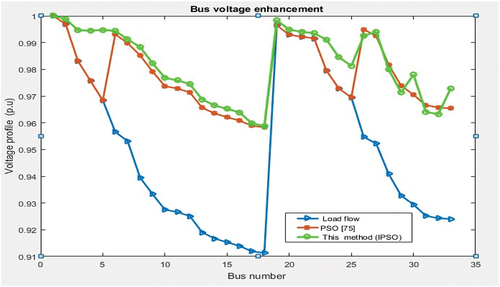
Table shows a comparison between the bus voltages when conventional PSO and IPSO are used to find the optimal size and location of type-2 DG. As can be noted from the table, all the bus voltages are above the minimum threshold value when IPSO is considered. Furthermore, the minimum voltage is improved by 5.220%.
Table 3. Bus voltage comparison
The voltage profile comparison is also plotted using MATLAB software as shown in Figure . It is clear that the proposed method is more effective in improving the voltage profile of radial distribution system by integrating DG. This is due to that fact the inserted DG will inject extra current and this in turn decreases the current from the main supplying feeder, and thereby the voltage drop proportionally gets decreased which in turn helps to upgrade the voltage profile.
Figure 5. Bus voltage profile enhancement of IEEE-33 network.
4.2. Case 2: simulation results of the case study system
The case study network has 52 sectionalizing branches, nominal voltage of 15 kV and a total system load of 9.0 MW and 5.78 MVAr at normal loading condition. Also, the system has an active power loss of 0.610 MW and reactive power loss of 0.49 MVAr at base case. These values are determined using the backward-forward power flow algorithm described in the previous sections.
4.3. Scenario I: Considering type1 DG
In this case, the integrated DG will inject only active power to the grid. Hence, four candidate buses for optimal allocation of these DG units are selected depending on their sensitivity factor values. In other words, it is done by selecting those locations which have minimum fitness values. Also, the optimal size of these DG units is determined using the proposed IPSO algorithm. The four selected optimal locations and their respective optimal DG sizes are listed below:
First candidate: Bus number 11 with a DG size of 4.0 MW
Second candidate: Bus number 7 with a DG size of 3.91 MW
Third candidate: Bus number 8 with a DG size of 3.081 MW
Fourth candidate: Bus number 10 with a DG size of 3.98 MW
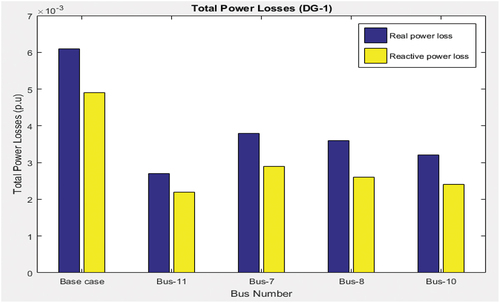
The total active and reactive power losses for each candidate buses are determined and depicted in Figure . It can be understood that the total active and reactive power losses become minimum when a DG size of 4.0 MW is integrated at bus 11. With the implementation of type-1 DG, real power loss is reduced from 0.610 MW to 0.27 MW and reactive power loss is also reduced from 0.49MVAr to 0.22MVAr.
Figure 6. Real and reactive power loss reduction using type-1 DG.
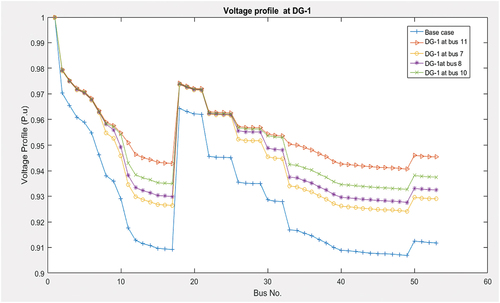
The base case system minimum voltage profile was about 0.9069p.u. before the DG units were inserted. This shows that the voltage profile of some buses is out of the permissible voltage margin limit. But with the inclusion of type-1 DG at the optimal location, it is improved from 0.9069p.u. to 0.9500p.u. as shown in Figure . Not only the voltage profile of bus 11 is enhanced but also all the selected weak buses voltage profile has been significantly improved.
Figure 7. Voltage profile enhancement using type-1 DG.
4.4. Scenario II: Considering type2 DG
Unlike the first scenario, the integrated DG in this case will inject both active and reactive power to the grid. Similarly, four candidate buses for optimal allocation of these DG units are selected depending on their sensitivity factor values. In other words, it is done by selecting those locations which have minimum fitness values. Also, the optimal size of these DG units is determined using the proposed IPSO algorithm. The four selected optimal locations and their respective optimal DG sizes are therefore listed below:
Bus number 11 with a DG size of 4.0 MW and 2 MVAr
Bus number 7 with a DG size of 3.91 MW and 1.81 MVAr
Bus number 8 with a DG size of 3.081 MW and 1.961 MVAr
Bus number 10 with a DG size of 3.98 MW and 1.3702 MVAr
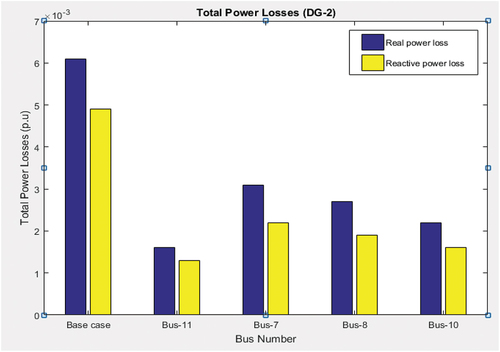
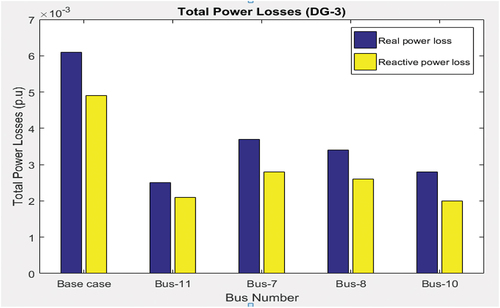
The total active and reactive power losses for each candidate buses are then determined and depicted in Figure . It can be understood that the total active and reactive power losses become minimum when a DG size of 4.0 MW and 2 MVAr is integrated at bus 11. Specifically, real and reactive power loss has been reduced to 0.0016p.u. and 0.0013p.u., respectively, due to the integration of type-2 DG at bus 11.
Figure 8. Real and reactive power loss reduction using type-2 DG.
The base case system minimum voltage profile was about 0.9069p.u. before the DG units were inserted. This shows that the voltage profile of some buses is out of the permissible voltage margin limit. But with the inclusion of type-2 DG at the optimal location, it is improved from 0.9069p.u. to 0.9650 p.u. as shown in Figure . Not only the voltage profile of bus 11 is enhanced but also all the selected weak buses voltage profile has been significantly improved.
Figure 9. Voltage profile enhancement using type-2 DG.
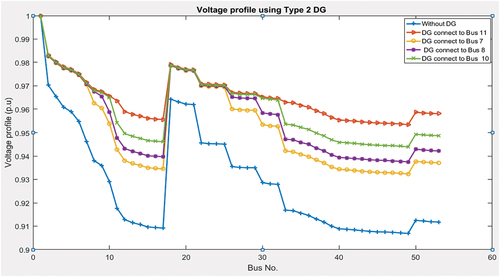
In this case, the percentages of energy losses reduction and voltage profile improvement are better when compared to the first scenario. This is due to the fact that this type of DG can inject reactive power demand and this helps to upgrade the voltage profile of far end nodes. Additionally, it plays a great role in decreasing the line current from the main supplying substation thereby the associated line losses can be made minimum possible.
4.5. Scenario III: considering type-3 DG
Unlike the second scenario, the integrated DG unit in this case will inject active power and consume reactive power from the external grid. Similarly, four candidate buses for optimal allocation of these DG units are selected depending on their sensitivity factor values. In other words, it is done by selecting those locations which have minimum fitness values. Also, the optimal size of these DG units is determined using the proposed IPSO algorithm. The four selected optimal locations and their respective optimal DG sizes are therefore listed below:
Bus number 11 with a DG injecting of 4.260 MW and absorbing 2.4560 MVAr
Bus number 7 with a DG injecting of 3.891 MW and absorbing 2.107 MVAr
Bus number 8 with a DG injecting of 4.55 MW and absorbing 1.816 MVAr
Bus number 10 with a DG injecting of 3.98 MW and absorbing 1.760 MVAr
The total active and reactive power losses for each candidate buses are then determined and depicted in Figure . It can be understood that the total active and reactive power losses become minimum when a DG size of 4.0 MW and 2 MVAr is integrated at bus 11. Specifically, real and reactive power loss has been reduced to 0.0028p.u. and 0.0021p.u., respectively, due to the integration of type-3 DG at bus 11.
Figure 10. Power loss at optimal bus location with base case.
The base case system minimum voltage profile was about 0.9069p.u. before the DG units were inserted. This shows that the voltage profile of some buses is out of the permissible voltage margin limit. But with the inclusion of type-3 DG at the optimal location, it is improved from 0.9069p.u. to 0.941p.u. as shown in Figure . Not only the voltage profile of bus 11 is enhanced but also all the selected weak buses voltage profile has been improved.
Figure 11. Voltage profile of selected optimal buses using type-3 DG.
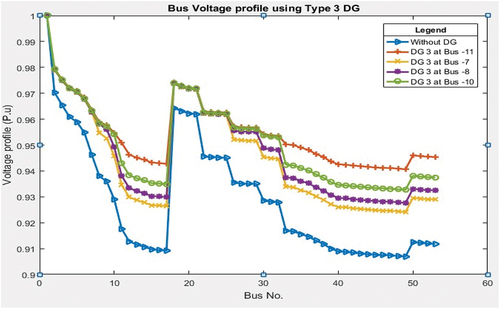
In this case, the percentage energy losses reduction and voltage profile improvement are lower when compared to the second scenario. This is due to the fact that this type of DG absorbs some reactive power demand from the grid which in turn makes the voltage profile of far end nodes minimum. However, the voltage profile of majority of buses is improved and the energy losses are decreased when compared with the base case simulation results.
5. Simulation results summary
The simulation results of all scenarios are summarized and presented in Table and Figure . It can be noted that type-2 DG results in minimum power losses and better voltage profile as compared to the results obtained from type-1 and type-3 DG integration.
Figure 12. Power loss reduction comparison.
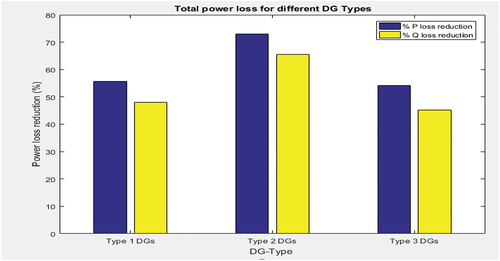
Table 4. Result summary of all scenarios
5.1. Conclusion
In this research paper, the formulation and implementation of an upgrading IPSO algorithm to help in reducing system power losses and improving voltage profile by optimizing the location and size of multi-type DGs has been presented. The combined sensitivity factors are formulated and used effectively in reducing the search space and time for executing the algorithm. The case feeder has been compared with the IEEE-33 bus test system, and it has been observed that the proposed system is more efficient than the conventional system in power loss reduction and voltage profile improvement. For the case feeder, four candidate buses are chosen as possible DG locations. Also, IPSO method and three different types of DG are used for best power loss reduction and voltage profile improvement. The percentage reduction in real power loss is 55.73%, 73.1% and 54.098% while the percentage of reactive power loss reduction is 55.102%, 73.46% and 57.14% for type-1, type-2 and type-3 DGs, respectively. The voltage profile is generally improved with lowest bus voltages of 0.940p.u. in all the cases. From the three cases, it is found that type-2 DG is the most effective DG type for power loss reduction and voltage profile improvement as can be seen from the results.
Thus, the objectives of the research work are achieved successfully and the effectiveness of IPSO method for optimal allocation of multiple DG units in distribution systems for reducing both real and reactive power losses and improving feeder voltage profiles is proved.
Disclosure statement
No potential conflict of interest was reported by the author(s).
Additional information
Funding
Notes on contributors
Habtemariam Aberie Kefale
Habtemariam Aberie Kefale was born on 20 January 1991 in Amhara, Ethiopia. He completed his BSc degree in Electrical and Computer Engineering with Electrical Power and Control Engineering Focus in 2016, and MSc degree in Power Systems Engineering in 2019 at Bahir Dar University-Institute of Technology. He is currently working as a senior lecturer at Bahir Dar Institute of Technology, Ethiopia. He has more than 10 publications in international conferences and reputable journals. His research interests include Power System Operation and Control, Artificial Intelligence to Power Systems, Smart-Grid, Renewable Energy Design and Modelling.
References
- Ahmadi, B., “Optimal allocation of multi-type distributed generators for minimization of power losses in distribution systems,” IEEE Access, pp. 4–23, 2019.
- Alkaran, D. S., & Gharehpetian, G. B. (2015). Multiple distributed generation units allocation in distribution network for loss reduction based on a combination of analytical and genetic algorithm methods. IET Generation, Transmission & Distribution, 10(1 https://doi.org/10.1049/iet-gtd.2015.0041), 66–72.
- Aman, M. A., Ren, X. C., Tareen, W. U. K., Khan, M. A., Anjum, M. R., Hashmi, A. M., Ali, H., Bari, I., Khan, J., & Ahmad, S. (2022). Optimal siting of distributed generation unit in power distribution system considering voltage profile and power losses. Mathematical Problems in Engineering, 2022, 1–14. https://doi.org/10.1155/2022/5638407
- Conference, I. (2018). A review on optimal network reconfiguration in the radial distribution system using optimization techniques. Proceedings of the Sustainable Research and Innovation Conference, JKUAT Main Campus, Kenya 2 - 4 May, 2018
- Control, J., & Srinivasan, G. (2021). Optimization of distributed generation units in reactive power compensated reconfigured distribution network. Cogent Eng, (May https://doi.org/10.1080/00051144.2021.1929741).
- El-ela, A. A. A., El-sehiemy, R. A., Member, S., Shaheen, A. M., & Ellien, A. R., “Optimal allocation of distributed generation units correlated with fault current limiter sites in distribution systems,” IEEE Syst. J., pp. 1–8, 2020.
- Esmaeilian, H. R., & Fadaeinedjad, R. (2015). Energy loss minimization in distribution systems utilizing an enhanced reconfiguration method integrating distributed generation. IEEE Systems Journal, 9(4), 1430–1439. https://doi.org/10.1109/JSYST.2014.2341579
- Kefale, H. A., Getie, E. M., & Eshetie, K. G. (2021). Optimal design of grid-connected solar photovoltaic system using selective particle swarm optimization .International Journal of Photoenergy 2021. https://doi.org/10.1155/2021/6632859
- Kim, S., Ray, P., & Salkuti, S. R. (2020). Islanding detection in a distribution network with distributed generators using signal processing techniques. Islanding Detect. a Distrib. Netw. with Distrib. Gener. Using Signal Process. Tech, 11(4), 2099–2106.
- Kouzou, A., & Mohammedi, R. D., “Optimal reconfiguration of a radial power distribution network based on Meta-heuristic optimization algorithms,” 2015 4th Int. Conf. Electr. Power Energy Convers. Syst. EPECS 2015, 2015.
- Location, O., Reactive, C., & Compensation, P. (2022). Optimal location and sizing of renewable distributed considering reactive power compensationVolume 15, p.2126. https://doi.org/10.3390/en15062126
- Madhuri, N. S., Reddy, K. M., & Babu, G. V. S. (2022). The optimal sizing and placement of renewable distributed generation in distribution system. International Journal of Recent Technology and Engineering, 3(10).
- Mahajan, S., & Vadhera, S., “Optimal sizing and deploying of distributed generation unit using a modified multiobjective particle swarm optimization,” 2016 IEEE 6th Int. Conf. Power Syst. ICPS 2016, no. 4, 2016.
- Mohamed, O., Mohamed, M., & Kansab, A. (2019). Optimal placement and sizing of distributed generation sources in distribution networks using SPEA algorithm. International Journal on Electrical Engineering and Informatics, 11(2), 326–340. https://doi.org/10.15676/ijeei.2019.11.2.7
- Mohammadi, M. T. A. Y., & Faramarzi, M., “PSO algorithm for sitting and sizing of distributed generation to improve voltage profile and decreasing power losses,” Proc. 17th conf. electr. power distrib. networks, pp. 1–5, 2012.
- Nasir, M. N. M., Shahrin, N. M., Bohari, Z. H., Sulaima, M. F., & Hassan, M. Y., (YYY). “A distribution network reconfiguration based on PSO considering DGs sizing and alloca.pdf.” IEEE Student Conference on Research and Development (SCOReD), 2014, Batu Ferringhi, DOI:10.1109/SCORED.2014.7072981
- Oluwole, O. O. (2016, March). “Optimal allocation of distributed generation for power loss reduction and voltage profile improvement,” no.
- Onlam, A., Yodphet, D., Chatthaworn, R., Surawanitkun, C., Siritaratiwat, A., & Khunkitti, P. (2019). Power loss minimization and voltage stability improvement in electrical distribution system via network reconfiguration and distributed generation placement using novel adaptive shuffled frogs leaping algorithm. Energies, 12(3), 1–12 https://doi.org/10.3390/en12030553.
- Optimization, M., Ali, A., Keerio, M. U., & Laghari, J. A. (2021). Optimal site and size of distributed generation allocation in radial distribution network using. IEEE Trans. Power Syst, 9(2), 404–415 https://doi.org/10.35833/MPCE.2019.000055.
- Pandey, D., & Bhadoriya, J. S, “Optimal placement & sizing of distributed generation (DG) to minimize active power loss using particle swarm optimization (PSO), no.” January, 2016. International Journal of Scientific & Technology Research, 3(7), 246-254.
- Pavani, P., & Singh, S. N. (2014). Placement of DG for reliability improvement and loss minimization with reconfiguration of radial distribution systems. International Journal of Energy Sector Management, 8(3), 312–329. https://doi.org/10.1108/IJESM-03-2013-0007
- Popov, V., Sikorsky, N. I., & Sikorsky, N. I. (2020). Optimal placement and sizing sources of distributed generation considering information uncertainty. 2020 IEEE 7th International Conference on Energy Smart Systems (ESS), 253–257 10.1109/ESS50319.2020.9160135.
- Prabha, D. R., & Jayabarathi, T. (2016). Optimal placement and sizing of multiple distributed generating units in distribution networks by invasive weed optimization algorithm. Ain Shams Engineering Journal, 7(2), 683–694. https://doi.org/10.1016/j.asej.2015.05.014
- Purlu, M., & Turkay, B. E. (2022). Optimal allocation of renewable distributed generations using heuristic methods to minimize annual energy losses and voltage deviation index. IEEE Access, 10, 21455–21474. https://doi.org/10.1109/ACCESS.2022.3153042
- Radosavljević, J., Arsić, N., Milovanović, M., & Ktena, A. (2020). Distributed generation using hybrid metaheuristic algorithm. Journal of Modern Power Systems and Clean Energy, 8(3), 499–510 https://doi.org/10.35833/MPCE.2019.000259.
- Raoofat, M., & Malekpour, A. R, “Optimal Allocation of Distributed Generations and Remote Controllable Switches to Improve the Network Performance Considering Operation Strategy of Distributed Generations’’. Electric Power Components and Systems, 39(16). .
- Sajir, H., Rahebi, J., Abed, A., & Farzamnia, A., “Reduce power losses and improve voltage level by using distributed generation in radial distributed grid,” Proc. - 2017 IEEE 2nd Int. Conf. Autom. Control Intell. Syst. I2CACIS 2017, vol., vol. Decem, no. October, pp. 128–133
- Salkuti, S. R. (2021a). Minimization of losses in a distribution system with network reconfiguration, distributed generation and D-STATCOM. International Journal of Advanced Technology and Engineering Exploration, 8(85). https://doi.org/10.19101/IJATEE.2021.874693
- Salkuti, S. R. (2021b). Optimal network reconfiguration with distributed generation and electric vehicle charging stations. International Journal of Mathematical, Engineering and Management Sciences, 6(4), 1174–1185. https://doi.org/10.33889/ijmems.2021.6.4.070
- Salkuti, S. R. (2022). Impact of demand response on optimal sizing of distributed generation and customer tariff. Energies, 1–31 https://doi.org/10.3390/en15010190.
- Seet, C. C., Pasupuleti, J., & Khan, M. R. B. (2019). Optimal placement and sizing of distributed generation in distribution system using analytical method. International Journal of Recent Technology and Engineering, (4), 6357–6363 https://doi.org/10.35940/ijrte.D5120.118419.
- Selim, A., Kamel, S., Mohamed, A. A., & Elattar, E. E. (2021). Optimal allocation of multiple types of distributed generations in radial distribution systems using a hybrid technique. Sustainability, 13(12), 6644. https://doi.org/10.3390/su13126644
- Shahzad, M., Akram, W., Arif, M., Khan, U., & Ullah, B. (2021). Optimal siting and sizing of distributed generators by strawberry plant propagation algorithm. Energies, 1–13 https://doi.org/10.3390/en14061744.
- Shukla, T. N., Singh, S. P., & Naik, K. B. (2010). Allocation of optimal distributed generation using GA for minimum system losses in radial distribution networks. International Journal of Engineering Science and Technology, 2(3), 94–106 https://doi.org/10.4314/ijest.v2i3.5917.
- Sookananta, B., & Kuanprab, W., “Determination of the optimal location and sizing of distributed generation using particle swarm optimization,” ETIC Int. Conf., pp. 4–8, 2010.
- Taye, B. Z., Workineh, T. G., Nebey, A. H., & Kefale, H. A. (2020). Rural electrification planning using geographic information system (GIS) rural electrification planning using geographic information system (GIS). Cogent Engineering, 7(1), 1836730. https://doi.org/10.1080/23311916.2020.1836730
- Vasudevan, K., Balaraman, K., & Atla, C. S. R, “Optimal switch placement for automatic reconfiguration of distribution system in presence of DGs, 2016 - Bienn.” Int. conf. power energy syst. towar. sustain. energy, PESTSE 2016
- Wu, K., Wang, H., & Zou, B., “Optimal sizing and placement of distributed generation using genetic algorithm based on bayesian network,” 2019 IEEE 3rd Int. Conf. Green Energy Appl., pp. 75–79, 2019.
APPENDICES
APPENDIX A: Single-line diagram of distribution network
APPENDIX A1. Single-line diagram of papyrus feeder.

APPENDIX A2. Single-line diagram of 33-bus test system.
APPENDIX A-3. Single-line diagram of papyrus feeder with DG.

APPENDIX A4. Single-line diagram of 33-bus test system with DG.
Appendix B: IEEE 33-Bus Radial Distribution Test System Data
Table B1. Bus and line data for IEEE 33-bus test system
Table B2. Bus and line data for papyrus feeder