
 ?Mathematical formulae have been encoded as MathML and are displayed in this HTML version using MathJax in order to improve their display. Uncheck the box to turn MathJax off. This feature requires Javascript. Click on a formula to zoom.
Abstract
The focus of this study was to assess the solar radiation in locations with limited meteorological data. In 2019, monthly average temperature values that were collected from the South African University Radiometric Network (SAURAN), USAid Venda station in Vuwani, Limpopo, were inputted in the temperature-based empirical model, Hargreaves–Samani () model to calculate global solar radiation. The modelled monthly average solar radiation values were compared to the ground-based and two satellites data sources. The performance of the model showed strong correlation between all the measurements (observed) solar radiation with R2 of 0.83, 0.94, and 0.92 for ground-based, NASA, and CAMS satellites derived data, respectively. It can be inferred that the modelled global radiation has a better error range as compared to both ground-based and satellite-derived observations. The strong correlation validated that the estimated radiation through the
model as a reliable input for photovoltaic(PV) power output models for a 255 W panel installed at the study site. Therefore, careful site assessment of weather conditions is necessary for a better assessment of potential P V power output and recommendation of the suitable solar panel. The study has proven that the PV power output can be estimated in areas with limited weather data with known solar panel. The outcomes of this study can be useful for proper design of power generation system of any size in any location.
1. Introduction
A large part of the world’s population is located in remote areas with no access to infrastructure, including water and electricity grid. Coupled with high electricity and water tariffs, most of these rural communities have found the use of alternative and cheaper energy sources as the best solution. Over the past five decades, the use of photovoltaic (PV) technology for power generation has increased as it continued to be cheaper and affordable. The power output from a PV array is known to depend on environmental variables, such as irradiance, temperature, rainfall, wind speed and relative humidity at a specific site (Maluta & Mulaudzi, Citation2018). In developing countries like South Africa, it is difficult to set up weather stations scattered all over the country. This is due to high cost of the establishment of weather stations and their maintenance. Thus, the lack of accurate information can affect the prediction of potential power generation for a specific location of the intended system significantly.
Over the years, the methods proposed in the literature to forecast solar power are either based on time-series power data, global weather forecast data, or local weather measurement data (Ishiharay & Poolla, Citation2018). To address this challenge, a number of the empirical models based on temperature data, such as Clemence, and Hargreaves and Samani () models have been used (Maluta & Mulaudzi, Citation2018). The adoption of these models ensures that in areas where irradiation is not measured, but temperature, the solar power output can easily be predicted (Maluta & Mulaudzi, Citation2018). A system which needs limited weather information blend of local weather history along with global weather estimation is critical for the improvement of local weather forecast accuracy.
In the farming sector, solar powered water-pumping system has become the most widely used tool across the world. South Africa’s small-scale and emerging farmers struggle to sustain their farms due to high electric costs and power-outages. Therefore, PV power, which is environmental friendly, has attracted more interests. The country’s climatic conditions play a significant role in the design of the system, which is able to meet both water and energy demands farm. It is imperative to develop models that incorporate local and global characteristics to improve prediction accuracy. This paper provides a two-level approach to predict local power output based on historical local weather data. In the first step, local temperature data are used as an input to the empirical model to estimate the global solar radiation for the project site. Secondly, the estimated global solar irradiance was used in the mathematical model to describe the thermo-electrical behaviour of PV systems.
The aim of this study is to compare the performance of temperature-based global solar radiation model with the ground-measured data and satellite-derived data to determine their relative levels of accuracy and reliability for solar energy system design and sizing. This will be achieved by assessing the use of three data sources to determine global solar radiation. The sources are numerical modelling, ground measurements, and two satellite-based. The study took place at the USAid Venda station located at Vuwani Village in Limpopo, South Africa. The USAid Venda is one of the thirteen stations of the South African University Radiometric Network (SAURAN). The satellites data used were from NASA Prediction of Worldwide Energy Resources (NASA) and then verified by another satellite-based data from the Copernicus Atmosphere Monitoring (CAMS). The observed global horizontal irradiance (GHI) values from the ground station and the two satellites were used to assess the performance of the model. The final stage of this research was to assess the performance of PV module that has been installed on site using the solar radiation ( determined from the study and atmospheric temperature
.
2. Material and methods
2.1. Study area and data collection
Vuwani is located in Limpopo Province, South Africa at latitude: −23.13100052, longitude: 30.42399979 (De Soto et al., Citation2006). The average annual temperature, precipitation and wind speed are 15.45°C, 0.049 mm, and 7.32 km.h−1, respectively. The average annual solar irradiance in Vuwani is 199.20 W.m−2 with an evapotranspiration of 0.0033 mm in summer. The monthly average daily ambient temperature values in were measured from the station and used as inputs to the empirical model. The station is able to measure ambient temperature, global solar radiation, relative humidity, wind speed, and barometric pressure. The pyrometer was used to measure the global solar radiation on the ground-based, which was used to verify the estimation of H-S model.
Figure 1. Monthly average temperature recorded at Vuwani in 2019.
The monthly mean values of the twelve months (2019) daily average global solar radiation data obtained from NASA and CAMS satellites were collected and referred to as satellite-derived data. The optimum inclination of the PV panel, which was installed on-site and used to estimate the potential power output based on the global solar radiation, was fixed at 45°, which was determined by adding 15° to the longitude of 30°.
For the potential power output, the estimated solar radiation was subjected to three PV output models based on the dataset from the manufacture of the module. The dataset for a 255 W panel was used to estimate the PV power output based on the local conditions at Vuwani (De Soto et al., Citation2006) as shown in . Due to unavailability of power output instrument on site, the calculated values of power were not validated in the current study but could be interesting in the future studies.
Table 1. Electric dataset of polycrystalline PV panel
Parameters in , and
are temperature coefficients for open-circuit voltage and short-circuit current, respectively. Furthermore,
and
are the open-circuit voltage and the short-circuit current of the PV, respectively.
2.2. Temperature-based estimation of global solar radiation
It would be desirable to access available data of any solar-related parameter to perform the calculations and the system sizing of facilities at any given location. With limited parameters like temperature, relative humidity, and sunshine hour that are readily available anywhere, it is now possible to estimate solar radiation at that particular location using empirical models. The flow plan of the study is in .
Figure 2. The flowchart presenting the inter-disciplinary model of the assessment.
A temperature-based model proposed by Hargreaves and Samani () was used in this study to calculate solar radiation, and its performance was validated by comparing its values with that of measured radiation collected on site. The
model to calculate solar radiation (
) requires only maximum and minimum temperature data as represented by USAid, University of Venda, (Citation2020):
where Tmax and Tmin in () are the maximum and minimum daily temperature, respectively; α is an empirical coefficient depending on the region (coastal: 0.19 or inland: 0.16).
The average daily extra-terrestrial irradiance G0 is estimated using (Zhang, Citation2018):
where Gsc is the solar constant (1367 W.m−2), φ is latitude (), δ is the solar declination for the month (
), and ωs is the mean sunrise hour angle for the given month (
). DF is eccentricity correction factor of the earth’s orbit on day n of the year (Julian days from 1 January to 31 December), which can be calculated using the expression (Marwal, Citation2012):
The values of δ and ωs can be calculated using Equationequations (4)(4)
(4) and (Equation5
(5)
(5) ), respectively (Amekudzi et al., Citation2014),
2.3. PV power generation
The performance of solar module in question provided by manufacturers is mainly based on ideal conditions or controlled environment. However, the ideal conditions are difficult to attain for real-life application (Almorox & Hontoria, Citation2004). The evaluation of the performance of three power generation models in Equationequations (7)(7)
(7) , (Equation8
(8)
(8) ) and (Equation11
(11)
(11) ), based on a sampled monthly average daily solar irradiation (
) and the cell temperature (
), is given by (Maluta & Mulaudzi, Citation2018):
where is an acronym for the nominal operating cell temperature which depends upon the type of module used.
is defined as the cell temperature when the PV panel operates under 800 W.m−2 PV of solar irradiation and 20°C of ambient temperature.
is usually between 42°C and 46°C (Almorox & Hontoria, Citation2004). The performances of three PV generation models were assessed through a 255 W panel installed on site.
Model 1: The model by Skoplaki et al., in Equationequation (7)(7)
(7) , provides the correlation of power output,
with the cell temperature (Tc) and (Gc) (Ayzvazogluyuksel & Filik, Citation2017),
where τpv, , and βref are the transmittance of the PV cell’s outside layer, the module’s electrical efficiency at STC, and temperature coefficient, respectively.
Model 2: Ramli et al. proposed an analytical model that defines the current–voltage relationships based on the electrical characteristics of the solar panel (Skoplaki & Palyvos, Citation2009). The model includes the effects of radiation level and panel temperature on the output power (Skoplaki & Palyvos, Citation2009):
where
PPV is the PV panel power (W) at the maximum power point during the day, d. Vmpp is panel voltage at the maximum power point and the corresponding voltage at reference operating conditions. Impp, ISC, ISC,ref are panel current at the maximum power point, current at reference operating conditions and short circuit current (A) at reference operating conditions, respectively.
Model 3: Villalva et al. (Ramli et al., Citation2016) determined the maximum power output through the nonlinear , by adjusting the curves of Equationequations (11)
(11)
(11) , (Equation12
(12)
(12) ) and (Equation13
(13)
(13) ) at the open circuit, maximum power and short circuit:
where is an ideality factor defined as (
). Two other conditions are necessary to solve the system of equations with the following assumptions (Awara et al., Citation2020):
where is a photo-generated current. The expression of the reverse saturation current of the diode,
is (Awara et al., Citation2020):
This model was deployed on the MATLAB/Simulink environment to determine the maximum power output through the and
characteristic curves.
2.4. Statistical evaluation
The estimated solar radiation values using model were compared with the observed values. The coefficient to determine
, root mean square error (RMSE), mean bias error (MBE), and [mean absolute error (MAE) in EquationEquations (14)
(14)
(14) —(Equation17
(17)
(17) ) was used to analyse the accuracy of the estimated values produced. The comparison of the satellite-based data and ground-measured data with the estimated global radiation values was done using percentage error.
In the above relations, the subscript refers to the
value of the solar irradiation and
is the number of the solar irradiation data. The subscripts “
” and “
” refer to the calculated and observed global solar irradiation values, respectively.
3. Results and discussions
3.1. Performance of empirical method
The global solar radiation for Vuwani was estimated using the model represented in Equationequation (1)
(1)
(1) , and ground-based station and two satellite data for a period of twelve months in 2019 are presented in . The monthly average minimum and maximum temperatures and an empirical coefficient of 0.16 for inland location were used as input parameters for the model.
Table 2. Monthly average daily solar radiation
A comparison of the monthly average values of the estimated global solar radiation from the H-S model with ground measured data for Vuwani and the two satellite observed data is shown in . Estimated(H-S), ground-based(Vuwani), satellite-based(NASA), and satellite-based(CAMS) represent estimated global solar radiation from Hargreaves and Samani model, and measured data from USAid Venda (Vuwani), NASA Satellite and Copernicus Atmosphere Monitoring, respectively.
Figure 3. Estimated inter-monthly global solar radiation for Vuwani.
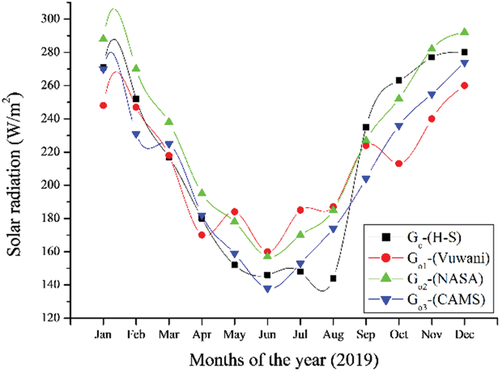
shows that Go1 and Go3 give a better agreement with the estimated data Gc than Go2. The result further shows an overestimation from Go2 between March and September. The reasons for this deviation need to be investigated. Furthermore, Go1 data in October deviated from Gc by 24%. The overestimation from the model shows a general correlation with the number of cloudy days. Solar irradiance can be difficult to model, due to cloud cover and other meteorological effects. This deviation demonstrates the limitations of the model under cloudy, rainy days, and wind speed as the temperature hovered around 30°C, 50.94 mm of rain and approximately 13 rainy days in the month with humidity of 57%. Therefore, other empirical models based on sunshine hour, relative humidity and atmospheric pressure need to be explored in the future studies.
The values of the error indices of the observed data of Go1, Go2, and Go3 data when compared to Gc are summarised in . It can be observed that Go3 gives the better error estimates in terms of RMSE, MAE, and highest value of R2. This implies that Go3 has overall better performance as compared to other data sources that were used in the current study. Therefore, data from the CAMS can be recommended to verify the performance of other global solar radiation models and measuring instruments. The statistical analysis agreed with the corresponding findings by other researchers [18] that .
Table 3. Statistical error indicators of the observed with the estimated global solar radiation
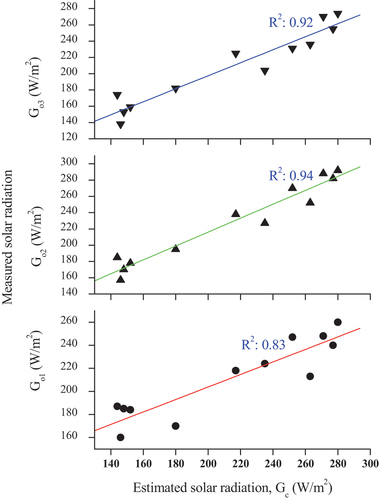
It can be inferred that the modelled global radiation has a better error range as compared to ground-based observations. Hence, the estimated global solar radiation values compared favourably with the ground measurements compared to the satellite-derived data. shows a very strong correlation between estimated data and observed data of solar radiation.
Figure 4. Correlation between the estimated and observed global solar radiation at Vuwani and from satellite.
3.2. Performance of power generation models
To assess the performance of three power generation models with respect to the data provided by the manufacturer of the solar panel at the research site, it was conducted to determine the maximum output. Table shows that Model 3 had the accuracy much closer to the manufacturer’s supplied data by 1.84 % (percentage relative error), which was better than Model 2 and Model 1 of 9.36% and 30.45%, respectively. Therefore, Model 3 was selected for the determination of the expected solar power output based on the predicted solar radiation for the current study.
Table 4. The solar power output (W) values at STC from three models and the percentage relative error
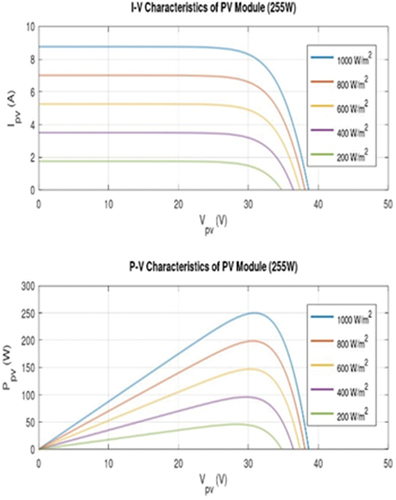
The results showed that Model 3 successfully exhibited curves. depict the characteristic curves of the selected PV technology from Model 3 on the MATLAB/Simulink. The MATLAB code was used to simulate the
and
curves to predict the peak power at variable temperature (25–65°C at constant solar radiation of 1000 W.m−2) and variable irradiance (200 to 1000 W.m−2 at constant cell temperature of 25°C), respectively.
Figure 5. and
curves for PV module with varying temperature at constant solar radiation.
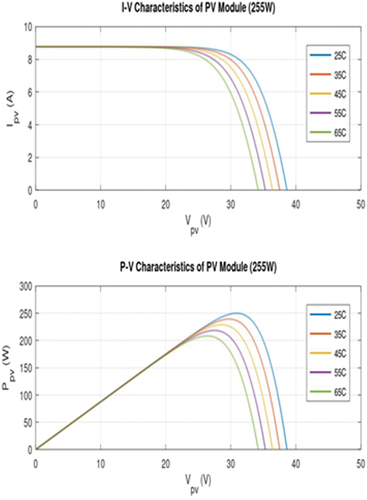
Figure 6. and
curves for PV module with varying irradiance at constant temperature.
3.3. Monthly average power output
shows monthly average generation power calculated for one solar panel in the array made of20255W panels, which was determined through the characteristic curves using Model 3. The model shows similar trends throughout the year with temperature, and estimated and modelled measurements of solar radiation.
Figure 7. Monthly average power output estimated based on the modelled solar radiation.
4. Conclusion
In this study, the solar radiation based on the geographical and meteorological conditions in Vuwani was determined. The performance of temperature-based empirical model in estimating global solar radiation was validated by comparing its calculated values with the measured values from the ground-station and two satellite-based data sources. The main findings from this research paper are summarised as follows:
The
model demonstrated strong correlation of 0.83, 0.94, and 0.92 when compared with the measured global solar radiation from the ground-station and NASA Prediction of Worldwide Energy Resources the Copernicus Atmosphere Monitoring (satellite-based), respectively. Statistical evaluation agreed well with the corresponding findings by other researchers in the literature.
The values of solar radiation calculated by
In October, the results showed a huge deviation of about 25% between the calculated and measured values of radiation. This deviation is an indication of the model’s limitations of not factoring in other meteorological conditions, such as rainy days, wind, clouds covering, and relative humidity, which significantly affect solar radiation. Therefore, further studies to assess these conditions are necessary in future to see if the results can be improved.
Results of solar radiation that were determined through the
Therefore, any design of PV system in Vuwani based on the findings of this assessment should be able to meet the power demand in June.
The power generation model follows the same trends of decreasing when solar radiation decreased and vice versa.
List of symbols
Table
Disclosure statement
No potential conflict of interest was reported by the author(s).
Additional information
Funding
References
- Almorox, J., & Hontoria, C. (2004). Models for obtaining daily global solar radiation with measured air temperature data in Madrid (Spain). Energy Conversion and Management, 45, 209–12.
- Amekudzi, L. K., Preko, K., Aryee, J., Boakye, O. R., & Quansah, E. (2014). Empirical models for estimating global solar radiation over the Ashanti region of Ghana. Journal of Solar Energy, 1–6.
- Awara, S., Lynch, M., Pfenninger, S., Schell, K., Sioshansi, I., Staffell, I., Samaan, N., Tindemans, S. H., Wilson, A. L., Zachary, S., Zareipour, H., & Dent, C. J. 2020. Capacity value of solar power and other variable generation. Report of the IEEE PES Task Force on Capacity Value of Solar Power.
- Ayzvazogluyuksel, O., & Filik, U. B. 2017. Power output forecasting of a solar house by considering different cell temperature methods. Conference paper, Anadolu University, IEE Xplore: 1253–1257.
- Cheng, C., Duan, S., Cai, T., & Liu, B. (2011). Online 24-h solar power forecasting based on weather type classification using artificial neural network. Solar Energy, 85(11), 2856–2870. https://doi.org/10.1016/j.solener.2011.08.027
- Ciulla, G., Lo Brano, V., Di Dio, V., & Cipriani, G. (2014). A comparison of different one-diode models for the representation of I-V characteristic of a PV cell. Renewable and Sustainable Energy Reviews, 32, 684–696. https://doi.org/10.1016/j.rser.2014.01.027
- De Soto, W., Klein, S. A., & Beckman, W. A. (2006). Improvement and validation of a model for photovoltaic array performance. Solar Energy, 80(1), 78–88. https://doi.org/10.1016/j.solener.2005.06.010
- Ishiharay, A. K., & Poolla, I. C. (2018). Localized solar power prediction based on weather data from local history and global forecasts (pp. 94035). ECE, Carnegie Mellon University (SV), Moffett Field.
- Khatib, T., Elmenreich, W., & Mohamed, A. (2017). Simplified I-V characteristic tester for photovoltaic modules using a DC-DC boost converter. Sustainability, 9(4), 657. https://doi.org/10.3390/su9040657
- Maluta, N. E., & Mulaudzi, T. S. (2018). Evaluation of the temperature based models for the estimation of global solar radiation in Pretoria, Gauteng province of South Africa. International Energy Journal, 18, 181–190.
- Marwal, V. (2012). A comparative study of correlation functions for estimation of monthly mean daily global solar radiation for Jaipur, Rajasthan (India). Indian Journal of Science and Technology, 5(5), 2729–2732. https://doi.org/10.17485/ijst/2012/v5i5.8
- Miguntanha, N. P., Jayasinghe, M. T. R., & Sendanayake, S. (2015). Predicting solar radiation for tropical islands from rainfall data. Journal of Urban and Environmental Engineering, 9, 109–118.
- Ramli, A., Prasetyono, E., Wicaksana, R. W., Windarko, N. A., Sedraoui, K., & Al-Turki, Y. A. (2016). On the investigation of photovoltaic output power reduction due to dust accumulation and weather conditions. Renewable Energy, 99, 836–844. https://doi.org/10.1016/j.renene.2016.07.063
- Skoplaki, E., & Palyvos, J. A. (2009). On the temperature dependence of photovoltaic module electrical performance: A review of efficiency/power correlations. Solar Energy, 83(5), 614–624. https://doi.org/10.1016/j.solener.2008.10.008
- USAid, University of Venda. 2020. Solar Radiometric Data for Public South African Universities Radiometric Network. [Online]. Available: http://sauran.ac.za. [Accessed 22 November 2020]
- Zhang, Q. (2018). Comparative analysis of global solar radiation models in different regions of China. Advances in Meteorology, 1–22.