
 ?Mathematical formulae have been encoded as MathML and are displayed in this HTML version using MathJax in order to improve their display. Uncheck the box to turn MathJax off. This feature requires Javascript. Click on a formula to zoom.
Abstract
The Hybrid III 50th percentile (H350) Anthropomorphic Test Devices (ATD) is the most widely used crash test dummy to identify the best seatbelt and airbags configuration for frontal impact load cases. However, the H350 was developed based on the United States (US) anthropometric size, back in 1976. In other words, the restraint system optimized using the H350 is not optimized for other populations. To investigate this issue, a finite element model of Hybrid III 50th percentile (H350M) of Malaysian population was developed and analysed in this work. Validation of the new biofidelity corridors was performed to ensure that this newly crash test dummy can represent the population under consideration. In this study, the H350M was integrated into a finite element vehicle model, to simulate a frontal rigid barrier crash load case performed at 56 km/h and compared with the existing H350. The H350 integrated vehicle-occupant simulation model has been correlated with a physical test. The model managed to achieve the average Correlation and Analysis (CORA) rating of 0.722. The simulation results showed that the newly H350M experienced a higher head acceleration, Head Injury Criterion (HIC15), 3 ms chest acceleration and chest displacement compared to the H350, as they were increased from 64.3 g to 70.6 g, 370 to 542, 49.6 g to 52.6 g, and from 26.5 mm to 26.6 mm, respectively. Generally, higher head acceleration, HIC15 and chest displacement lead to higher injuries during frontal crash accidents. Hence, the recommendations to reduce injuries are also discussed and explored in this study.
1. Background
Safety restraint systems such as the pretensioner, retractor, and frontal airbags are optimized by using the Hybrid III 50th percentile (H350) Anthropomorphic Test Device (ATD) during vehicle development process. The H350 ATD is equipped with various sensors such as accelerometers, potentiometers and load cells to record the time histories during the crash test. After the test, the accelerations, forces and moments are extracted and compared against the injury limits. The injury limits are derived from human cadavers, which is commonly known as Post Mortem Human Subjects (PMHS).The kinematics of the H350 ATD can resemble humans to a certain extent through numerous validations against PMHS. Using the H350 ATD, vehicle manufacturers can select appropriate safety restraint configurations within the specified injury limits. Currently, most vehicle manufacturers are utilizing the finite element (FE) approach in the early development stage to reduce the development time and cost. The process to simulate the occupant injury results during the vehicle development process is commonly known as an occupant safety simulation.
It must be emphasized that the H350 was developed in 1976. It was designed based on the United States (US) anthropometric data (Xu et al., Citation2018), thus, the size and mass are different compared to the average Malaysian. From the literature, the Malaysian 50th percentile mass is about 66.0 kg (Abd Rahman et al., Citation2018). However, the H350 ATD is weighted at 78.2 kg (Isa et al., Citation2016). Based on the study conducted by Happee et al., it was observed the head and chest acceleration increase with the reduction of occupant mass (Happee et al., Citation1998). Therefore, it is expected that the head and chest acceleration for the Malaysian will be higher than the US counterpart. Additionally, it can be hypothesized that the current safety restraint system optimized by using the H350 is not perfectly fit the local population.
One of the methods to investigate the effect of anthropometric size and mass on the local population is by scaling the finite element model of the H350. The scaled model can be integrated into the vehicle model with the validated restraint system. There are only a few studies on the scaled finite element ATD. One of them is the study made by Cao et al. on the impact of Chinese anthropometric size in a frontal crash (Cao et al., Citation2014). In this study, it was concluded that changing dimension of the ATD has a great effect on the injuries prediction. There are also studies on the scaled H350 based on the Vietnamese population, focused on the standing H350 (Ly & Hoang, Citation2017). On the other hand, a preliminary study on the comparison between the standard Hybrid III and the one scaled according to the Malaysian anthropometric in a frontal crash has been made by Samad et al. (Citation2021). The findings corroborated the study conducted by Happe et al.
Regardless, it can be observed that the aforementioned studies have not discussed the validation of the scaled ATD. Hence, concern whether its kinematics and responses can represent the average local population or not is yet to be answered. The validation of the scaled ATD, therefore, become the focus of attention in this paper. To explore further in this area, it is necessary to develop and validate the Hybrid III 50th percentile Malaysian size (H350M) ATD. The development process of the H350M using the FE approach is discussed thoroughly in the following sections. Subsequently, the correlation between the simulation and physical test based on the Federal Motor Vehicle Safety Standards (FMVSS) 208 frontal rigid barrier impact at 56 km/h is performed. Finally, the improvement proposals are explored.
2. ATD calibration and validation
First of all, the H350 FE model was retrieved from Livermore Software Technology (LST), which is known as the developer of popular numerical code, LS-Dyna. The current H350 model needs to be validated to ensure the reliability of the injury prediction. All the required simulations are referring to the regulation specified in the Code of Federal Regulations (CFR) Title 49, Part 572. This validation process is important to ensure the H350 kinematics, forces, moments and local displacements are confined within the intended biofidelity corridors. Biofidelity corridors define the limits that can be accepted for ATD kinematic responses which are derived from PMHS. There are still efforts can be found conducted to improve the current biofidelity corridors. For example, an international task force was formed to propose a new set of thorax biofidelity corridors in frontal impact based on the PMHS test results (Lebarbé & Petit, Citation2010).
In this paper, the scope of study is limited to the upper body, thus, the required validations are the head drop, neck extension, neck flexion and chest pendulum impact simulations. First, a global scale factor is calculated to scale the H350 to H350M. The global scale factor between the Malaysian and the US anthropometric size is 0.9437 (Samad et al., Citation2021). This scale factor was calculated based on the data measured by Abd Rahman et al. (Citation2018). The H350 then can be scaled to the newly H350M by using the chosen pre-processor. Additional FE morphing process is also necessary to meet the desired mass target. Once the H350M size and mass are confirmed, the new biofidelity corridors for the head, neck and chest must be calculated. Further changes to the FE model can be performed if the response is not reasonably agreed with the biofidelity corridors.
2.1. Head calibration
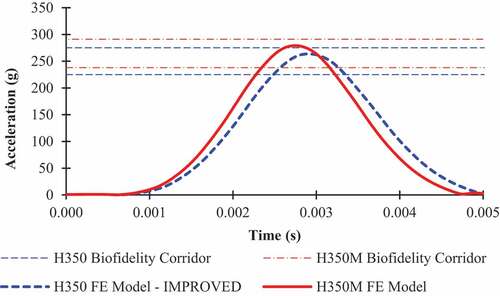
The head impact simulation is performed on the H350. The initial result shows that the H350 developed by LST does not meet the head biofidelity corridor. To address this issue, the current head skin material used by LST has been replaced based on the study made by Wood et al. (Citation2010). Referring to Figure , with the new material, the H350 is now able to meet the head biofidelity corridor. After the H350 has been scaled to the H350M, the same simulation is performed. The calculation of the new biofidelity corridor is calculated using EquationEquation (1(1)
(1) ; Mertz et al., Citation1989).
Figure 1. Validation of H350 and H350M head biofidelity corridor.
where Ra is the head acceleration scale factor and λ is the dimension scaling in all directions.
Table shows the calculated head biofidelity corridor for the H350. The head biofidelity corridor only consists of the upper and lower limits. The head peak magnitude acceleration must lie within the lower and upper limit for acceptance criteria. From Figure , the comparison of the H350 and the H350M head acceleration result shows that both H350 and H350M can meet the head biofidelity requirement.
Table 1. Calculated head biofidelity corridor for the H350M
2.2. Neck calibration
Next is the neck extension and neck flexion simulation. To conduct this simulation, it is required to design the pendulum and the crushable foam as shown in CFR Title 49, Part 572. A new head-neck biofidelity corridor can be derived by using EquationEquations (2)(2)
(2) and (Equation3
(3)
(3) ; Mertz et al., Citation1989).
where RM is the scale factor between MS, which is the scaled dummy moment, and MH, which is the standard H350 moment.
where Rθ is the ratio between θS, the rotation angle for the scaled dummy, and θH, the rotation angle for the H350.
Since the new dummy is scaled globally (), then the angle between H350 and the scaled dummy will be the same. Therefore, the scale factor for the RM is equal to 0.94373. Table compares the neck biofidelity corridor between the H350 and the H350M. Referring to the table, there are two types of biofidelity requirements for the neck, which is the flexion, and extension. Both flexion and extension consist of the upper and lower boundary. The upper and lower boundary represents the region of the neck moment and angle response during the loading and unloading condition in the pendulum impact test. To validate the H350 and the H350M, the pendulum is released at a certain height to achieve the impact velocity between 5.94 m/s and 6.19 m/s. A comparison of the simulation results between the H350 and H350M neck extension and neck flexion against its biofidelity corridors is plotted in Figures . The result shows that both ATDs can meet the neck biofidelity corridors requirement. Therefore, there is no modification required on the head-neck assembly. In the pendulum impact test (or simulation), criteria such as pendulum impact speed and pendulum deceleration must be met before the measurement of the neck moment and rotation can be considered.
Figure 2. H350 and H350M neck extension response.
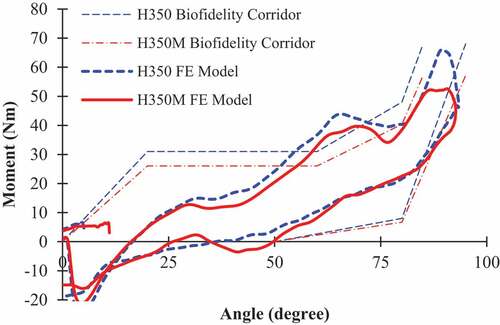
Figure 3. H350 and H350M neck flexion response.
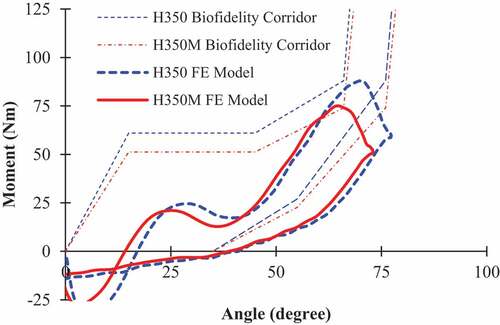
Table 2. Calculated neck biofidelity corridor for H350M
2.3. Chest calibration
According to Mertz et al., if the pendulum velocity remains constant, then the chest deflection and reaction force from the impact will depend on the pendulum mass, the torso mass, and the thoracic stiffness. With that assumptions, EquationEquation (5)(5)
(5) and EquationEquation (6)
(6)
(6) are derived (Mertz et al., Citation1989)
where RD is the ratio between the Ds and DH chest deflection of the scaled dummy and the H350, respectively. RF is the ratio between Fs and FH, which defines the reaction force from the pendulum impact between the scaled dummy and the H350, respectively. RK is the ratio of thoracic stiffness, RP is the pendulum mass ratio, mp is the pendulum mass and mt is the torso mass.
In this study, since the same pendulum size and mass is used in the H350M simulation, thus, RP is set equal to 1. As for torso mass, there is no chance to measure it physically, thus, mass from the finite element model is used. The torso mass of the H350M measured at 17.25 kg, is close to the mass of the torso published by Mertz et al. Since the reference H350 model has a similar mass as the physical model, thus, it can be assumed that the scaled model can provide a reliable measurement of mass. After the H350 has been scaled to H350M, the torso mass is measured at 14.5 kg. Using EquationEquation (5)(5)
(5) and EquationEquation (6)
(6)
(6) , the calculated value for RD and RF of H350M is 0.9791 and 0.9249, respectively. Table shows the comparison between the chest biofidelity corridor for both H350 and H350M. Referring to the table, the upper limit and lower limit of the biofidelity corridors refer to the boundary of the force-displacement curve during the pendulum impact loading and unloading condition.
Table 3. Calculated chest biofidelity corridor for H350M
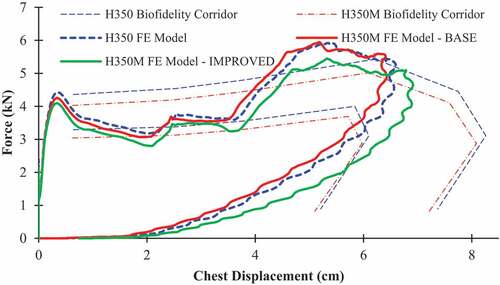
The initial design of H350M does not meet the new biofidelity corridors where the curve is similar to H350, as shown in Figure . This is due to the ribs which are modelled using shell elements. Therefore, when the scaling is performed, parts that were modelled by using the shell elements thickness remain the same. Thus, it is necessary to change the thickness of the ribs, until it can meet the new design target. To change the thickness, an iteration was made to reduce the thickness by 0.1 mm for each iteration. Referring to Figure , by changing the thickness from 1.98 mm (BASE) to 1.6 mm (IMPROVED), a better agreement with the calculated biofidelity corridors is obtained.
Figure 4. H350 and H350M chest pendulum impact response.
3. Injuries prediction in frontal rigid barrier load cases
After both H350 and H350M have been validated, these ATDs were integrated into the Toyota Yaris model developed by the Center for Collision Safety and Analysis at George Mason University that was sponsored by Federal Highway Administration (Kan & Marzougui, Citation2016; Marzougui & Samaha et al., Citation2011). Verification runs were made to ensure that the structural response matches with the test data 05677 retrieved from the National Highway Traffic Safety Administration database (NHTSA, Citation2006). Modifications were made to the vehicle finite element by integrating an airbag, adding a collapsible steering column mechanism, modification on the seat configuration and integrating a seatbelt. The parameters such as the time to fire, the airbag volume, vent hole size and the seat belt load limiter that have been identified by Samad et al. are used in this study (Samad et al., Citation2021). The integrated vehicle-occupant FE model developed by Samad et al. has achieved an average Correlation and Analysis (CORA) rating of 0.708. In this study, the average CORA rating has increased to 0.722 because of the improvement made on the H350 head biofidelity.
3.1. Comparison between the newly H350M and the existing H350 in frontal rigid barrier 56 km/h load case
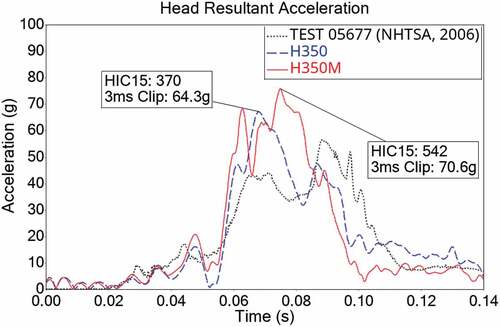
After the H350M has been integrated into the Toyota Yaris model, the same restraint system configuration is used. The dummy is positioned based on the method used by Samad et al. (Citation2021). Test data was downloaded from the NHTSA and used for comparison reference (NHTSA, Citation2006). Figure shows the simulation of the frontal crash according to FMVSS 208. Based on Figure , the 3 ms head acceleration of the H350 and the H350M is 64.3 g and 70.6 g, respectively. The H350M head acceleration is close to the regulation limit of 72 g. Meanwhile, the Head Injury Criterion (HIC15) also increased from 370 to 542, which can be considered quite significant.
Figure 5. Frontal rigid barrier 56 km/h load case.
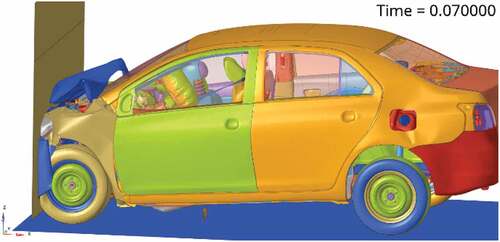
Figure 6. Head acceleration time history.
As for the neck injuries, the H350M has noticeably lower shear force, axial force and moment compared to the H350. The H350M neck shear is expected to have a lower force due to its head-neck assembly is lighter than the H350. Figure shows the comparison between the H350M and H350 neck shear force-time history. In this study, the H350M neck axial is significantly lower than the H350 as depicted in Figure .
Figure 7. Neck shear force time history.
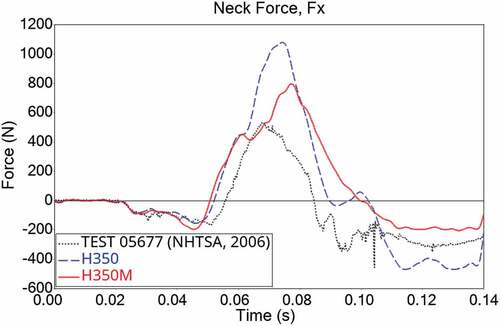
Figure 8. Neck axial force time history.
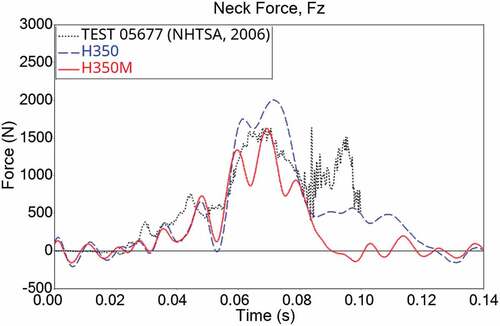
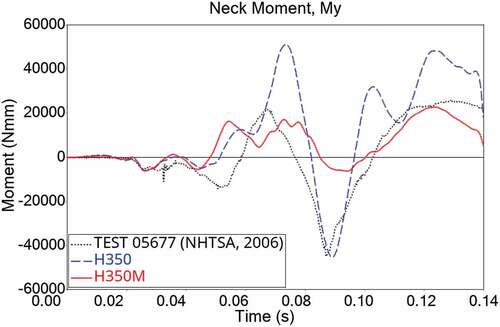
As for the neck moment, only the negative value is considered. Figure shows that the H350M also has a significantly lower neck moment than the H350. This is also expected since having a lighter head-neck assembly and shorter neck can significantly reduce the neck moment. It is worth noting that the difference in the neck shear, neck axial and neck moment between the H350M and H350 started to occur after 60 ms due to the head-neck interaction with the airbags.
Figure 9. Neck moment time history.
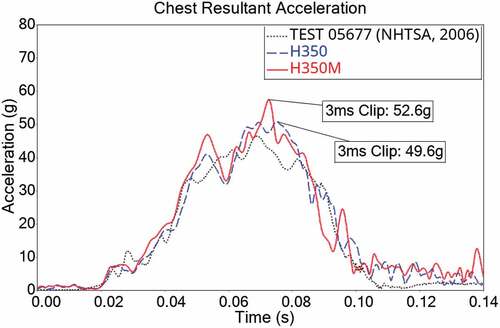
Chest accelerations are highly influenced by the seatbelt load limiter. As can be seen in Figure , the seatbelt force for both H350M and H350 has a good correlation with the physical test. From the same graph, the unloading of the seatbelt in the H350M occurs earlier than the H350. This is because the H350M has less kinetic energy than the H350 for having lower mass. Since the seat belt unloading in the H350M occurs earlier, the chest acceleration is expected to be higher. The 3 ms clip measured from the H350 and the H350M chest acceleration is 49.6 g and 52.6 g, respectively as depicted in Figure .
Figure 10. Seatbelt force time history.
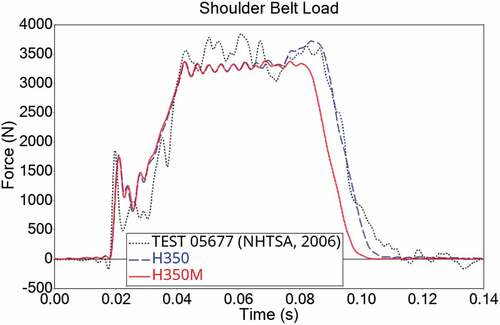
Figure 11. Chest acceleration time history.
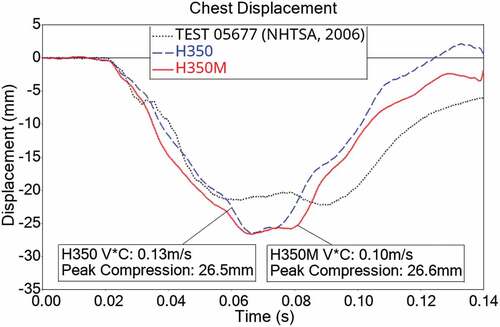
As for the peak chest displacement, the H350 is measured at 26.5 mm while the H350M is 26.6 mm. Even though the difference is minimal, it should be pointed out that the H350M have a smaller chest cavity than the H350 thus the difference in displacement cannot be compared directly. For reference, in UN ECE R137, the H350 chest displacement has a regulatory limit of 42 mm while the smaller Hybrid III 5th percentile (H305) has a limit of 34 mm. A safety limit of 39 mm for H350M is proposed by Samad et al. (Citation2021). Therefore, the ratio between the calculated chest displacement and its safety limit should be used to compare the severity between the H350 and the H350M. This leads to a ratio of 0.631 and 0.682 for H350 and H350M respectively, thus, indicating that the H350M have a higher injury than the H350. The comparison between the H350M and the H350 chest displacement is shown in Figure . This finding is significant because, without the chest validation with the new biofidelity corridors, the H350M is expected to have a lower chest displacement than the H350, as reported by Samad et al. (Citation2021).
Figure 12. Chest displacement time history.
3.2. Methods to improve the H350M injury result
Referring to the results discussed in the previous section, it can be observed the H350M head acceleration, HIC15, chest acceleration and chest displacement are higher than the H350. Generally, several methods can be performed to reduce occupant injuries. One of the methods is to have a front-loaded acceleration pulse (Choi & Jeong, Citation2012). However, this requires major structural changes, thus, it is only suitable for new vehicle development. Another alternative is to have different airbags and seat belt configurations that are suitable for the Malaysian population. According to Kim and Jeong, the front airbag and seatbelt parameters are sensitive to head injuries (Kim & Jeong, Citation2010). On the other hand, chest displacement also can be improved by adjusting the seat belt load limit.
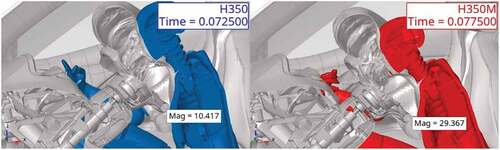
Before the modifications are conducted, the minimum gap between the chest and steering wheel must be measured. As shown in Figure , the H350M has a gap of 29.4 mm and 10.4 mm for the H350. The additional 19 mm gap allows the engineers to reduce the airbag vent hole size, and lower the seat belt load limit to reduce head and chest injuries. In addition, the H350M neck shear, neck axial and neck moment calculated in the previous section have a large safety margin with the regulatory limit, thus, it is possible to make changes to the aforementioned restraint system.
Figure 13. Minimum gap between chest and steering wheel.
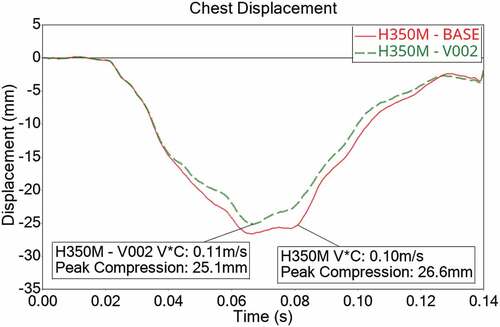
An additional iteration was made on the simulation model. The airbag vent hole size is changed from 35 mm to 40 mm, and the seat belt load limit has been reduced from 3.3kN to 3.0kN. From hereon, the current model and the modified model are referred to as BASE and V002, respectively. As shown in Figure , the HIC15 and 3 ms acceleration has significantly reduced from 542 to 488 and 70.6 g to 65.3 g, respectively. As for the chest injury, the peak chest displacement for the BASE is 26.6 mm, and 25.1 mm for the V002, as depicted in Figure . More studies should be conducted to verify the requirement to use a unique restraint system for Malaysians to reduce the injuries without further changes to the structure.
Figure 14. Reduction of the H350M head injury by changing airbag vent hole size.
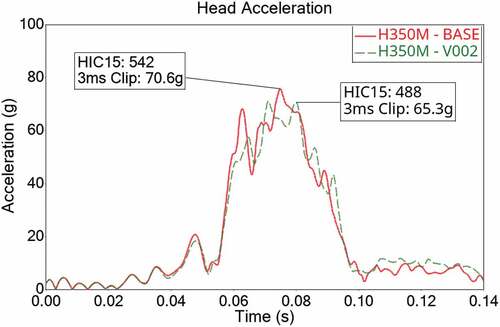
Figure 15. Reduction of the H350M chest displacement by changing seat belt load limit.
4. Conclusion and recommendation
The development and validation of the newly developed H350M FE model are discussed in this paper. The aforementioned FE models can be used further to compare the injuries associated with different anthropometric sizes on frontal crashes. It is worth mentioning that since this study is focusing on the upper body, further validations or calibrations on the H350M can be extended to include the femur, knee, tibia and foot.
In this study, the newly H350M experience higher head acceleration and HIC15 than the H350 with an increase from 64.3 g to 70.6 g and 370 to 542 respectively. It is worth noting that a HIC15 has a safety limit of 700, which accounts for a 5% risk of skull fracture (Prasad, Citation1999). Therefore, a large increase of HIC15 observed in H350M is a concern. Additionally, the H350M 3 ms chest acceleration and chest displacement are also higher compared to the H350 with an increase from 49.6 g to 52.6 g and 26.5 mm to 26.6 mm, respectively. The increase of 3 ms chest acceleration observed on smaller ATDs is in line with the study made by Happee et al. (Citation1998), Samad et al. (Citation2021), and Cao et al. (Citation2014). On contrary, the H350M experience lower neck forces and moment than the H350. It is observed that the neck shear force and neck tension has reduced from 1079.4 N to 797.2 N and 2002.6 N to 1623.6 N. Neck moment also has seen a reduction from 45.4 Nm to 6.3 Nm. Further, it is also proven that these injuries can be reduced by adjusting the airbag and seatbelt parameters. Increasing the airbag vent hole size and reducing the seatbelt load limiter can reduce the H350M 3 ms head acceleration, HIC15 and chest displacement to 65.3 g, 488 and 25.1 mm, respectively. The overall injury comparison is summarized in Table . Since this study is only focusing on one load case, it is also recommended to extend this study by adding more frontal load cases such as offset deformable barrier impact, front pole impact and oblique wall impact.
Table 4. Injuries comparison between H350 and H350M
Lastly, the application of H350M is not limited to vehicle safety. Based on the literature, the H350 has been used in various applications such as helmet design, assessment due to helicopter crashes and impacts with industrial robots (Annett & Horta, Citation2011; Bliven et al., Citation2019; Haddadin et al., Citation2009). Thus, similar studies also can be performed by using the newly developed H350M.
Disclosure statement
No potential conflict of interest was reported by the author(s).
Additional information
Funding
References
- Abd Rahman, N. I., Md Dawal, S. Z., Yusoff, N., & Mohd Kamil, N. S. (2018). Anthropometric measurements among four Asian countries in designing sitting and standing workstations. Sādhanā, 43(1), 10. https://doi.org/10.1007/s12046-017-0768-8
- Annett, M. S., & Horta, L. G. (2011). Comparison of test and finite element analysis for two full-scale helicopter crash tests. 52nd AIAA/ASME/ASCE/AHS/ASC Structures, Structural Dynamics and Materials Conference 19th AIAA/ASME/AHS Adaptive Structures Conference 13t. p. 1804.
- Bliven, E., Rouhier, A., Tsai, S., Willinger, R., Bourdet, N., Deck, C., Madey, S. M., & Bottlang, M. (2019). Evaluation of a novel bicycle helmet concept in oblique impact testing. Accident Analysis & Prevention, 124, 58–13. https://doi.org/10.1016/j.aap.2018.12.017
- Cao, L., et al. (2014). Development strategy of frontal crash dummy based on Chinese human body. Chinese Mechanical Engineering, 25(10), 1412–1414. http://www.cmemo.org.cn/EN/abstract/abstract4706.shtml
- Choi, W.-M., & Jeong, H.-Y. (2012). Design methodology to reduce the chest deflection in US NCAP and EURO NCAP tests. International Journal of Automotive Technology, 13(5), 765–773. https://doi.org/10.1007/s12239-012-0076-6
- Haddadin, S., Albu-Schaffer, A., Frommberger, M., Rossmann, J., & Hirzinger, G (2009). The ‘DLR Crash Report’: Towards a standard crash-testing protocol for robot safety - Part II: Discussions. 2009 IEEE International Conference on Robotics and Automation. IEEE, Kobe, pp. 280–287.
- Happee, R., vHappee, R., Van Haaster, R., Michaelsen, L., & Hoffman, R (1998). Optimisation of vehicle passive safety for occupants with varying anthropometry. ESV Conference.
- Isa, M. H., Deros, B., Jawi, Z. M., & Kassim, K. A. A (2016). An anthropometric comparison of current anthropometric test devices (ATDs) with Malaysian adults. Malaysian Journal of Public Health Medicine, 1, 15–21. https://www.mjphm.org.my/mjphm/index.php?option=com_content&view=article&id=760:2016-special-volume-1&catid=112:2016-special-volume-1&Itemid=127
- Kan, C. D., & Marzougui, D. (2016). Development & validation of a finite element model for the 2010 Toyota Yaris passenger sedan. Center for Collision Safety and Analysis. https://doi.org/10.13021/G8CC7G
- Kim, T.-W., & Jeong, H.-Y. (2010). Stochastic analysis of the variation in injury numbers of automobile frontal crash tests. International Journal of Automotive Technology, 11(4), 481–488. https://doi.org/10.1007/s12239-010-0059-4
- Lebarbé, M., & Petit, P. (2010). Biofidelity corridors for the thorax in frontal impact-update by an international task force. https://www-nrd.nhtsa.dot.gov/pdf/bio/proceedings/2010_38/38-5.pdf
- Ly, A. H., & Hoang, T. D. (2017). Scaling the 50th percentile Hybrid III dummy model to the height and the weight of a typical Vietnamese. Science & Technology Development Journal - Engineering and Technology, 2(SI2), SI105–SI113.
- Marzougui, D., and Samaha, R., Cui, C., & Kan, C. D. (2011). Development & validation of a finite element model for the 2010 Toyota Yaris passenger sedan. Prepared for FHWA. National Crash Analysis Center.
- Mertz, H. J., Irwin, A. L., Melvin, J. W., Stanaker, R. L., & Beebe, M. S. (1989). Size, weight and biomechanical impact response requirements for adult size small female and large male dummies. SAE Technical Paper.
- NHTSA. (2006). New car assessment program frontal barrier impact test—Toyota motor corporation 2007 Toyota Yaris. National Highway Traffic Safety Administration.
- Prasad, P. (1999). Biomechanical basis for injury criteria used in crashworthiness regulations. IRCOBI Conference.
- Samad, M. S. A., Mohd Nor, M. K., Abdul Majid, M. M., & Abu Kassim, K. A. (2021). Investigation on the effect of Malaysian anthropometric size in vehicle crash safety by using finite element method. Journal of the Society of Automotive Engineers Malaysia, 5(3), 176–184. https://doi.org/10.56381/jsaem.v5i3.187
- Wood, G. W., Panzer, M. B., Bass, C. R., & Myers, B. S. (2010). Viscoelastic properties of Hybrid III head skin. SAE International Journal of Materials and Manufacturing, 3(1), 186–193. https://doi.org/10.4271/2010-01-0383
- Xu, T., Sheng, X., Zhang, T., Liu, H., Liang, X., & Ding, A. (2018). Development and validation of dummies and human models used in crash test. Applied Bionics and Biomechanics, 2018, 1–12. https://doi.org/10.1155/2018/3832850