
Abstract
It is imperative for researchers to study construction projects in all industries, in order to find lasting solutions to the occurrence of time overruns during projects. Considering the myriad of studies on time overruns in construction projects, there is a scarcity of such studies in the construction of cell sites for the telecom industry. Therefore, this paper sought to investigate time overruns in the construction of cell sites, and quantitatively, to determine the real causal factors of its occurrence within the context of the Ghanaian telecom industry. As a mixed method approach, this study used the expert interview method in the case study, and structured questionnaires in the survey study to elicit information from practitioners with direct project management responsibilities in cell site construction. The findings indicate that time overruns, ranging from three weeks to two months, occur across the industry, with the overall impact of loss of revenue and business value. After the EFA and CFA analysis, 9 out of 28 factors were retained, forming two principal components named “project planning” and “project control”. The findings and recommendations made by this paper would enlighten the perspective of project management practitioners in their quest to deliver successful cell site construction. Both scholars and industry players can use the research methodology that has been designed to aid and facilitate the conduct of any such study in any industry in future.
PUBLIC INTEREST STATEMENT
The magnitude of cell sites construction’s investments contribute enormously to national investment and economic growth, especially in developing economies. Regardless of its importance, most of the cell site construction projects carried out in Ghana do experience time overruns which result in loss of revenue and business value, impacting the telecom industry’s contribution to economic development. In view of this, it was important to establish how time overrun comes about, it real causal factors and the mitigative measures that could minimise its occurrence. Subsequently, it will ensure effective and efficient delivery of the cell site construction projects within the specified period of time, which could enhance revenue achievement and improve business value.
1. Introduction
In recent times, the issue of time overruns in construction projects has become a matter of global concern. Both industry practitioners and researchers from all walks of life are concerned about construction overruns, irrespective of their country’s socio-economic status (Durdyev & Hosseini, Citation2019). In view of this, a significant amount of research has been conducted on time overruns in construction projects in different industries and geographical areas. The most recent studies include the construction industries in Malaysia (Yap et al., Citation2020), Portugal (Arantes & Ferreira, Citation2020), China (Chen et al., Citation2019), the United Kingdom (UK; Agyekum-Mensah and Knight, Citation2017), the United States of America (USA; Arditi et al., Citation2017), Tanzania (Sambasivan et al., Citation2017), Burkina Faso (Bagaya & Song, Citation2016), and Ghana (Asiedu et al., Citation2017); building projects in Pakistan (Hussain et al., Citation2018), Vietnam (Kim et al., Citation2016), and Ghana (Bentil et al., Citation2017; Famiyeh et al., Citation2017); oil and gas construction projects in Saudi Arabia (Seddeeq et al., Citation2019); manufacturing projects in Saudi Arabia (Abdellatif & Alshibani, Citation2019); power projects in Tanzania (Banobi & Jung, Citation2019), and road construction in Sudan (Khair et al., Citation2018), Libya (Alfakhri et al., Citation2017), Egypt (Aziz & Abdel-Hakam, Citation2016), Ghana (Amoatey & Ankrah, Citation2017).
There is, however, a scarcity of research studies focusing on cell site construction in the telecom industry. The telecom industry is one of the most significant and competitive industries in the world economy as it touches all spheres of life, particularly in driving the functions of other industries and the country at large (Balashova & Gromova, Citation2017). Owing to its fast growth nature, mobile network operators are required to continuously undertake cell site construction projects to satisfy the needs of a growing population (Al Zadjali et al., Citation2014). In Ghana, as a developing country, for instance, a mobile network operator MTN, undertook cell site construction projects (197 new 4 G sites and 561 new 3 G sites) to the tune of $143.7 million in 2017 to expand its network coverage to offer better service to existing and prospective subscribers (GNA (Ghana News Agency), Citation2017).
These types of cell site construction are highly capital intensive (Ameh et al., Citation2010), and their outcomes contribute enormously to the national investment and economic development in developing economies (Ofori, Citation2013; Sweis et al., Citation2013). The occurrence of time overruns is among the key challenges faced during construction projects (Alaloul et al., Citation2020). More so, the resulting effects of time overruns bring about cynicism, litigation, feelings of apprehension among the project team, and cash-flow problems (Seddeeq et al., Citation2019). In this sense, the lack of studies to assess the occurrence of time overruns on cell site construction projects in the telecom industry that serve as a benchmark to enhance project delivery is a problem. Although, as mentioned above, there are a myriad of studies, the existing studies that focus on construction projects within the context of a specific industry in a particular jurisdiction may not always be transferable to other service industries and geographies. The reason is that every country has a set of rules and regulations that govern the operations of their industries. In support of this assumption, Abdellatif and Alshibani (Abdellatif & Alshibani, Citation2019) added that a construction project being undertaken in a different industry may encounter different regulations and requirements. Therefore, this study focuses on time overruns in cell site construction within the context of the Ghanaian telecom industry.
1.1. AIM and scope of the study
There is still a lot to do in all construction projects to ensure that the occurrence of time overruns is limited to the barest minimum. For this reason, this study centres on cell site construction in the Ghanaian telecom industry, due to the magnitude of cell site investments and their contribution to the economic development in Ghana (GNA (Ghana News Agency), Citation2017, GCT (Ghana Chamber of Telecommunications), Citation2020). The study, therefore, seeks to explore the concept of time overruns through the case study approach, and subsequently, to determine quantitatively the actual factors that cause time overruns through the use of factor analysis (EFA and CFA).
2. Literature review
The literature review spanned the years from 2016 to 2020 to obtain the most current studies on time overruns in construction projects. A detailed list was compiled of the factors related to time overruns in construction projects, based on the work of different authors in different industries and countries. Notably, it was determined that no research has been done on cell site construction in the Ghanaian telecom industry. In view of this, the researchers in the current study selected some studies from the extensive list, based on the similarities and relevance of their findings, to lay a foundation, since there is scarcity of research works based on the telecom industry. The time overrun factors selected from these studies were conceptualised to have resulted from project planning and project control-related activities. These selected factors are viewed from the perspective of the world at large, from the perspective of Africa specifically, and Ghana, as the focus of the study, as shown in .
Figure 1. Classification of time overrun causal factors across different industries and countries.
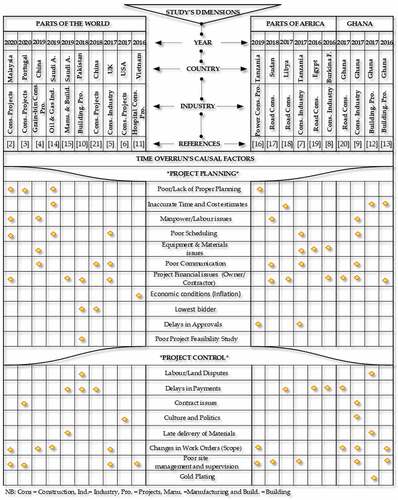
2.1. Project planning
Some factors have been identified that cause time overruns, mainly as a result of poorly managed project planning activities, as illustrated in . These causal factors have common practical meanings, although they might have been expressed semantically differently in the various studies. Also, these factors have been identified in studies conducted in different periods, industries, and countries (see, Figure ). For instance, “poor project planning” was a factor that was found to cause time overruns in the studies of Yap, Woon and Skitmore (Yap et al., Citation2020) in construction projects in Malaysia; Arantes and Ferreira (Arantes & Ferreira, Citation2020) in construction projects in Portugal; Assaf, Seddeeq, Abdallah and Hassanain (Seddeeq et al., Citation2019) in the oil and gas industry in Saudi Arabia; and Banobi and Jung (Banobi & Jung, Citation2019) in power construction in Tanzania. Furthermore, “inaccurate time and cost estimates” was found to cause time overruns in the studies of Alfakhri, Ismail, Khoiry, Arhad and Irtema (Alfakhri et al., Citation2017) in road construction in Libya (Seddeeq et al., Citation2019).
In addition, the remainder of the factors found across different studies in different industries and countries that the researchers considered relevant to this study and that were regarded as emanating from project planning activities are “manpower or labour issues” (Arantes & Ferreira, Citation2020; Asiedu et al., Citation2017; Khair et al., Citation2018; Yap et al., Citation2020), “poor scheduling” (Agyekum-Mensah and Knight, Citation2017; Asiedu et al., Citation2017; Sambasivan et al., Citation2017; Seddeeq et al., Citation2019; Yap et al., Citation2020), “equipment and material issues” (Aziz & Abdel-Hakam, Citation2016; Bagaya & song, Citation2016; Chen et al., Citation2019; Sambasivan et al., Citation2017), “poor communication” (Agyekum-Mensah and Knight, Citation2017; Asiedu et al., Citation2017; Chen et al., Citation2019; Khair et al., Citation2018; Sambasivan et al., Citation2017; Wang et al., Citation2018), “project financial issues” (Khair et al., Citation2018,1; Bagaya & Song, Citation2016,8; Amoatey & Ankrah, Citation2017; Asiedu et al., Citation2017; Famiyeh et al., Citation2017; Agyekum-Mensah and Knight, Citation2017; Hussain et al., Citation2018; Abdellatif & Alshibani, Citation2019; Yap et al., Citation2020), “economic conditions (inflations)” (Kim et al., Citation2016), “lowest bidder” (Hussain et al., Citation2018; Wang et al., Citation2018), “delays in approvals” (Banobi & Jung, Citation2019; Sambasivan et al., Citation2017), and “poor project feasibility study” (Hussain et al., Citation2018).
2.2. Project control
Other time overrun causal factors were identified from studies based on different industries and countries, and which the researchers in this study regarded as emanating from project control activities, as shown in Figure . Among the studies that found “labour or land dispute” as a time overrun causal factor is that of Hussain, Zhu, Ali, Aslam and Hussain (Hussain et al., Citation2018) in building projects in Pakistan, and that of Bentil, Nana-Addy, Asare and Fokuo-Kusi (Bentil et al., Citation2017) in building construction in Ghana. “Delays in payment” as causal factor was identified in the studies of Abdellatif and Alshibani (Abdellatif & Alshibani, Citation2019) in manufacturing projects in Saudi Arabia; Zhu et al. (Hussain et al., Citation2018); Wang, Ford, Chong and Zhang (Wang et al., Citation2018) in building projects in China; Alfakhri et al. (Alfakhri et al., Citation2017); Aziz and Abdel-Hakam (Aziz & Abdel-Hakam, Citation2016) in road construction in Egypt; and Bagaya and Song (Bagaya & Song, Citation2016) in public construction projects in Burkina Faso.
The remaining factors that were identified are ”contract management issues” (Arantes & Ferreira, Citation2020; Asiedu et al., Citation2017), “culture and politics” (Arditi et al., Citation2017; Asiedu et al., Citation2017), “late delivery of materials” (Abdellatif & Alshibani, Citation2019; Bentil et al., Citation2017), “changes in work orders (scope changes)” (Agyekum-Mensah and Knight, Citation2017; Amoatey & Ankrah, Citation2017; Asiedu et al., Citation2017; Banobi & Jung, Citation2019; Chen et al., Citation2019; Famiyeh et al., Citation2017; Seddeeq et al., Citation2019; Yap et al., Citation2020), “poor site management and supervision” (Yap et al., Citation2020; Arantes & Ferreira, Citation2020; Agyekum-Mensah and Knight, Citation2017; Kim et al., Citation2016; Banobi & Jung, Citation2019,1; Sambasivan et al., Citation2017,7; Asiedu et al., Citation2017; Famiyeh et al., Citation2017), and “gold-plating or over-specification” (Bentil et al., Citation2017).
2.3. Ghana as a focus area for the study
As a developing country, most of the research work in Ghana is focused on construction projects, such as the road and building industry, ignoring other important industries, such as the telecom industry, where serious and complex construction projects do take place, as indicated in Figure . Yap et al. (Yap et al., Citation2020) asserted that needless delay in project delivery is a common root cause of complications in construction projects, most especially, in developing countries. In view of this, this study used the above-mentioned research work on construction projects as a benchmark to investigate the occurrence of time overrun in cell site construction within the context of the Ghanaian telecom industry.
3. Methodology
3.1. Research design
The study adopted a mixed methods approach to investigate the research problem (Creswell, Citation2014). The use of mixed methods inspire confidence in the research findings, as sufficient evidence is provided to mitigate the weaknesses associated with a single method approach (Bryman, Citation2004; Caruth, Citation2013; Creswell & Plano Clark, Citation2011). Specifically, the study used an exploratory sequential mixed method; the intent behind it was that the study sought to do a qualitative investigation with a small sample size, and then aimed to support the findings quantitatively using a large sample size (Creswell & Plano Clark, Citation2011).
3.2. Qualitative research: phase 1
3.2.1. Expert interview method and sampling
The study used the expert interview method to interview six (6) senior project management practitioners through purposive sampling (Saunders et al., Citation2012), from four different companies within the telecommunication industry in Ghana. The study obtained permission from and access to four (4) companies out of a possible seven (7) working on cell site construction, as the project owners (i.e. mobile network operators) and the contracting vendors (i.e. tower companies and managed-service vendors (National Communications Authority, Citation2019; Osei-Owusu & Henten, Citation2017). The functional roles of the participants ranged from project/rollout manager to programme director, and all of them were highly recommended based on their in-depth understanding, knowledge, and level of experience on cell site construction in their respective companies.
This number of cases is in line with the four to ten cases in the sample, as recommended (Eisenhardt, Citation1989). Similarly, the minimum sample size for a case study suggested by Creswell (Creswell, Citation2002), is three to five cases. To maintain anonymity, the study used fictitious names to represent the names of these companies and their staff during the report on their specific practices and experiences (see, ).
Table 1. Functional roles and codes of the interviewees
3.2.2. Data collection procedure
The study used semi-structured interviews, specifically face-to-face interviews, to elicit responses to specific research questions, while also allowing for free expression of thoughts by the subjects (Chenail, Citation2012; Sekaran, Citation2003). The interviews were conducted after office hours between 6 pm and 8 pm owing to the busy schedules of these senior project management practitioners, which involved regular site visits and meetings. Preceding these interviews, their concerns were addressed telephonically after the receipt of the interview guide via email. With the participants’ consent, the interviews were recorded. The duration of the interviews ranged from 25 minutes (shortest) to 40 minutes (longest).
3.2.3. Data analysis
The study utilised the software program Atlas.ti to code the data for analysis, as it has many benefits, and employing such a program is a faster and more efficient way of storing and locating qualitative data (Creswell, Citation2014). The study used the qualitative analysis steps described by Creswell (Creswell, Citation2014), where raw data from the interview was transcribed, and through a “winnow” strategy (Guest et al., Citation2012) unwanted date was deleted. The data was coded to produce descriptions and themes through open coding, based on the commonality and uniqueness of participants’ responses (Creswell, Citation2014; Rossman & Rallis, Citation2012). To maintain the respondent’s anonymity, the companies and interviewees were provided with the pseudonyms A to D, and D1 to D6, respectively, as shown in .
3.2.4. Techniques used for model development
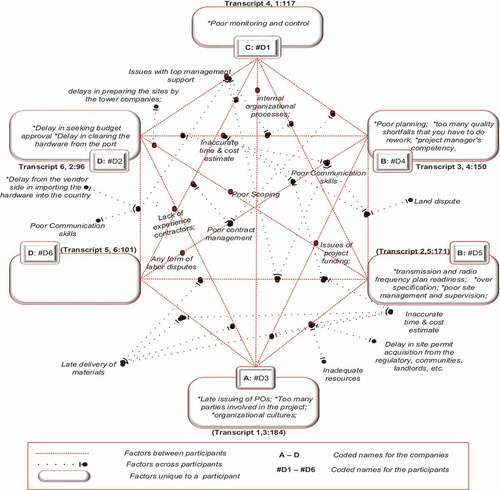
The study developed a diagram to show the elements derived from the narratives on time overrun (see, ), and a Model-Cage to demonstrate the similarities and differences between the time overrun causal factors across all the cases (see, ). These figures were developed based on the concept mapping and innovation concept techniques (Miles et al., Citation2014; Novak & Cañas, Citation2006).
Figure 2. Elements derived from the narratives on time overrun.
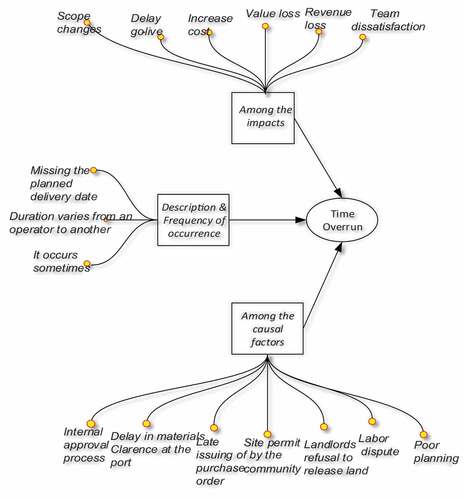
Figure 3. Model-cage for time overrun causal factors.
3.3. Quantitative research: phase 2
3.3.1. Sampling and data collection technique
A total of 230 questionnaires were administered online via Google Forms to individual employees within the seven telecom companies in Ghana who have direct project management responsibilities on cell site construction projects through the use of the proportionate stratified random sampling technique.
The questionnaires comprised Likert-scale measurements based on a 5-point rating system (Bryman, Citation2004). The study’s use of Likert scales facilitated the categorisation of question items and standardised responses, which eased the data analysis process with anchors such as: Strongly Disagree = 1; Disagree = 2; Neither Agree nor Disagree = 3; Agree = 4; Strongly Agree = 5.
As shown in , of the 230 questionnaires administered, 81% of the respondents returned the completed questionnaires due to continuous engagement with the employees through their bosses, phone calls, text messages, and personal visits. Therefore, a response of 81% does not violate the multivariate analysis assumptions for factor analysis (Bashir & Hassan, Citation2018).
Table 2. Sample data breakdown and response rate
3.3.2. Data analysis
The study performed factor analysis via IBM SPSS and AMOS version 25.0. Exploratory factor analysis (EFA) and confirmatory factor analysis (CFA) are the two techniques used to identify the factors that cause time overrun (Kline, Citation2016; Koyuncu & Kılıç, Citation2019). In this way, EFA is performed first to minimise a set of variables within a given construct and further test the retained variables with CFA for assessing the validity and reliability of a study (Koyuncu & Kılıç, Citation2019). The data response rate analysis was conducted and further subjected to data screening and missing value imputation. Additionally, tests of multivariate analysis’ assumptions were performed subsequent to descriptive analysis on demographic profiling and the analyses of key characteristics.
3.3.2.1. Descriptive analysis
The study used descriptive analysis to describe the essential characteristics of the study’s data. Sarmento and Costa (Sarmento & Costa, Citation2019) opined that descriptive analysis enables large amounts of data to be simplified in a sensible way, and allows for the presentation of quantitative descriptions in a more appropriate manner. Out of the 187 respondents, the study revealed that employees with direct management responsibility on cell site construction are male dominant (84%). With regards to age bracket, the majority of the participants are 32 years and older. The study also showed that 55% of the participants hold bachelor’s degree and 41% hold master’s degrees. In line with the positions held by the participants, 75% are managers/engineers, 11% are unit heads, 9% are directors, and the majority of these participants have a minimum of five years’ experience with their current companies. From the perspective of the role played in cell site construction, it was evident that all the participants were the right people for the study (ranging from project managers through to project directors), as per an assertion by the PMI (PMI, Citation2017; see, ).
Table 3. Summary of demographic profile
3.3.3. Testing factor analysis assumptions
The study performed the tests of multivariate analysis assumptions, specifically, normality and multi-collinearity tests, to assess the data validity and suitability to conduct EFA and CFA. In view of this, Koyuncu and Kilic (Koyuncu & Kılıç, Citation2019) concluded that tests of normality and multicollinearity should be checked first, prior to conducting EFA and CFA to be able to choose an appropriate rotation and parameter estimation method for effective interpretation and conclusion.
3.3.3.1. Normality test
Data normality shows the shape of data distribution for the variables in the study (Hair et al., Citation2010). Skewness and kurtosis tests are considered as the two most widely used methods to measure data normality (Mishra & Mishra, Citation2019; Patel, Citation2015). The values must fall within a range of ≤ 2 and ≤5, respectively, to showcase the normal distribution of the data (Bashir & Hassan, Citation2018; Kim, Citation2013).
From the test of normality findings, all 28 items were within the skewness range of < 2, and the kurtosis range of <5. Hence, the items within the constructs were normally distributed (Bashir & Hassan, Citation2018). (See Appendix 1.)
3.3.3.2. Multicollinearity test
Following the normality tests of the data, multicollinearity is carried out to show the level to which a variable in a study is explained by others (Kline, Citation2016). The variance inflation factor (VIF), which shows the degree of variability that a variable is explained by other variables, and tolerance values, which is the opposite of VIF, are the two key measures to establish the multicollinearity assumption in a study (Hair et al., Citation2010). To ensure the non-violation of establishing the multicollinearity assumption, the VIF value should be < 10 and the tolerance value should be > 0.10 (Hair et al., Citation2010; Kline, Citation2016).
The findings, as presented in , indicate that the VIF value of 0.841 was less than 10, and the tolerance value of 1.189 exceeded 0.10. Therefore, there was non-violation of multicollinearity assumptions, making the data suitable for performing EFA, CFA and structural modelling (Hair et al., Citation2010; Kline, Citation2016; Koyuncu & Kılıç, Citation2019).
Table 4. Multi-collinearity results indicating normality
4. Results and discussion
4.1. Qualitative findings
This section presents the findings from the interviews with the six (6) senior project management practitioners that were selected through purposive sampling from four different companies within the telecommunication industry in Ghana.
To begin with, the description of the concept of “time overrun” across the cases suggests that it is regarded as the additional time used to complete the project activities after missing out on the initial finish date. With regards to specific cases, in Company A, it is seen as the additional time spent to complete the project. In Company B, it is the deviation or exceeding planned duration. In Company C, it is going beyond the delivery date. In Company D, it occurs once the delivery date is missed.
Also, the findings across the cases suggest that time overruns do sometimes occur, and its duration ranges from 3 weeks to 2 months across the industry. In Company A, a delay of 1 to 2 months varies from operator to operator. In Company B, it happens often, lasting from 3 to 5 weeks. In Company C, it sometimes lasts 1 to 2 weeks. In Company D, it can sometimes go up to 3 to 4 weeks.
In addition, the effect of time overrun found across the cases suggests that it has a financial impact for both the operator (telco) and the vendor (contractor). Similarly, it delays the project go-live date, increases project cost, team dissatisfaction sets in, and the overall repercussions are loss of revenue and value (see, ). In view of individual case’s assertions, in Company A, it causes cost and scope to change, which has a huge impact on cost and suppliers. In Company B, delays impact the expected revenue. In Company C, it increases cost. In Company D, it has a financial impact on the company.
In assessing the factors that cause time overrun during site projects, the participants across the cases operationally expressed factors differently, but some factors are similar in practical meaning across the telecommunication industry. In this regard, a Model-Cage for Time Overrun diagram was developed, as shown in , to demonstrate the similarities and differences between the identified causal factors across all the cases.
In line with this diagram, some factors were found to be unique to specific companies. Specifically, Company A distinctly outlined the late issuing of Purchase Orders (POs), too many parties involved in the project, and organisational culture. Company B also uniquely indicated poor planning, too many quality shortfalls that have to be reworked, project manager’s competency, transmission and radio frequency plan readiness, over-specification, poor site management and supervision. Company C distinctly outlined poor monitoring and control, while Company D outlined delays in seeking budget approval and delays in clearing the hardware from the port (see, ).
The study determined that there are other factors that are similar in meaning across the telecommunication industry. These factors were found in two or more different companies, and included inadequate resources, delays in site permit acquisition from the regulatory, issues of project funding, communities, landlords, as found in Companies A and B. The factors found in Companies A and D involved lack of experienced contractors, whilst internal organisational processes appeared in Companies A and C. In addition, delays from the vendor side in importing the hardware into the country, any form of labour disputes, poor communication skills and delays in preparing the sites by the tower companies appeared in Companies B and D. Further, the factors found in three different companies included: late delivery of materials and inaccurate time and cost estimate, which were identified in Companies A, B and D; while poor contract management appeared in Companies B, C and D, and poor scoping was found in Companies A, B and C (see, ).
In a nutshell, the key elements derived from the narratives on time overrun culminated in the development of the quantitative research instrument. Specifically, the 28 factors found to cause time overrun, as shown in , were further subjected to factor analysis as presented in the next section.
Table 5. Factors that cause time overruns in the cell site construction
4.2. Quantitative findings
This section presents the findings from the survey study which was performed in the qualitative phase of the study. A total of 230 questionnaires were administered online, the data response rate analysis was conducted and further subjected to data screening and missing value imputation. Additionally, tests of multivariate analysis assumptions were performed subsequent to demographic profiling and the analyses of key characteristics. The data was then subjected to factor analysis. Specifically, the study performed EFA first, followed by CFA, to assess the validity and reliability of the causal factors of time overrun in cell site construction projects.
4.2.1. Exploratory factor analysis (EFA) for time overrun causal factors
EFA is adopted when the aim of the study is to determine the ideal number of factors, and to ascertain whether strong correlations exist between the measured variables (Brown, Citation2015). The study used the Maximum Likelihood Estimate (MLE) as a method of factor analysis, since test of normality was ensured in the study. The parallel method was used in addition to the Kaiser criterion and Scree plot methods to determine the number of factors to be kept (see Appendix 2).
The use of the parallel method helped to mitigate the issues of obtaining several factors for retention with the Kaiser criterion, and avoided the confusion of interpreting cases which show quite a lot of drops and likely cut-off points. Sampling adequacy and data suitability for EFA was established with Kaiser-Meyer-Olkin (KMO) and Bartlett’s test of sphericity. Further, Promax with Kaiser Normalisation rotation method was used to reduce the number of items with high loadings to more than one factor, and to retain items with factor loadings of ≥ 0.50. The reliability test of internal consistency and content validity was analysed with Cronbach’s alpha coefficient.
The intent was to determine the initial factors that cause time overrun to occur during cell site construction projects. Extraction of the factors, assessment of sampling adequacy and reliability, as well as naming of the retained factors are presented below.
4.2.1.1. Extraction of factors
A validation check with parallel analysis (PA) loaded onto two components as against the initial Kaiser criterion (eigenvalues > 1) loading onto four components and Scree plot loading onto six (6) components based on the point of inflexion (see Appendix 2). The findings from Promax with Kaiser Normalisation rotation method revealed that the first component retained 12 items out of 28, contributing 43.347% to the variance. The second component retained 10 items, ascribing 9.655% to the variance. Both components contribute to total explained variance of 53.003 % with factor loadings greater than 0.50, which is considered as practically significant (Patel, Citation2015; see, ).
Table 6. Exploratory factor analysis for time overrun dimension
4.2.1.2. Sampling adequacy and reliability analysis
The results showed sampling adequacy with Kaiser-Meyer-Olkin (KMO) of 0.938, which is considered as “marvellous” (Sarmento & Costa, Citation2019). Bartlett’s Test of Sphericity was also significant at (χ2 (378) = 3596.604, p < 0.05). In line with factor model quality (reliability analysis), the findings indicated that 12 items on components one loaded very well, with significant loadings of 0.553 to 0.926, and Cronbach’s alpha of 0.943. Similarly, the other 10 items on component two (2) loaded quite well, with significant loadings of 0.570 to 0.957, and accompanying Cronbach’s alpha coefficient of 0.908 (see, ). Therefore, these findings present sampling adequacy and reliability, suitable for the exploratory factor analysis (Hair et al., Citation2010; Koyuncu & Kılıç, Citation2019; Patel, Citation2015; Sarmento & Costa, Citation2019).
4.2.1.3. Naming and coding of the extracted items for time overrun dimension
Further, to conduct EFA, a total of 22 out of 28 items (variables) were retained under time overrun to carry out a CFA. These variables form on two principal components and their associated defined codes are presented in . Yong and Pearce (Yong & Pearce, Citation2013) explained that although no stipulated rule governs factor naming, factors should be named with regard to that which represents them best. In view of this, factor 1 items are inclined to project planning issues and factor 2 items are much related to project control issues.
Table 7. Synopsis of retained items for time overrun
4.2.2. Confirmatory factor analysis for time overrun
Kline (Kline, Citation2016) asserted that CFA is used to test the validity of the structure obtained after EFA. In view of this, only factor loadings greater than 0.50 were further examined with CFA to achieve the purposes of the study. The confirmatory measurement model was used to evaluate the validity and reliability of the variables to test and verify how well the observed variables were related to a set of latent variables. The MLE method was used to assess the consistency of the measures and the nature of the constructs. Furthermore, the variance of each scale dimension was constrained to 1.0 and the modification index was fixed to 4.
Although a modification method was used to suggest model parameters that could be released to improve the model specification (Hair et al., Citation2010), it was not too much to spoil the structure initially planned to measure (Koyuncu & Kılıç, Citation2019).
The goodness-of-fit indices used to assess the measurement model in this study included Absolute Fit Index, Goodness of Fit Index (GFI), Incremental Fit Index (IFI), Tucker Lewis Index (TLI), Comparative Fit Index (CFI), Root Mean Square Error of Approximation (RMSEA) and Root Mean Square (RMR), as summarised in .
Table 8. Summary of model fit indices
With regards to validity and reliability, to ensure that a study can stand the test of time, it must focus on the validity and reliability of its research design (Saunders et al., Citation2012). The study, therefore, adopted the most considered validity measures used in CFA, as summarised in , and elaborated on in the subsequent discussion.
Table 9. Summary of validity and reliability analysis
4.2.2.1. Measurement model: time overrun causal factors
Upon doing EFA, a total of 22 variables forming a two-factor correlated model were further tested with CFA. The findings from the first-order measurement model showed an excellent model fit after deleting 5 out of 12 items on Factor 1, and 8 out of 10 items on Factor 2 (see, ). The retained variables were all loaded very well onto the latent variables, as shown in both and . The smaller variables retained in the factors were in line with the Item Response Theory, which states that the lesser the items, the better the measures provided (Bongomin, Citation2016). Also, modification was performed to improve the model by drawing covariance between e25 and e26 (see, ). All the factor loadings of the confirmed variables also loaded very well onto the latent variables, with values from 0.661 to 0.836 > 05.0 threshold, exhibiting construct validity, which is factorability of the items on the construct (Hair et al., Citation2010).
Figure 4. Standardised solution of the measurement model: time overrun dimension.
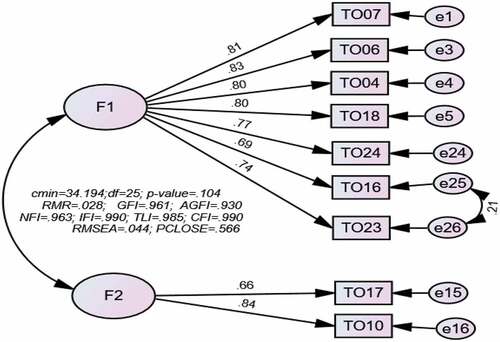
Table 10. CFA fit indices: time overrun causal factors
The goodness-of-fit indices of the final measurement model for time overrun measures were as follows: (X2 /df = 1.368; p-value = 0.104 > 0.05; GFI = 0.961; IFI = 0.990; TLI = 0.985; CFI = 0.990; RMR = 0.028 and RMSEA = 0.044). All the model fit indices met the recommended cut-off points, hence, unidimensional validity of the construct (Lopez et al., Citation2006; Ya’acob, Citation2008; see, ). The findings again showed that all the standardised parameter estimates of the initial measurement model were all significant at p = 0.000, and all the critical ratios were ≥ 2.00, supporting the unidimensionality of the construct.
Additionally, the findings showed that both convergent validity and discriminant validity were attained, as AVE values of 0.607 (Factor 1) and 0.568 (Factor) > 0.50 threshold, and CR values of 0.779 and 0.754 > 0.70 were obtained. In addition, the correlation coefficients (F1<–>F2) of 0.541 was < 0.70 threshold (Bongomin, Citation2016; Hair et al., Citation2010; Ya’acob, Citation2008).
In summary, the model fits statistics for measuring the construct and the standardised regression weight estimates provided evidence that all the retained variables were indeed factors that cause time overrun (see, ).
Table 11. Standardised regression weights: (Group number 1-Default model)
5. Conclusions and recommendation
The study aimed to holistically assess the occurrence of time overrun in cell site construction projects in the Ghanaian telecom industry. From the findings, time overrun is explained as the additional time used to complete the project activities after missing out the initial finish date. Within the telecommunication industry, time overrun occurs during cell site construction and its duration ranges from three weeks to two months. The repercussion of time overrun is that it has a financial impact for both the operator (telco) and the vendor (contractor), it prolongs the project go-live date, increases project cost, team dissatisfaction sets in, and the overall impact is loss of revenue and value.
The integrated factors found to cause time overrun in cell site construction from the EFA and CFA analysis are categorised based on the two components as (i) Project planning and (ii) Project control.
5.1. Project planning
The factors that cause time overruns that stem from project planning activities are discussed below:
Poor planning: the study found that the project management team claimed to have mastered the act of deploying cell site projects, and this familiarity seems to result in them not spending enough time on planning from end-to-end, resulting in the occurrence of time overruns. This finding confirms studies in the building industry, oil and gas industry and power construction industry that were conducted outside of Ghana (Arantes & Ferreira, Citation2020; Banobi & Jung, Citation2019; Seddeeq et al., Citation2019; Yap et al., Citation2020). However, it differs from the studies conducted in Ghana (Amoatey & Ankrah, Citation2017; Asiedu et al., Citation2017; Bentil et al., Citation2017; Famiyeh et al., Citation2017).
Labour disputes (within the project team and the community): the study revealed that the supposed health hazards associated with cell site construction cause community members to become agitated, and this prevents the project team from accessing the areas where the project takes place. This brings about disagreements between the project team at the site and the community members, which increases the project timelines and leads to time overruns. This factor was conceptualised in the literature review as a project control-related factor, but the finding indicates that it falls under project planning. Again, this finding validates the studies carried out both in and outside Ghana (Bentil et al., Citation2017; Hussain et al., Citation2018).
Late issuing of Purchase Orders (POs): the study found out the contracting mobile network operator usually goes beyond the agreed period to issue the purchase orders to the vendors to acquire the project materials. This impacts the project plan, resulting in time overruns. This finding is perceived as a new addition to the knowledge of construction project management.
Landlord’s refusal to sign a contract for leasing of the land: In Ghana, landlords are among the opinion leaders in the communities where cell site construction projects are carried out. In combination with community agitation regarding the health-related issues related to such projects, the landlords are also seen to be hesitant to lock down their pieces of land for such a long period of time because the cell site stays as long as the company remains in operation. As found in the study, in as much as the landlords want money, they are unwilling to agree to the contract terms, and such indecisiveness prolongs the commencement of the project, resulting in time overrun, which brings about value leaks. This finding is seen as a new addition to the knowledge on construction projects.
Delay in material delivery: the study revealed that all cell site equipment is imported into Ghana. The vendors usually encounter delays with shipment and clearance at the port, thereby extending the expected delivery timelines, leading to time overrun. This is consistent with the findings of some previous studies in different industries both in and outside Ghana (Abdellatif & Alshibani, Citation2019; Bentil et al., Citation2017).
Delays in preparing the sites by the tower companies: from the study, the ground construction works by the tower companies sometimes takes longer owing to the climatic conditions at the areas where the project takes place. This delay impacts the cell site’s go-live date, emanating from time overrun. This finding is seen as unique to cell site construction in the telecom industry.
Delay in seeking budget approval: the study revealed that due to the complexity of internal approval processes, the project team from the contracting company spends some time on obtaining project budget approval and the release of funds. This prolongs the project timelines agreed by both the mobile network operator and the contracting vendor, resulting in time overruns. This finding validates studies conducted by various authors in different industries outside Ghana (Banobi & Jung, Citation2019; Sambasivan et al., Citation2017).
5.2. Project control
The factors that cause time overrun that emanate from project control activities are discussed below:
Too many quality shortfalls that require rework: the study found that alterations to the project scope of work during deployment that might result from a strategic decision, climatic conditions at the site, and a poor requirement-gathering process could bring about changes in quality requirements. This necessitates rework to warrant the acceptance of the project outcome, leading to time overruns. This finding confirms the previous studies carried out in and outside Ghana in different industries (Agyekum-Mensah and Knight, Citation2017; Asiedu et al., Citation2017; Bagaya & Song, Citation2016; Banobi & Jung, Citation2019; Chen et al., Citation2019; Famiyeh et al., Citation2017; Seddeeq et al., Citation2019; Yap et al., Citation2020). Although, this factor has been expressed semantically differently in the previous studies, for example, as changes in work order, and scope changes, they share a common practical meaning.
Inadequate project resources: the study revealed that during cell site construction projects, it may happen that some individuals who have been assigned to the project are reassigned to other projects, reducing the project resources. This increases the man-hours to complete the project activities by the rest of the resources, resulting in time overruns. This finding is perceived as a new addition to the knowledge of cell site construction projects in the telecom industry.
5.3. Recommendations
In line with the causal factors presented above, the study, therefore, makes the following recommendations to minimise the occurrence of time overruns in the cell site construction projects:
Firstly, this study advocates that project management practitioners ought to reorient their mindset regarding the principles of project management through refresher training. From the study, it became evident that these practitioners hastened to attribute every action relating to cell site construction to their level of experience under the notion that they have mastered the act of project implementation. It is apparent that the time overruns that occur during cell site construction projects result in revenue loss, therefore, the continuous undertaking of cell site projects should rather eliminate the occurrence of overruns through the consideration of the identified causal factors.
In addition, the key contributing factors that cause the occurrence of time overruns during cell site construction are found to be associated with poor project management practices, mainly poorly managed project planning and project control. In view of this, the project management practitioners must adhere to the project management methodology of ensuring proper project planning from end-to-end, and executing the planned activities to the letter, during which these activities must be closely monitored and controlled. The focus on these identified causal factors could go a long way in minimising the likelihood of the occurrence of time overruns during the cell site construction.
Also, the complexity of cell site construction projects and the misconceptions surrounding it could clearly be explained in the form of engagement with the landlords, opinion leaders and the community members through corporate social responsibility (CSR) activities. As found by the study, there is a high illiteracy rate among these groups of people, so embarking on community engagement in the form of CSR provides the contracting company with the opportunity to educate the community on any misconceptions related to the cell site project, whilst also giving back to the community in the form of developmental and social intervention activities.
In a nutshell, the findings from the study would enlighten the perspective of project management practitioners in their quest to deliver cell site construction projects. Again, both scholars and industry players can use this research methodology that has been designed to aid and facilitate the conduct of any such study in any industry in future. Nonetheless, this study focuses solely on cell site construction within the context of the telecommunication industry in Ghana. This limits the generalisability of the findings to telecommunication projects as a whole. Future studies can replicate this study in different countries’ telecommunication sectors and compare the findings.
Acknowledgements
The authors express appreciation to all the project management practitioners in the Ghanaian telecommunication industry for taking time to attend the long interviews and answer the questionnaires in spite of their busy schedules.
Disclosure statement
No potential conflict of interest was reported by the author(s).
Additional information
Funding
References
- Abdellatif, H., & Alshibani, A. (2019). Major factors causing delay in the delivery of manufacturing and building projects in Saudi Arabi. Buildings, 9(4), 93. https://doi.org/10.3390/buildings9040093
- Agyekum-Mensah, G., & Knight, A. D. (2017). The professionals’ perspective on the causes of project delay in the construction industry. Engineering, Construction and Architectural Management, 24(5), 828–27. https://doi.org/10.1108/ECAM-03-2016-0085
- Al Zadjali, Z. A., Bashir, H. A., & Maqrashi, A. A. (2014). Factors causing project cost overrun in the telecommunications industry in Oman. International Journal of Information Technology Project Management, 5(3), 84–95. https://doi.org/10.4018/ijitpm.2014070105
- Alaloul, W. S., Liew, M. S., Zawawi, N. A. W., Mohammed, B. S., Adamu, M., & Musharat, M. A. (2020). Structural equation modelling of construction project performance based on coordination factors. Cogent Engineering, 7(1), 1726069. https://doi.org/10.1080/23311916.2020.1726069
- Alfakhri, A. Y., Ismail, A., Khoiry, M. A., Arhad, I., & Irtema, H. I. M. (2017). A conceptual model of delay factors affecting road construction projects in Libya. Journal of Engineering Science and Technology, 12(12), 3286–3298. https://docplayer.net/87398979-A-conceptual-model-of-delay-factors-affecting-road-construction-projects-in-libya.html
- Ameh, O. J., Soyingbe, A. A., & Odusami, K. T. (2010). Significant factors causing cost overruns in telecommunication projects in Nigeria. Journal Construction Dev. Country, 15(2), 49–67. http://eprints.usm.my/42195/1/JCDC_15(2)_2010-ART_3_corrected_(49-67)_21.12.2010.pdf
- Amoatey, C. T., & Ankrah, A. N. O. (2017). Exploring critical road project delay factors in Ghana. Journal of Facilities Management, 15(2), 110–127. https://doi.org/10.1108/JFM-09-2016-0036
- Arantes, A., & Ferreira, L. M. D. F. (2020). Underlying causes and mitigation measures of delays in construction projects: An empirical study. Journal of Financial Management of Property and Construction, 25(2), 165–181. https://doi.org/10.1108/JFMPC-03-2019-0029
- Arditi, D., Nayak, S., & Damci, A. (2017). Effect of organisational culture on delay in construction. International Journal of Project Management, 35(2), 136–147. https://doi.org/10.1016/j.ijproman.2016.10.018
- Asiedu, R. O., Adaku, E., & Owusu-Manu, D.-G. (2017). Beyond the causes: Rethinking mitigating measures to avert cost and time overruns in construction projects. Construction Innovation, 17(3), 363–380. https://doi.org/10.1108/CI-01-2016-0003
- Aziz, R. F., & Abdel-Hakam, A. A. (2016). Exploring delay causes of road construction projects in Egypt. Alexandria Engineering Journal, 55(2), 1515–1539. https://doi.org/10.1016/j.aej.2016.03.006
- Bagaya, O., & Song, J. (2016). Empirical study of factors influencing schedule delays of public construction projects in Burkina Faso. Journal of Management in Engineering, 32(5), 05016014. https://doi.org/10.1061/(ASCE)ME.1943-5479.0000443
- Balashova, E. S., & Gromova, E. A. (2017). Agile project management in telecommunications industry. Revista Espacios, 38(41), 30. https://www.revistaespacios.com/a17v38n41/a17v38n41p30.pdf
- Banobi, E. T., & Jung, W. (2019). Causes and mitigation strategies of delay in power construction projects: Gaps between owners and contractors in successful and unsuccessful projects. Sustainability, 11(21), 5973. https://doi.org/10.3390/su11215973
- Bashir, K., & Hassan, S. S. S. (2018). A predictive study on instructional design quality, learner satisfaction and continuance learning intention with E-learning courses: Data screening and preliminary analysis. Interdisciplinary Journal of Education, 1(2), 122–137. Islamic University in Uganda. https://doi.org/10.53449/ije.v1i2.59
- Bentil, E., Nana-Addy, E., Asare, E. K., & Fokuo-Kusi, A. (2017). The level of existence and impact of cost and time overruns of building construction projects in Ghana. Civil and Environmental Research, 9(2017), 36–46. emanticscholar.org/paper/The-Level-of-Existence-and-Impact-of-Cost-and-Time-Bentil-Nana-Addy/142c5a624ad9eb4691d07330b1e545d13752e9be?sort=relevance&citationIntent=background
- Bongomin, G. C. O. (2016). Financial inclusion of the poor in Uganda. [Unpublished Doctoral thesis]. Makerere University.
- Brown, T. A. (2015). Confirmatory factor analysis for applied research (2nd ed.), The Guilford Press.
- Bryman, A. (2004). Social research methods (2nd ed.). Oxford University Press.
- Caruth, G. D. (2013). Demystifying mixed methods research design: A review of the literature. Mevlana International Journal of Education, 3(2), 112–122. https://doi.org/10.13054/mije.13.35.3.2
- Chen, G.-X., Shan, M., Chan, A. P., Liu, X., & Zhao, Y.-Q. (2019). Investigating the causes of delay in grain bin construction projects: The case of China. International Journal of Construction Management, 19(1), 1–14. https://doi.org/10.1080/15623599.2017.1354514
- Chenail, R. (2012). Conducting qualitative data analysis: Qualitative data analysis as a metaphoric process. Qualitative Report, 17(1), 248–253. https://doi.org/10.46743/2160-3715/2012.1818
- Creswell, J. W. (2002). Educational research: Planning, conducting, and evaluating qualitative and quantitative research. Pearson Education.
- Creswell, J. W. (2014). Research design: Qualitative, quantitative and mixed methods approaches (4th ed.), Sage Publications Ltd.
- Creswell, J. W., & Plano Clark, V. L. (2011). Designing and conducting mixed methods research (2nd ed.). Sage Publications.
- Durdyev, S., & Hosseini, M. R. (2019). Causes of delays on construction projects: A comprehensive list. International Journal of Managing Projects in Business, 13(1), 20–46. https://doi.org/10.1108/IJMPB-09-2018-0178
- Eisenhardt, K. M. (1989). Building theories from case study research. The Academy of Management Review, 14(4), 532–550. https://doi.org/10.2307/258557
- Famiyeh, S., Amoatey, C., Adaku, E., & Agbenohevi, C. S. (2017). Major causes of construction time and cost overruns: A case of selected educational sector projects in Ghana. Journal of Engineering, Design and Technology, 15(2), 181–198. https://doi.org/10.1108/JEDT-11-2015-0075
- Fornell, C., & Larcker, D. F. (1981). Evaluating structural equation models with unobservable variables and measurement error. Journal of Marketing Research, 18(1), 39–50. https://doi.org/10.1177/002224378101800104
- GCT (Ghana Chamber of Telecommunications). (2020). Focus on output tax instead of industry specific taxes-chamber of telecommunication tells government. Retrieved March 21, 2020, from https://www.telecomschamber.com/news-media/industry-news/focus-on-output-tax-instead-of-industry-specific-taxes-Chamber-of-telecommunications-tells-government
- GNA (Ghana News Agency). (2017, June 30). MTN to invest 143.7 million in network expansion in 2017. Ghana News Agency, Retrieved April 13, 2019, from https://www.modernghana.com/news/785461/mtn-to-invest-1437-million-in-network-expansion-in-2017.html
- Guest, G., MacQueen, K. M., & Namey, E. E. (2012). Applied thematic analysis. Sage.
- Hair, J. F., Anderson, R. E., Tatham, R. L., & Black, W. C. (2010). Multivariate data analysis (8th ed.), Prentice Hall.
- Hooper, D., Coughlan, J., & Mullen, M. R. (2008). Structural equation modeling: Guidelines for determining model fit. Electronic Journal on Business Research Methods 6, 53–60. https://doi.org/10.21427/D7CF7R
- Hu, L. T., & Bentler, P. M. (1999). Cut-off criteria for fit indexes in covariance structure analysis: Conventional criteria versus new alternatives. Structural Equation Modeling: A Multidisciplinary Journal, 6(1), 1–55. https://doi.org/10.1080/10705519909540118
- Hussain, S., Zhu, F., Ali, Z., Aslam, H. D., & Hussain, A. (2018). Critical delaying factors: Public sector building projects in Gilgit-Baltistan, Pakistan. Building, 8(1), 6. https://doi.org/10.3390/buildings8010006
- Khair, K., Mohamed, Z., Mohammad, R., Farouk, H., & Ahmed, M. E. (2018). A management framework to reduce delays in road construction projects in Sudan. Arabian Journal for Science and Engineering, 43(4), 1925–1940. https://doi.org/10.1007/s13369-017-2806-6
- Kim, H. Y. (2013). Statistical notes for clinical researchers: Assessing normal distribution (2) using skewness and kurtosis. Research Dental End, 38(1), 52–54. https://doi.org/10.5395/rde.2013.38.1.52
- Kim, S.-Y., Tuan, K. N., & Luu, V. T. (2016). Delay factor analysis for hospital projects in Vietnam. KSCE Journal of Civil Engineering, 20(2), 519–529. https://doi.org/10.1007/s12205-015-0316-1
- Kline, R. B. (2011). Principles and practice of structural equation modeling. Guilford Press.
- Kline, R. B. (2016). Principle and practice of structural equation modelling (4th ed.), The Guilford Press.
- Koyuncu, I., & Kılıç, A. (2019). The use of exploratory and confirmatory factor analyses: A document analysis. Educational and Science, 44(198), 361–388. https://doi.org/10.15390/EB.2019.7665
- Lopez, S. P., Peon, J. M. M., & Ordas, C. J. V. (2006). Human resource management as a determining factor in organisational learning. Management Learning, 37(2), 215–239. https://doi.org/10.1177/1350507606063443
- Marsh, H. W., & Hau, K. T. (1996). Assessing goodness of fit: Is parsimony always desirable? The Journal of Experimental Education, 64(4), 364–390. https://doi.org/10.1080/00220973.1996.10806604
- Miles, M. B., Huberman, A. M., & Saldana, J. (2014). Qualitative data analysis: A sourcebook of new methods (3rd ed.). Sage Publications.
- Mishra, R., & Mishra, O. N. (2019). Factor influencing flexibility in new product development: Empirical evidence from Indian manufacturing firms. Journal of Business & Industrial Marketing, 34(5), 1005–1015. https://doi.org/10.1108/JBIM-06-2018-0186
- National Communications Authority. (2019). Licenses and Authorisations. Retrieved October 31, 2019 from, www.nca.org.gh/industrydata/LicensesandAuthorisations
- Novak, J., & Cañas, A. (2006). The theory underlying concept maps and how to construct them. Technical Report IHMC CmapTools. Florida Institute for Human and Machine Cognition. Retrieved April 11, 2018, from http://cmap.ihmc.us/Publications/ResearchPapers/TheoryUnderlyingConceptMaps.pdf
- Ofori, D. F. (2013). Project management practices and critical success factors-A development country perspective. International Journal of Business and Management, 8(21), 21. https://doi.org/10.5539/ijbm.v8n21p14
- Osei-Owusu, A., & Henten, A. (2017). Network tower sharing and telecom infrastructure diffusion in Ghana - a structure-conduct-performance approach. 14th International Telecommunications Society (ITS) Asia-Pacific Regional Conference: “Mapping ICT into Transformation for the Next Information Society”, Kyoto, Japan, International Telecommunications Society (ITS), Calgary, 24-27 June 2017.
- Patel, V. (2015). Exploratory factor analysis: Using SPSS. National Level Two Week Faculty Development Programme on Advanced Data Analysis for Business Research Using Statistical Packages At: Gujarat Technological UniversityAnalysis for Business Research Using Statistical Packages organized by GTU during June 22-July 5, 2015. Retrieved March 23, 2019, from https://www.researchgate.net/publication/303685086_EXPLORATORY_FACTOR_ANALYSIS_USING_SPSS
- PMI. (2017). PMBoK guide: A guide to the project management body of knowledge (6th ed.), Project Management Institute.
- Rosseni, D. (2014). Construction & modeling of teaching systems. Universiti Kebangsaan Malaysia Publishers.
- Rossman, G., & Rallis, S. F. (2012). Learning in the field: An introduction to qualitative research (3rd ed.). Sage Publications.
- Sambasivan, M., Deepak, T., Salim, A. N., & Ponniah, V. (2017). Analysis of delays in Tanzanian construction industry: Transaction cost economics (TCE) and structural equation modelling (SEM) approach. Engineering, Construction and Architectural Management, 24(2), 308–325. https://doi.org/10.1108/ECAM-09-2015-0145
- Sarmento, R. P., & Costa, V. (2019). An overview of statistical data analysis. Retrieved February 14, 2020, from https://arxiv.org/pdf/1908.07390.pdf
- Saunders, M., Lewis, P., & Thornhill, A. (2012). Research methods for business students (6th ed.). Pearson Education Limited.
- Seddeeq, A. B., Assaf, S., Abdallah, A., & Hassanain, M. A. (2019). Time and cost overrun in the Saudi Arabian oil and gas construction industry. Buildings, 9(2), 41. https://doi.org/10.3390/buildings9020041
- Sekaran, U. (2003). Research methods for business (4th ed.), John Wiley & Sons.
- Sweis, G. J., Sweis, R., Rumman, M. A., Hussein, R. A., & Dahiyat, S. E. (2013). Cost overruns in public construction projects: The case of Jordan. Journal of American Science, 9(7), 134–141.
- Wang, T.-K., Ford, D. N., Chong, H.-Y., & Zhang, W. (2018). Causes of delays in the construction phase of Chinese building projects. Engineering, Construction and Architectural Management, 25(11), 1534–1551. https://doi.org/10.1108/ECAM-10-2016-0227
- Ya’acob, Z. A. (2008). Structural relationship between total quality management, strategic control systems and performance of Malaysian local governments. [Unpublished Doctoral thesis]. Universiti Utara Malaysia.
- Yap, J. B. H., Woon, Y. B., Skitmore, M., & Skitmore, M. (2020). Revisiting critical delay factors for construction: Analysing projects in Malaysia. Alexandria Engineering Journal, 60(1), 1717–1729. https://doi.org/10.1016/j.aej.2020.11.021
- Yong, A. G., & Pearce, S. (2013). A beginner’s guide to factor analysis : Focusing on exploratory factor analysis. Tut Quantitative M. Psychology, 9(2), 79–94. https://doi.org/10.20982/tqmp.09.2.p079
Appendix 1.Multi-collinearity results indicating normality
Appendix 2. Exploratory factor analysis for time overrun dimension (findings from Kaiser criterion, Scree plot and Parallel analysis)

Run MATRIX procedure:
PARALLEL ANALYSIS:
Principal Components & Random Normal Data Generation
Specifications for this Run:
Ncases 187
Nvars 27
Ndatsets 1000
Percent 95
Raw Data Eigenvalues, & Mean & Percentile Random Data Eigenvalues
Root Raw Data Means Prcntyle
1.000000 12.181142 1.779934 1.897839
2.000000 3.006745 1.654938 1.742712
3.000000 1.287344 1.564203 1.637457
4.000000 1.035820 1.485816 1.548634
5.000000 .932380 1.416726 1.477565
6.000000 .736109 1.352680 1.401978
7.000000 .665653 1.293100 1.341896
8.000000 .634631 1.239733 1.283756
9.000000 .623439 1.187223 1.230078
10.000000 .566787 1.138056 1.181482
11.000000 .518071 1.090091 1.130619
12.000000 .476596 1.045079 1.084047
13.000000 .453751 .999597 1.034862
14.000000 .429070 .957564 .994153
15.000000 .409338 .914480 .952503
16.000000 .391040 .874083 .910926
17.000000 .349017 .833531 .871605
18.000000 .313183 .795035 .832821
19.000000 .297486 .754891 .790023
20.000000 .287319 .716599 .753367
21.000000 .265642 .678948 .714908
22.000000 .249206 .640850 .677067
23.000000 .219138 .601961 .639111
24.000000 .209954 .562076 .599890
25.000000 .188143 .520757 .561050
26.000000 .156640 .477118 .518407
27.000000 .116357 .424931 .472414
——END MATRIX—–