
 ?Mathematical formulae have been encoded as MathML and are displayed in this HTML version using MathJax in order to improve their display. Uncheck the box to turn MathJax off. This feature requires Javascript. Click on a formula to zoom.
Abstract
Solar energy is one of the renewable energy sources that can be used to solve Ethiopia’s current energy problems. However, global solar radiation data for the country are either not available at all levels or recorded for only a few years at some locations. In this study, monthly mean daily global solar radiation (H) over the horizontal surface at 15 sites in Ethiopia was calculated using sunshine hour-based models, such as the Angstrom-Prescott model (AP), the Louche model (LO), and the Glover-McCulloch Estimation Model (GM). For the performance of the proposed model, statistical error analysis and geospatial results were performed to ensure the validity of the model used. The validation results show that the H estimates from all stations agree well with the measured data from all models. Therefore, the proposed model can be used to predict global solar radiance. However, among the other models, the GM model performed the best H estimates for all sites, with an average r of 0.9574, an average RMSE of 0.6017, an average MPE of 0.00335, and an average MBE of −0.7555, respectively. Therefore, the GM model is suitable for estimating global insolation for the entire country. The highest measured solar radiation value (from NASA) was recorded in February (6.89 kWh/m2/day). Likewise, the highest estimated global solar irradiance in February was observed using the three empirical models, with values of 7.55, 7.12, and 7.47 kWh/m2/day for the AP, LO, and GM models, respectively. The lowest measured and calculated radiation values were recorded in July due to the country’s highest cloud cover and rainy season. The results also show that the estimated H in Ethiopia ranges from 3.45 6.89 kWh/m2/day (July) to 7.47 6.89 kWh/m2/day (February) based on the GM model calculations, with an annual average of 5.83 kWh/m2/day (average across all sites). This study can be utilized in the design, analysis and performance evaluation of solar energy potential, which is gaining significant attention from the Ethiopian government in the advocacy of a green economy and reducing greenhouse gas emissions as one of its political agendas to meet the Sustainable Development Goal (SDG).
1. Introduction
Despite the abundance of renewable energy sources, Ethiopia relies heavily on biomass to meet its energy needs. Reliance on Ethiopia’s energy on biomass has been resulted in deforestation and land degradation. The main electricity generation in Ethiopia is mainly produced from hydroelectric power plants and engine-driven generators. The country has around 4.3 GW of installed power generation capacity, of which 3,810 MW is in the form of hydro installations, 324 MW wind, 7 MW geothermal, and 143 MW of diesel (EEP, Citation2018). Moreover, fossil fuel has also been considered and utilized as the main source of energy in Ethiopia. However, the negative impacts of burning fossil fuels on the environment have forced the energy research continuity to seriously consider renewable energy resources. So harnessing renewable energy resources has increased due to the growing shortage of conventional fuels and the adverse ecological and environmental impacts associated with their excessive use (Garg et al., Citation1996). Since the population is growing rapidly, the electricity generated is not only inequitably distributed but also insufficient to meet the economic needs of the rural and urban populations. Therefore, the demand for accessing electricity is pumping up and is likely to increase faster than ever (EEPCo, Citation2014).
In Ethiopia, among many available renewable energy resources, harnessing solar energy is the high importance to increase energy production in the country and play a significant role in economic growth as well as in social welfare. Also using solar energy has an important effect on reducing land degradation by overwhelming deforestation caused by the direct combustion of biomass to get energy in rural areas. The provision of clean energy to human beings using alternative renewable energy sources contributes to achieving Sustainable Development Goals (SDG 7). Solar PV is among the renewable energy sources, which is appropriate for the implementation of SDG. Solar power has played a significant role in environmental, social and economic benefits. This could be accelerated our trajectory toward SDGs. Therefore, PV’s can provides not only climate objectives but also deliver advantages in terms of employment, health, education, gender equality, and poverty alleviation. These are the objectives of SDGs that need to work together by the stakeholders.
One of the areas of application for solar PV in Ethiopia is providing electricity to rural communities since the agro-climatic conditions of Ethiopia is suitable for the production of solar energy. This resource needs to convert into electricity for the rural community by using PV systems. Currently, the Ethiopian government promote a ten-year strategic plan, which encourages green development by adapting local green growth economic development plan. Therefore, alternative energy sources, such as solar energy, are the main alternative option and political agenda for the government of Ethiopia to supply electricity rather dependent on fossil fuels provision.
Most of the locations in Ethiopia regions receive abundant solar radiation, and solar energy utilization technology can be profitably applied to different regions. Despite the potential for solar energy, the insufficient availability of solar radiation information at different locations hinders the design and efficient use of solar energy conversion devices. Knowing the monthly mean of daily global solar radiation on the horizontal surface (H) is critical for designing solar energy systems. Global solar radiation is essential in a variety of applications, including meteorology and hydrology (Almorox et al., Citation2013; Jiang et al., Citation2021). Changes in the quantity of H have a significant impact on the hydrological cycle, terrestrial ecological systems, and climate. Complete and accurate H data for a given location is critical for regional crop growth modelling, evapotranspiration calculation, irrigation system construction, and solar energy resource usage. Mostly, the values of solar radiation help to get very precise information on the performance of solar energy systems (Gopinathan, Citation1992).
Installing measurement devices like pyranometers or pyrheliometers at each specific place is the best way to determine the amount of H at any site. Monitoring their daily recording and maintenance, on the other hand, is a time-consuming and costly task, especially in developing countries like Ethiopia (Besharat et al., Citation2013; Katiyar & Pandey, Citation2010). In addition, due to the high cost of instruments, technical equipment, and maintenance, accurate H data measurement is limited in many developing countries (Besharat et al., Citation2013). Only less than five of Ethiopia’s 90 national meteorological stations have H observation devices at the moment. Furthermore, even for those stations where H is observed, many H data are missing or lie outside the expected range due to equipment failure and other issues. As a result, several H models have been developed for predicting daily or monthly H using various methodologies, including geostationary satellite images (Velasco & Salbidegoitia, Citation2019), neural networks (Jiang et al., Citation2020, Citation2019; Karaman et al., Citation2021; Piri & Kisi, Citation2015), time-series methods (Alsharif et al., Citation2019), and stochastic weather methods (Zhang et al., Citation2018), all of which were based on various types of data, including meteorological and geographical data. Sunshine and temperature-based models are the most widely studied and employed models all around the world.
The basic sunshine model, which uses sunshine duration and clear sky radiation data to predict H, may be traced back to Angstrom (Angstrom, Citation1924). Prescott substituted clear sky radiation with extraterrestrial radiation, and he proposed the Angstrom-Prescott (AP) model (Prescott, Citation1940). The linear, quadratic, cubic, logarithmic, and exponential models were compared to estimate H on horizontal surfaces at four meteorological stations in Tunisia, and the statistical results indicated that the models were considered suited to accurately estimate H, with the cubic model showing the best regression fit and performing slightly better than the others (Chelbi et al., Citation2015). Sekhar et al. (Sekhar et al., Citation2012) have discovered new correlations for estimating H for seven distinct geographical regions in the Indian state of Andhra Pradesh. They developed regression equations for linear and quadratic models using meteorological data such as latitude and altitude, maximum and minimum temperature, and relative humidity, and statistical tests revealed that the quadratic model had a lower error deviation between measured and calculated solar radiation values.
Al-Ghezi et al. (Al-Ghezi, Mahmoud et al., Citation2022) examined four linear regression models (two single and two polynomials) to calculate monthly averages of daily global horizontal solar radiance in the Iraqi capital. According to their statistical test results, a single linear regression model was the most accurate in calculating global solar irradiance for Baghdad city. Dolga et al. (Doorga et al., Citation2019) also examined 11 regression models using 29 years of meteorological data from 15 sites on the island of Mauritius, divided into three categories: sunshine hours-based, temperature-based, and mixed-parameter-based. According to the results of their statistical tests, the improved Sayigh’s general formula outperforms for Mauritius. Nwokolo and Ogbulezie reviewed the relevant literature to identify the input parameters and functional forms used so far and recognized their importance for GSR estimation in several places (Nwokolo & Ogbulezie, Citation2018). They also recognized the need for a soft-computation approach, which holds particular promise as an alternative for estimating GSR with high accuracy in West Africa. Koussa et al. (Koussa et al., Citation2009) examined several statistical models to estimate global and diffuse solar radiation for three Algerian cities. The authors advocate the development of models for calculating solar radiation in other Algerian cities that do not have weather stations that provide solar radiation data.
Argaw (Citation1996) also utilized a basic Angstrom equation to estimate H in nine Ethiopian sites and used the least square approach to assess the model’s validity. The results suggest that the Angstrom equation is valid for Ethiopian locations (Argaw, Citation1996). Zhang et al. (Zhang et al., Citation2018) compared the accuracy and application of nine sunshine-based models and three temperature-based models for estimating daily H in 21 Chinese meteorological stations, finding that the sunshine-based models were more accurate than the temperature-based models. Statistical tests may be used to assess the accuracy of sunshine-based models in general (Argaw, Citation1996; Zhang et al., Citation2018). By converting solar energy into electricity, photovoltaic (PV) panels are expected to be the most important system for meeting global energy needs. The main impediment to widespread deployment of PV systems is their low efficiency, which is greatly influenced by solar radiation, operating temperature, and other weather conditions. To determine the optimal size of the system and avoid project financial risks, complete knowledge of the performance, efficiency, and output power of photovoltaic modules, as well as the extent to which they change with fluctuations in weather information such as solar radiation, temperature, humidity, and others, is required (Al-Ghezi, Ahmed et al., Citation2022; Yousif et al., Citation2019).
Ethiopia is an agricultural country, and solar energy applications in agriculture play a key role in agricultural clean production, green energy, and emissions reduction. As a result, accurate prediction of H is critical for the functioning of solar-powered pumping stations and solar irrigation systems, as well as lift irrigated projects and crop yield potential in Ethiopia. Due to the lack of observation stations and meteorological stations in non-radiation observation areas, it is especially important for developing and harnessing solar energy resources. The goal of the current study is to use regression equations found in the literature to model Ethiopia’s global solar radiation in an attempt to give solar farm operators and other relevant stakeholders a useful and effective way to estimate the parameter of interest. Geospatial data and statistical analyses can both be used to cross-check the accuracy of the empirical models. The novelty of this paper is that it investigates various insolation models from three different sunshine-based models, namely the Angstrom-Prescott (AP) model, the Louche model (LO), and the Glover-McCulloch model (GM), in an attempt to acclimatize them to the region of Ethiopia for accurate global solar radiation prediction on a temporal scale. The global solar radiation calculated by each of the three empirical models was compared to the global solar radiation values measured by geospatial data and NASA, and the results were generally consistent. Statistical error indicators, such as mean bias error (MBE), root mean square error (RMSE), mean percentage error (MPE) and the coefficient of correlation (r) were calculated to enhance the reliability of the results obtained by all of the models. A GM model is proposed to accurately estimate Ethiopia’s global solar radiation.
2. Methods and materials
2.1. Study area
Ethiopia is located in the horn of Africa, between 38° and 15° N latitude and 33° and 48° E longitude. The area coverage is about 1,127,127 sq km of which 99.34% and 0.66% are covered by land and water, respectively. The terrain is mainly a high plateau with mountain ranges divided by the Great Rift Valley. The elevation generally ranges between 1,500 and 3,000 m above sea level with extremities of 125 m below sea level in the Denakil depression and 4,620 m above sea level at Ras Dashen (see, ), the third-largest mountain in Africa. Its climate is very diversified ranging from a semi-arid desert type in the lowlands to a humid and warm (temperate) type in the south-west. The mean annual rainfall distribution also varies depending on the region; it exceeds 2000 mm over the South-western highlands and below 300 mm over the south-eastern and North-eastern lowlands (Bekele & Palm, Citation2009). shows the map of 15 meteorological sites in different cities of Ethiopia.
Figure 1. Locations of meteorological sites in different cities of Ethiopia.
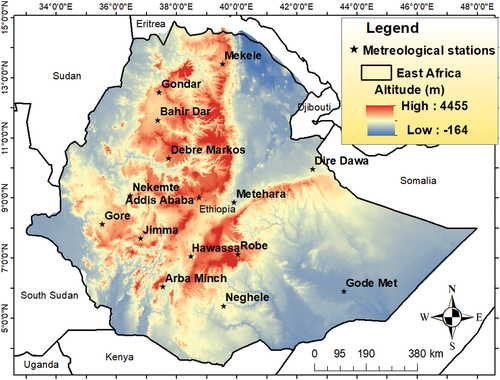
The geographical location of stations and the sources of data are presented in . The data is obtained from the National Meteorological Agency of Ethiopia (NMA) and covered the years from 2006 to 2018 for most of the stations (see, ).
Table 1. Geographical location of the 15 meteorological locations
A comparative analysis of similar studies conducted in Ethiopia and other countries using different models was performed to confirm the findings of this study and to give stakeholders a global perspective. summarizes the important literature on solar radiation estimation using various models and empirical correlations for locations where data is not directly observed.
Table 2. Review of selected similar studies
2.2. Estimations of Solar Radiations using Sunshine-based models
To determine the potential of solar energy generation for a particular site in Ethiopia, it is important to assess the average total solar radiation received over the year. Therefore, monthly average daily global solar radiation and hence solar energy generating potential in Ethiopia can be estimated from sunshine duration data using the empirical equation. Mathematical models can incorporate the available sunshine hour data and provide the required solar radiation data and are used to determine the potential of solar energy at different locations. In this research, the measured global solar radiation data was obtained from NASA (NASA, Citation2020).
According to the World Meteorological Organization (WMO), the sunshine duration is defined as the period during which the direct solar radiation exceeds a threshold value of 120 W/m2-day or 2.88 kWh/m2-day (WMO, Citation2003). Solar radiation and sunshine duration for a certain period have direct proportionality. Different regression models describing solar radiation and sunshine hours are presented in different kinds of literature; including linear, Logarithmic, Exponential and Power models (Yorukoglu & Celik, Citation2006). The mathematical models proposed for use can be developed by determining the monthly rate of daily radiation on a horizontal surface outside the planet (extraterrestrial radiation), as shown in EquationEquation (1(1)
(1) ; Duffie & Beckman, Citation1991; Prescott, Citation1940; Zhang et al., Citation2018):
Where: nd is the day number of the year (Julian day), ranging from 1 on 1 January to 365 on 31 December, Gsc is the solar constant (1368 W/m2; Duffie & Beckman, Citation1991; Twidell & Weir, Citation2006), is the latitude of the location (degree),
is the sunset hour angle (degree) and
is the declination angle (degree). This declination angle
is the angle at solar noon between the sun and the equator, referenced as north positive and can be approximated for a specific Julian day nd as:
The sunset hour angle is the solar hour angle corresponding to the time when the sun sets and it is given by:
Linear regression correlations of the Angstrom–Prescott (AP), Louche model (LO), and Glover-McCulloch (GM) models have widely used correlations for the prediction of the monthly mean daily global radiation on a horizontal surface from records of the sunshine hour (Duffie & Beckman, Citation1991; Prescott, Citation1940; Zhang et al., Citation2018). In comparison to other empirical models, they were chosen because of their high prediction power and low input requirements for predicting monthly average global solar radiation. The Angstrom-Prescott (AP) method is given by the following expression:
Where, a and b are regression coefficients, is monthly average daily hours of bright sunshine,
is the monthly average of the maximum possible daily hours of bright sunshine and
(in (kW/m2)) is monthly average daily extraterrestrial radiation on a horizontal surface outside the earth’s atmosphere.
Louche (LO) et al. (Louche et al., Citation1991) have modified the AP model through the use of the ratio of instead of
; the equation is given by:
Where:
Glover and McCulloch (GW; Glover & Mcculloch, Citation1957) suggested the following model, which took into account the effect of the latitude of the site as an additional input and was valid for
:
The day length,, is the monthly average of the maximum possible daily sunshine hour is given by:
As climatic conditions change from location to location; then, the correlation for every climatic region must be established. At present, there is no correlation between global radiation as a function of sunshine hours existing for the study areas. The present study is aimed to estimate such correlation parameters for each station of the study areas. These correction parameters (regression constants) a and b are given (Benti & Tadesse, Citation2017)
2.3. Statistical tests of the models
There are many parameters which deal with the assessment and comparison of monthly average daily solar radiation estimation models. Here, the statistical parameters like the mean bias error (MBE) and the root mean square error (RMSE) helps to calculate the error or the deviation of the calculated value from the measured value. Mean percentage error (MPE) and the coefficient of correlation (r) tests the linear relationship between calculated and measured values. The best result is when these statistics are closer to zero, but the coefficient of correlation, r, should approach 1 as closely as possible for better modelling (; Anis et al., Citation2019; Ben Jemaa et al., Citation2013; Tog & Toğrul, Citation2002; Yao et al., Citation2015; Yorukoglu & Celik, Citation2006; Zang et al., Citation2012).
Table 3. A summary of statistical parameters RMSE, MBE and MPE for the evaluation of the model performance (Anis et al., Citation2019; Ben Jemaa et al., Citation2013; Tog & Toğrul, Citation2002; Yao et al., Citation2015; Yorukoglu & Celik, Citation2006; Zang et al., Citation2012)
2.4. Geospatial data of global solar radiation for validation
The validation was demonstrated that the study area model’s reliable performance by comparing it to the Solargis global model. The validation was performed using local measured data, while the global data was obtained from the Solargis model output, which was generated by the World Bank. This has the potential to reduce the uncertainty of solar energy, particularly in tropical climates. The validation data were professional ground measurements of stations in various parts of Ethiopia, as well as global solar measurements data obtained from the World Bank (https://globalsolaratlas.info/solar-measurement, n.d.), which were measured in various countries around the world. The World Bank’s global data (solargis solar radiation data) is the best available and scientifically proven. The recent most updated data of GIS and map of the Global horizontal Solar irradiation potential for Ethiopia have been downloaded from Global Solar Atlas version 2.0 (Global Solar Atlas Version 2.0, Citation2020), which have been prepared by using Solargis. The GIS data of solar resources are provided in the form of raster (gridded) data in the formats of GeoTIFF and AAIGRID, which contains the temporal layers of Global Horizontal Irradiation (GHI) data. The Data layers are projected in a geographic spatial reference (EPSG: 4326) and it has been converted into our study area condition of UTM WGS_1984. The resolution (pixel size) of GHI data is 9 arcsec (250 m).
3. Results and discussion
3.1. Solar energy potential assessment
The monthly mean daily solar radiations of the stations are estimated with sunshine hours using AP, LO and GM models using the equations stated in (1)—(9). The solar declination angle for each day in every location was calculated by using Equationequation (5)(5)
(5) . The sunshine hour angle was also calculated for each day using Equationequation (6)
(6)
(6) . Correspondingly, the monthly average maximum possible daily sunshine hour
was calculated from Equationequation (7)
(7)
(7) . The monthly average daily extraterrestrial radiation
was calculated from Equationequation (4)
(4)
(4) .
The regression coefficients, a and b were calculated from the correlation equations presented in Equationequations (8)(8)
(8) and (Equation9
(9)
(9) ), respectively. The monthly average daily solar radiation
for each location was estimated by using Equationequations (1)
(1)
(1) -(Equation3
(3)
(3) ). The results are given in .
Table 4. The regression constants (a and b), and correlation equations for each meteorological locations
For simplicity, the 15 meteorological locations are classified further into 5 regions as shown in .
Table 5. Classifications of the 15 meteorological locations into 5 regions
A comparison was made between the measured values, geospatial data and that predicted by correlation equations listed in . Comparison between measured (Hm) and calculated (HAP, HLO and HGM) values of monthly mean daily global solar radiation for the Central region is given in . This region includes Addis Ababa and Metehara. The highest measured solar radiation value (from NASA) was found in Metehara in February (7.0 kWh/m2), while it was found in Addis Ababa in January. Similarly, the highest estimated global solar radiation was observed for both stations in February using all empirical models. Due to the country’s highest cloud cover and rainy season, the lowest measured and calculated radiation values were recorded in July at both sites.
Table 6. Comparison between measured (Hm) and calculated (HAP, HLO and HGM) values of monthly mean daily global solar radiation for the Central region in kWh/m2/day
In Addis Ababa, the monthly mean daily global solar radiation values range from 3.2 to 7.6 kWh/m2, 3.0 to 7.1 kWh/m2, and 3.2 to 7.5 kWh/m2 for the AP, LO, and GM models, respectively. In Metehara, it ranges from 4.3 to 7.6 kWh/m2, 4.1 to 7.2 kWh/m2, and 4.3 to 7.6 kWh/m2 for the AP, LO, and GM models, respectively. During the dry season (winter), the values for both stations are generally greater than 6.4 kWh/m2. The annual mean daily global solar radiation for Metehara was 6.2 kWh/m2 for the AP and GM models, and 5.9 kWh/m2 for the LO model, making it the hotter place compared to Addis Ababa.
Dire Dawa and Gode are considered for the eastern part. The maximum measured global solar radiation has been recorded at both stations during the months of January and February. Similarly, for both stations, the maximum estimated global solar radiation by all models was observed during the same month (February). In July, both sites recorded their lowest measured and calculated solar radiation values (). Monthly mean daily global solar radiation values in Dire Dawa range from 4.5 to 7.5 kWh/m2, 4.2 to 7.1 kWh/m2, and 4.4 to 7.4 kWh/m2 for the AP, LO, and GM models, respectively. In Gode, it ranges from 3.9 to 7.9 kWh/m2, 3.7 to 7.5 kWh/m2, and 3.9 to 7.96 kWh/m2 for the AP, LO, and GM models, respectively. For both stations, the annual mean daily global solar radiation calculated by all models is greater than 6 kWh/m2.
Table 7. Comparison between measured (Hm) and calculated (HAP, HLO and HGM) values of monthly mean daily global solar radiation for the Eastern region in kWh/m2/day
shows a comparison of measured and calculated values of monthly mean daily global solar radiation for the Western region (Nekemte, Jimma, and Gore). During the month of February, the maximum measured global solar radiation was recorded at all stations. Similarly, the maximum estimated global solar radiation by all models was observed for all stations during the same month (February), and July is the coldest month for all stations (). Monthly mean daily global solar radiation values in Nekemte range from 2.7 to 7.4 kWh/m2, 2.6 to 7.0 kWh/m2, and 2.7 to 7.3 kWh/m2 for the AP, LO, and GM models, respectively. In Jimma, it ranges from 3.1 to 7.3 kWh/m2, 2.9 to 6.9 kWh/m2, and 3.1 to 7.3 kWh/m2 for the AP, LO, and GM models, respectively, whereas in Gore, it ranges from 2.7 to 7.0 kWh/m2, 2.4 to 6.5 kWh/m2, and 2.6 to 6.9 kWh/m2. In comparison to Nekemte and Jimma, the annual mean daily global solar radiation for Gore was 5.2, 4.8, and 5.1 kWh/m2 for the AP, LO, and GM models, respectively, making it the coldest place.
Table 8. Comparison between measured (Hm) and calculated (HAP, HLO and HGM) values of monthly mean daily global solar radiation for the Western region in kWh/m2/day
A comparison of the monthly mean daily global solar radiation values for the Southern and Northern parts of the country is shown in . At all of the stations in both regions during the month of February, the maximum measured global solar radiation was observed. Similarly, all models estimated the highest global solar radiation for all stations during the same month (February), and July is also the coldest month for all stations ().
Table 9. Comparison between measured (Hm) and calculated (HAP, HLO and HGM) values of monthly mean daily global solar radiation for the Northern region in kWh/m2/day
Table 10. Comparison between measured (Hm) and calculated (HAP, HLO and HGM) values of monthly mean daily global solar radiation for the Southern region in kWh/m2/day
3.2. Validation of the models using statistical tests
Accordingly, RMSE MBE, MPE and r are more appropriate to determine the statistical findings. It can be seen that the estimated values of monthly mean daily global radiation for all stations are in favourable agreement with the measured values for all the models (), except the LO model, which is out of the acceptable range for Debre Markos station (MPE = −10.36%). However, it was found that AP and GW models show good results. This is due to both models having the lowest values of RMSE, MBE and MPE, and the highest values of r compared to the model LO. It was found that, the mean percentage errors, MPE, of AP and GW are in the range of acceptable values between −4.7380% to 3.1638% and −5.5568%to 2.9155%, respectively with the lowest RMSE values that range from 0.4207 to 0.8150 (AP) and 0.4086 to 0.8076 (GW). Also, the MBE values of the models are very close to zero, while the values of r range from 0.8875 to 0.9922 and 0.8875 to .9922 for AP and GW, respectively. Also, as seen in , according to the statistical test of the correlation coefficient (r), all models achieve the good results (above 0.88) for the studied sites. This means that the models obtained are reasonably compatible with the measured data.
Table 11. Statistical results for the validation of the AP Model
Table 12. Statistical results for the validation of the LO Model
Table 13. Statistical results for the validation of the GM Model
With average r of 0.9661, 0.9661, and 0.9663, average RMSE of 0.5514, 0.5640, and 0.5694, average MBE of 0.0345, 0.0743, and −0.2723, and average MPE of −0.5346, 0.1232, and −5.6569, respectively, the GW model had the highest prediction accuracy among the two other models in Central Ethiopia, followed by the AP model. For Eastern Ethiopia, the three models have remarkably similar average r and average RMSE, but GM outperforms with an average MBE of 0.0977, and an average MPE of 0.7734. Similarly, in Western Ethiopia, an average r of 0.9662 is achieved for all models, with average RMSE of 0.6514, 0.6606, and 0.6430, average MBE of 0.0095, 0.0391, and −0.2891, and average MPE of −1.9129, −1.3750, and −7.3475, respectively, for GM, AP, and LO models, respectively. In the Northern part of the country, the average r was 0.9442, 0.9441, and 0.9439, the average RMSE was 0.6294, 0.6416, and 0.6790, the average MBE was −0.0856, −0.0169, and −0.3547, and the average MPE was −2.7563, −1.5964, and −7.3573. In Southern Ethiopia, the GW model had the best prediction accuracy, followed by the AP model, with average r of 0.9859, 0.9859, and 0.9539, average RMSE of 0.5028, 0.5134, and 0.4630, average MBE of 0.1379, 0.1582, and −0.1896, and average MPE of 1.1148, 1.4572, and 4.4888, respectively. However, the GM model showed the best performance for daily H estimation for all stations among the other models, with an average r of 0.9574, average RMSE of 0.6017, average MPE of 0.00335, and average MBE of −0.7555, respectively followed by AP. Therefore, it has been concluded that models GM and AP were recommended for use to estimate monthly mean daily global solar radiation for all (see, ).
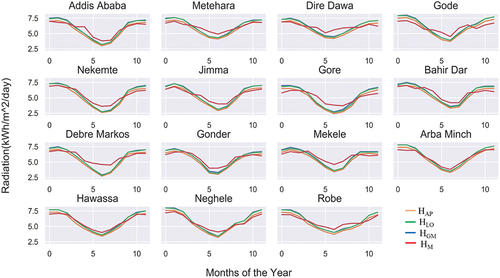
The measured and calculated values of the monthly average daily global radiation in which all models are used for each station are illustrated in . Accordingly, estimated values by each model and the measured data for all the months of the year are in broad agreement.
Figure 2. Measured monthly daily global radiation (red) versus computed radiation (blue) for each station.
3.3. Validation of the models using geospatial data
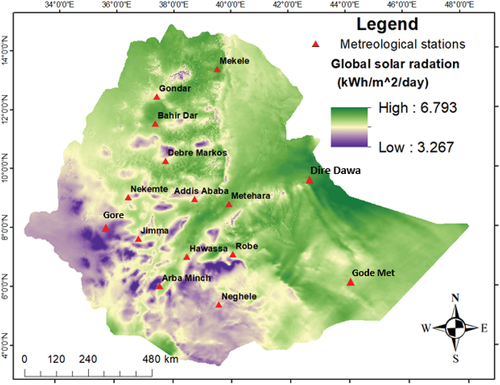
The solar radiation values have been displayed in the geospatial form to provide quick and easy access to solar resources and photovoltaic power potential areas in Ethiopia. This could save time, manpower and energy. The spatial analysis and mapping show a significant variation in monthly mean daily global solar radiation in Ethiopia, ranging from 3.26 kWh/m2/day to 6.79 kWh/m2/day. The variation could be due to the data used by the World Bank, which is rough and lacks of precision. This indicates that global sample data also need to take numerous data in a certain country. The eastern, northern and some central part of the country has huge solar energy potential while the solar resource is lower in the country’s southern, western, and some central highlands ().
Figure 3. Spatial Solar radiation of Ethiopia.
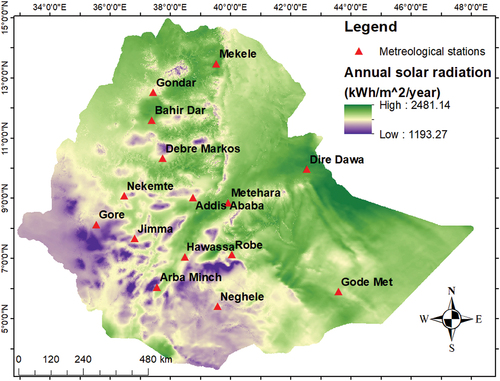
To locate areas receiving high amounts of solar radiation, annual global solar radiation was also processed for the total surface area of the country. As a result, the maximum estimated global solar radiation is 2481 kWh/m2/year while the minimum global solar radiation is 1193 kWh/m2/year. shows the annual global solar radiation map of the country. Most of the northern, northeast, eastern and some central parts with green colour indicate the area that receives a high amount of global solar radiation. This indicates that the country has favourable conditions for large solar energy applications like PV farms.
Figure 4. Annual global solar radiation map of Ethiopia.
In addition to the statistical tests, the validation of the recommended model (GM model) has been cross-checked using the Geospatial data which was obtained from the World Bank. The validation shows that there is an insignificant difference in annual mean daily global solar radiation (see, ) in each station between the geospatial data and the calculated data (using the GM model). Therefore, this study informs that the calculated data is more ideal and can be applied for the implementation of a solar energy project, and the geospatial (data of the world bank) is also proper to apply in Ethiopia.
Table 14. Comparisons of the Geospatial data and estimated value by GM model
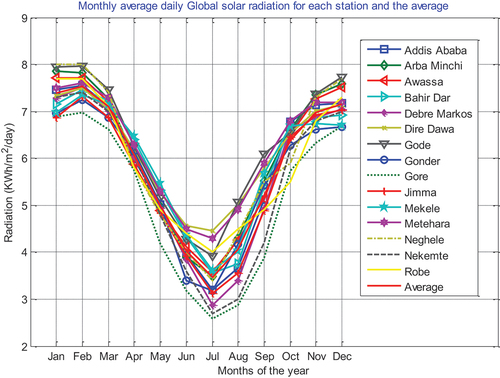
As shown in , all stations have the same trend; the global solar radiation starts decreasing from January to July and increases from July to December. For all locations, the minimum radiation occurred between June and August due to the peak period of cloud coverage in the country and the rainy season. The major maximum monthly average daily global solar radiation occurred between December and March in all stations. In general, a higher value of solar radiation is obtained in the dry season than in the wet season. The other months have moderate radiations. The results also show that the monthly average daily global solar radiation on a horizontal surface in Ethiopia lay between 3.45 kWh/m2/day (July) and 7.47 kWh/m2/day (February). The value of annual average daily global solar radiation on a horizontal surface for Ethiopia throughout the study is estimated to be 5.83 kWh/m2/day calculated by using the GM model.
Figure 5. Monthly average daily Global calculated by the AP model for each station and its average for the entire year.
4. Conclusion
Solar energy is one of the most important alternative energy sources. For designing any solar energy device, solar energy parameters and components have an important role. Solar energy offers us clean and sustainable energy for the future. Correct predictions and using solar energy models have big importance, due to the energy demand of the world in these days. AP, LO and GM models can be used to estimate monthly mean daily global solar radiation using sunshine duration as primary input data. When compared to the values measured by NASA and geospatial data, the performance of all models was found to be good and acceptable. Statistical indicators values (RMSE, MBE, MPE, and r) for AP (0.6125, 0.0730, −0.1178, 0.9574), LO (0.6025, −0.2682, −5.9654, 0.9654), and GW (0.6017, 0.0335, −0.7885, 0.9574) were obtained through statistical tests for all models. It was shown that the estimated values of monthly mean daily global radiation for all stations are in agreement with the measured data for all the models. However, the GM model has better performance than the two other models for most of the stations and therefore, is recommended for the estimation of global solar radiation for the entire country. The geospatial data also confirmed the validity and applicability of the recommended model. The highest measured solar radiation value (from NASA) was recorded in February (6.89 kWh/m2/day). Likewise, the highest estimated global solar irradiance in February was observed using the three empirical models, with values of 7.55, 7.12, and 7.47 kWh/m2/day for the AP, LO, and GM models, respectively. The lowest measured and calculated radiation values were recorded in July due to the country’s highest cloud cover and rainy season. The results also revealed that the estimated monthly average daily solar radiation on a horizontal surface in Ethiopia varied from 3.45 kWh/m2/day (July) to 7.47 kWh/m2/day (February) with an annual average value of 5.83 kWh/m2/day (the average of all stations) calculated by GM model. In addition to the empirical models, estimations of global solar radiation using neural networks have received significant attention. The global solar radiation intensity predicted in this study can be utilized in the design, analysis and performance evaluation of solar energy potential, which is gaining significant attention from the Ethiopian government in the advocacy of a green economy and reducing greenhouse gas emissions as one of its political agenda to meet the Sustainable Development Goal (SDG).
Acknowledgements
The authors would like to thank the National Meteorological Agency of Ethiopia (NMA) for the meteorological data.
Disclosure statement
No potential conflict of interest was reported by the author(s).
Additional information
Funding
Notes on contributors
Natei Ermias Benti
Natei Ermias Benti holds a PhD in Environmental Science from Addis Ababa University (stream: Atmosphere, Energy, and Climate Change). He is presently an assistant professor in the Department of Physics at Wolaita Sodo University, Ethiopia. His research interests include energy conversion and storage, energy management and energy sustainability
References
- Al-Ghezi, M. K. S., Ahmed, R. T., & Chaichan, M. T. (2022). The influence of temperature and irradiance on performance of the photovoltaic panel in the middle of Iraq. International Journal of Renewable Energy Development, 11(2), 501–25. https://doi.org/10.14710/ijred.2022.43713
- Al-Ghezi, M. K. S., Mahmoud, B. K., Alnasser, T. M. A., & Chaichan, M. T. (2022). A comparative study of regression models and meteorological parameters to estimate the global solar radiation on a horizontal surface for Baghdad city, Iraq. International Journal of Renewable Energy Development, 11(1), 71–81. https://doi.org/10.14710/IJRED.2022.38493
- Almorox, J., Bocco, M., & Willington, E. (2013). Estimation of daily global solar radiation from measured temperatures at Cañada de Luque, Córdoba, Argentina. Renewable Energy, 60(2013), 382–387. https://doi.org/10.1016/j.renene.2013.05.033
- Alsharif, M. H., Younes, M. K., & Kim, J. (2019). Time series ARIMA model for prediction of daily and monthly average global solar radiation: The case study of Seoul, South Korea. Symmetry, 11(2), 1–17. https://doi.org/10.3390/sym11020240
- Angstrom, A. (1924). Solar and terrestrial radiation. Q. J. R. Meteorol. Soc, 50, 121–125. https://doi.org/10.1002/qj.49705021008
- Anis, S., Jamil, B., Ansari, A., & Bellos, E. (2019). Generalized models for estimation of global solar radiation based on sunshine duration and detailed comparison with the existing : A case study for India. Sustainable Energy Technologies and Assessments, 31(February), 179–198. https://doi.org/10.1016/j.seta.2018.12.009
- Argaw, N. (1996). Estimation of Solar Radiation Energy of Ethiopia From Sunshine Data. International Journal of Solar Energy, 18(2), 103–113. https://doi.org/10.1080/01425919608914309
- Awopone, A. K. (2021). Feasibility analysis of off-grid hybrid energy system for rural electrification in Northern Ghana. Cogent Engineering, 8(1), 1981523. https://doi.org/10.1080/23311916.2021.1981523
- Bekele, G., & Palm, B. (2009). Wind energy potential assessment at four typical locations in Ethiopia. Applied Energy, 86(3), 388–396. https://doi.org/10.1016/j.apenergy.2008.05.012
- Ben Jemaa, A., Rafa, S., Essounbouli, N., Hamzaoui, A., Hnaien, F., & Yalaoui, F. (2013). Estimation of global solar radiation using three simple methods. Energy Procedia, 42, 406–415. https://doi.org/10.1016/j.egypro.2013.11.041
- Benti, N. E., & Tadesse, G. (2017). Feasibility study of solar photovoltaic (PV) energy systems for rural villages of Ethiopian somali region (A case study of jigjiga zone). American Journal of Science, Engineering and Technology, 1(2), 42–48. https://doi.org/10.11648/j.ajset.20160102.14
- Besharat, F., Dehghan, A. A., & Faghih, A. R. (2013). Empirical models for estimating global solar radiation: A review and case study. Renewable and Sustainable Energy Reviews, 21, 798–821. https://doi.org/10.1016/j.rser.2012.12.043
- Chelbi, M., Gagnon, Y., & Waewsak, J. (2015). Solar radiation mapping using sunshine duration-based models and interpolation techniques: Application to Tunisia. Energy Conversion and Management, 101, 203–215. https://doi.org/10.1016/j.enconman.2015.04.052
- Doorga, J. R. S., Rughooputh, S. D. D. V., & Boojhawon, R. (2019). Modelling the global solar radiation climate of Mauritius using regression techniques. Renewable Energy, 131, 861–878. https://doi.org/10.1016/j.renene.2018.07.107
- Duffie, J. A., & Beckman, W. A. (1991). “Solar Engineering of Thermal Processes”. Third). Wiley.
- EEP. (2018). Ethiopian electric power facts in brief. https://doi.org/10.1080/00038628.2018.1432475
- EEPCo. (2014). Ethiopian Power Sector Development. 117.
- Garg, H. P., Kandpal, T. C., & Khas, H. (1996). Renewable energy education: Challenges and problems in developing countries. Renewable Energy, 9(1–4), 1188–1193. https://doi.org/10.1016/0960-1481(96)88490-4
- Global Solar Atlas version 2.0. (2020). https://globalsolaratlas.info/download/worl
- globalsolaratlas.info/solar-measurement. (n.d.). Global solar atlas. https://globalsolaratlas.info/solar-measurement
- Glover, J., & Mcculloch, S. G. (1957). The empirical relation between solar radiation and hours of sunshine. Quarterly Journal of Royal Meteorological Society, 84(360), 172–175. https://doi.org/10.1002/qj.49708436011
- Gopinathan, K. K. (1992). Estimation of hourly global and diffuse solar radiation from hourly sunshine duration. Solar Energy, 48(1), 3–5. https://doi.org/10.1016/0038-092X(92)90170-F
- Jiang, H., Lu, N., Huang, G., Yao, L., Qin, J., & Liu, H. (2020). Spatial scale effects on retrieval accuracy of surface solar radiation using satellite data. Applied Energy, 270(11), 115178. https://doi.org/10.1016/j.apenergy.2020.115178
- Jiang, H., Lu, N., Qin, J., Tang, W., & Yao, L. (2019). A deep learning algorithm to estimate hourly global solar radiation from geostationary satellite data. Renewable and Sustainable Energy Reviews, 114(11), 109327. https://doi.org/10.1016/j.rser.2019.109327
- Jiang, H., Lu, N., Qin, J., & Yao, L. (2021). Hierarchical identification of solar radiation zones in China. Renewable and Sustainable Energy Reviews, 145(11), 111105. https://doi.org/10.1016/j.rser.2021.111105
- Karaman, Ö. A., Tanyıldızı Ağır, T., & Arsel, İ. (2021). Estimation of solar radiation using modern methods. Alexandria Engineering Journal, 60(2), 2447–2455. https://doi.org/10.1016/j.aej.2020.12.048
- Katiyar, A. K., & Pandey, C. K. (2010). Simple correlation for estimating the global solar radiation on horizontal surfaces in India. Energy, 35(12), 5043–5048. https://doi.org/10.1016/j.energy.2010.08.014
- Koussa, M., Malek, A., & Haddadi, M. (2009). Statistical comparison of monthly mean hourly and daily diffuse and global solar irradiation models and a Simulink program development for various Algerian climates. Energy Conversion and Management, 50(5), 1227–1235. https://doi.org/10.1016/j.enconman.2009.01.035
- Louche, A., Notton, G., Poggi, P., & Simonnot, G. (1991). Correlations for direct normal and global horizontal irradiation on a French Mediterranean site. Solar Energy, 46(4), 261–266. https://doi.org/10.1016/0038-092X(91)90072-5
- NASA. (2020). World Surface Metrology. http://eosweb.larc.nasa.gov/cgibin/sse/[email protected]
- Nwokolo, S. C., & Ogbulezie, J. C. (2018). A quantitative review and classification of empirical models for predicting global solar radiation in West Africa. Beni-Suef University Journal of Basic and Applied Sciences, 7(4), 367–396. https://doi.org/10.1016/j.bjbas.2017.05.001
- Onyango, A. O., & Ongoma, V. (2015). Estimation of mean monthly global solar radiation using sunshine hours for Nairobi City, Kenya. Journal Renewable Sustainable Energy, 7(5), 053105. https://doi.org/10.1063/1.4930530
- Piri, J., & Kisi, O. (2015). Modelling solar radiation reached to the Earth using ANFIS, NN-ARX, and empirical models (Case studies: Zahedan and Bojnurd stations). Journal of Atmospheric and Solar-Terrestrial Physics, 123, 39–47. https://doi.org/10.1016/j.jastp.2014.12.006
- Prescott, J. A. (1940). Evaporation from water surface in relation to solar radiation. Transactions of the Royal Society of Australia, 46, 114–118.
- Sekhar, Y. R., Sharma, K. V., & Rao, A. V. M. S. (2012). New correlations for estimation of monthly average daily solar radiation on a horizontal surface using meteorological data. International Journal of Ambient Energy, January, 34(4), 37–41. https://doi.org/10.1080/01430750.2012.740430
- Soulouknga, M. H., Coulibaly, O., Doka, S. Y., & Kofane, T. C. (2017). Evaluation of global solar radiation from meteorological data in the Sahelian zone of Chad. Renewables: Wind, Water, and Solar, 4(4), 1–10. https://doi.org/10.1186/s40807-017-0041-0
- Tog, H., & Toğrul, H. (2002). Global solar radiation over Turkey : Comparison of predicted and measured data. Renewable Energ, 25(1), 55–67. https://doi.org/10.1016/S0960-1481(00)00197-X
- Twidell, J., & Weir, T. (2006). “Renewable Energy Resources” (2nd Edn ed.). Taylor & Francis.
- Velasco, E. T., & Salbidegoitia, I. B. (2019, July). New methodology for solar irradiance calculation using Meteosat satellite imagery. AIP Conference Proceedings, 2126, 190016. https://doi.org/10.1063/1.5117713
- WMO. (2003). Guide to meteorological instruments and methods of observation,WMO-No.8. http://www.wmo.int/
- Yao, W., Li, Z., Xiu, T., Lu, Y., & Li, X. (2015). New decomposition models to estimate hourly global solar radiation from the daily value. Solar Energy, 120, 87–99. https://doi.org/10.1016/j.solener.2015.05.038
- Yorukoglu, M., & Celik, A. N. (2006). A critical review on the estimation of daily global solar radiation from sunshine duration. Energy Conversion and Management, 47(15–16), 2441–2450. https://doi.org/10.1016/j.enconman.2005.11.002
- Yousif, J. H., Al-Balushi, H. A., Kazem, H. A., & Chaichan, M. T. (2019). Analysis and forecasting of weather conditions in Oman for renewable energy applications. Case Studies in Thermal Engineering, 13, 100355. October 2018 https://doi.org/10.1016/j.csite.2018.11.006
- Zang, H., Xu, Q., & Bian, H. (2012). Generation of typical solar radiation data for different climates of China. Energy, 38(1), 236–248. https://doi.org/10.1016/j.energy.2011.12.008
- Zhang, Q., Cui, N., Feng, Y., Jia, Y., Li, Z., & Gong, D. (2018). Comparative analysis of global solar radiation models in different regions of China. Advances in Meteorology, 2018, 1–21. https://doi.org/10.1155/2018/3894831