
 ?Mathematical formulae have been encoded as MathML and are displayed in this HTML version using MathJax in order to improve their display. Uncheck the box to turn MathJax off. This feature requires Javascript. Click on a formula to zoom.
Abstract
This study investigated and evaluated the linear or main and interactive effects of drying process conditions on the cabinet hot air drying and quality traits of dried okra slices using the method of response surface (RSM). Rotatable central composite design (RCCD) with four-factors-five-levels of RSM was utilized to evaluate the effect of four process condition, namely air velocity, AV (0.0–2.0 m/s), relative humidity, RH (60–80%), drying temperature, DT (40–80 °C), and drying time, DRT (90–450 min) on dried okra quality traits (product moisture content (PMC), total plate count (TPC), protein content (PTC), and carbohydrate content (CHC)) and to optimize the process conditions to achieve a dried product with minimum PMC, TPC, and maximum PTC and CHC quality attributes as well as to develop statistical regression models for the quality attributes. The results demonstrated that DRT and the DT are the most significant drying conditions that exerted more pronounced linear and interactive effects on the dried okra quality attributes. Second-order quadratic regression models adequately fitted the data to predict the quality attributes. The optimized drying conditions for minimum PMC and minimum TPC as well as maximum PTC and maximum CHC quality attributes were obtained as DT, 55°C; AV, 1.64 m/s: RH, 60% and DRT, 450 min. The drying treatment generally preserved and retained the PTC and CHC of the fresh okra as well as reduced the microbial load to an acceptable limit allowed for consumption.
1. Introduction
Okra (Hibiscus/Abelmoschus esculentus) is an important vegetable with high moisture content and a good source of dietary fiber, vitamins A, B complex and C, folic acid, protein, carbohydrate, low saturated fat, calcium, and iron (Olajire et al., Citation2018; Hussein et al., Citation2018; Li et al., Citation2019; Owolarafe et al., Citation2021; Dos Santos et al., Citation2021). Invariably, okra is a functional source of food (Dantas et al., Citation2021). Due to the high moisture level in okra, it is prone to phytochemical degradation as a result of non-enzymatic and enzymatic reactions as well as vulnerable to deterioration and spoilage which can be induced by the presence of microorganisms. Hence, reducing the moisture level or water content through the process of drying is very imperative (Md Saleh et al., Citation2020) as to inhibit microbial growth and extend product shelf life (Nurkhoeriyati et al., Citation2021).
Hot-air drying (HAD) is one of the most widely employed drying technology (Dey et al., Citation2019; Garba et al., Citation2015; Menon et al., Citation2020; Singhal et al., Citation2020; Zhao et al., Citation2017). However, drying is a dynamic, unsteady, nonlinear and complex thermal process (Agarry et al., Citation2021; Nurkhoeriyati et al., Citation2021) which often times affect the vegetables’ quality properties such as nutritional properties, sensory properties, textural properties, structural properties, and rehydration properties as well as microbiological properties (Omolola et al., Citation2017). This is due to the physical and chemical changes that normally take place within the product in the course of drying (Guiné, Citation2018). Drying temperature, relative humidity and air velocity are drying process conditions that generally affect the nutritional and sensory properties of fruits and vegetables (Onwude et al., Citation2022). Thus, drying process needs careful monitoring and control and therefore it is paramount to select optimal drying process conditions that will guarantee the preservation of the dried-product quality properties without compromising the minimization of energy. The determination of these optimal drying process conditions can be achieved through the use of a statistical optimization method referred to as response surface methodology (RSM; Yolmeh & Jafari, Citation2017). The RSM has been successfully applied in drying operations such as microwave drying (Baltacıoğlu, Citation2017) and HAD operations of food products (Ganje et al., Citation2018; Sasongko et al., Citation2020; Zhao et al., Citation2017).
Several researchers have investigated the HAD of okra (Pendre et al., Citation2012; Kumar et al., Citation2014; Famurewa & Olumofin, Citation2015; Olajire et al., Citation2018; Hussein et al., Citation2018; Nwakuba et al., Citation2018; Li et al., Citation2019; Owolarafe et al., Citation2021; Dos Santos et al., Citation2021; Agarry et al., Citation2021; Okunola et al., Citation2021; Sukeaw et al., Citation2022). Few of these researchers made attempt to study the influence of drying temperature on dried okra’s quality properties, such as sensory attributes like colour, rehydration ratio and texture hardness (Kumar et al., Citation2014), nutritional properties like protein, fibre, ascorbic acid or vitamin C, carbohydrate and fat (Famurewa & Olumofin, Citation2015; Pendre et al., Citation2012). On the other hand, it is only Kumar et al. (Citation2014) that have investigated the single and interactive effects of air velocity, microwave power and temperature on dried okra products’ sensory attributes, utilizing the RSM. Thus, to the best of our knowledge as seen from the above literature review, there are no known works that have been published in relation to the single and interactive effects of different drying process conditions (relative humidity, drying time and air velocity) on the HAD of okra and its nutritional and microbiological quality-traits or attributes after drying using cabinet drying equipment. The knowledge of physical, nutritional and microbiological properties or qualities of dried okras is very important for optimizing the drying process as to obtain high quality-healthy vegetable for consumers, vegetable groceries and food markets. According to Zhao et al. (Citation2017), microbiological stability of a dried product may directly and positively be influenced by the amount of available moisture or water. It is important to get insights into microbial load changes as well as macronutrients’ changes during okras’ drying, because they are potential functional food source of essential nutrients which makes this study to be imperative.
Therefore, the specific objectives of this work were to investigate and evaluate the linear or main and interactive effects of air velocity (AV), relative humidity (RH), drying temperature (DT), and drying time (DRT) on dried okra’s nutritional (product moisture content (PMC), protein content (PTC), carbohydrate content (CHC) and microbial (total plate count (TPC)) quality attributes, as well as to optimize the drying process conditions that would improve or enhance okra dried product quality in relation to minimum PMC, minimum TPC, maximum PTC and maximum CHC using RSM and to propose with respect to the drying process conditions a mathematical or statistical model for the prediction/determination of the optimum dried okra’s quality attributes. PMC is the most important property that is intimately associated with the entire quality and long shelf life of the food product (Shishir et al., Citation2016). The TPC sometimes referred to as standard plate count (SPC) is one of the most widely used microbiological technique for indicating food safety microbial quality (Maghfiroh et al., Citation2021). It provides information concerning the total microbial load in foods.
2. Materials and methods
2.1. Materials
2.1.1. Drying equipment
The cabinet-tray dryer used for this experiment was self-designed and fabricated (Figure ).
Figure 1. A cabinet-tray dryer for the drying of okra slices.
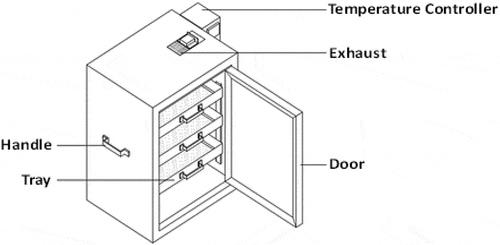
The cabinet-tray dryer has a drying capacity of 20 kg per batch. It was designed and fabricated using aluminum sheets lined with a layer of 2.5 cm thick Armaflex used as an insulator, and wrapped with 0.5 mm thick heat-resistant aluminum foil to control heat loss by conduction. The dryer is made up of three sections which are, the drying chamber, air-blower, and the heating chamber sections. The drying chamber is of rectangular cuboid shape with external (outer wall) dimension of 0.65 m x 0.55 m x 0.95 m and internal dimension of 0.60 m x 0.50 m x 0.90 m. The drying chamber had slots for each drying tray which are perforated for effective airflow within the chamber (Dimitrios et al., Citation2012). The air-blower section consists of a blower or centrifugal fan of 0.5 horsepower capacity which helps in circulating heat for effective and efficient heat flow rate within the drying chamber (Ajayeoba et al., Citation2014). The fan is attached to an opening at the back of the drying chamber close to the bottom. The fan is linked to the heating element by a cylindrical duct with diffuser (or shutter). The heating or energy section consists of the heating element with power rating of 2.5 kW. The heating element is fixed at the lower part of the drying chamber in front of the centrifugal fan. The heater through its terminal box bolted to the upper right of the dryer is connected to an electric power source.
2.1.2. Samples
Fresh okra samples used for this study were purchased from a local market at Idi-Oro (6.5219° N, 3.3565° E), Lagos State of South-West Nigeria. The samples were sorted out and those of similar size, shape and colour were selected and kept in a refrigerator at 4°C prior to drying. The okra samples were brought out from the refrigerator and stored in ambient temperature for some hours to achieve equilibrium temperature with the environment before drying.
2.2. Methods
2.2.1. Drying experimental design using rotatable central composite rotatable design (RCCD)
RSM was utilized to investigate the single and interactive effects of drying process parameters or variables on the okra nutritional and microbial quality traits during drying. RSM tool of Design-Expert 6.0.8 (State Ease, USA) software which involved four-factor-five-level rotatable central composite design (RCCD) of RSM tool in Design-Expert 6.0.8 (State Ease, USA) software was utilized to optimize the drying process parameters for dried okra in order to obtain high quality dried products. The independent drying process variables considered for this experimental design were AV, RH, DT and DRT while the dependent response variables were PMC PTC, CHC and TPC, respectively. The values of the independent drying process variables used for the RCCD were obtained from previous okra drying experiments published elsewhere (Agarry et al., Citation2021) and these are: AV 0.0–2.0 m/s, RH, 60–80%, DT, 40–80°C and DRT, 90–450 min. The RCCD generated 30 experimental runs which corresponded to 22 factorial points and 8 centre point replicates.
The RCCD experimental design for the okra drying process is presented in Table . The okra drying was carried out based on the RCCD provided in Table . In conducting the experiment, fresh okra samples with an average moisture content of 86.1% were sliced into a 2 mm thickness. Sliced okra samples of 1 kg were weighed and evenly or uniformly spread in a single layer onto a clean tray of the cabinet-tray dryer. The dryer was heated to the required drying temperature before the tray was placed into the dryer chamber. The RH of the drying air which enters into the drying chamber was manually controlled using a water aerosol (1 L water trigger sprayer (Sprayon Model SO-075)) operated behind the air-blower until the required RH was achieved. The RH was measured using a dual-function instrument (PCE-555 Model, Southampton, United Kingdom with ±2% RH accuracy) that measures both RH and T, respectively. The velocity of the air (AV) entering into the dryer was adjusted by controlling the rotational speed of the air-blower using a control module or speed regulator. The drying air flows in a horizontal direction over the surface of the samples and across the perforated bottom of the tray. The AV was measured at the entrance of the drying chamber using a digital hot-wire anemometer (PCE-009 Model, Southampton, United Kingdom).
Table 1. Experimental range and levels of the variables using RCCD for okra drying
2.2.2. Numerical optimization procedure
In optimizing the drying process conditions for okra, the desirability function in numerical optimization tool of RSM in Design-Expert statistical software was applied. In carrying out the optimization process, the target criteria or objective was set as maximum value for the response variables (PTC and CHC) and minimum value for the response variables (PMC and TPC), while the values of the four independent variables were set at the ranges being studied. The predicted experimental drying process variables/conditions with the highest desirability were selected and recorded. The predicted and observed experimental results of the responses obtained at optimum drying process conditions were recorded.
2.2.3. Verification of predicted optimum process conditions
For verification of the predicted optimum drying process conditions as obtained using the numerical optimization tool, laboratory okra drying experiments were conducted under the predicted optimum drying process conditions obtained. The experimental observed values of the response variables (PTC, CHC, PMC and TPC) were recorded and then compared with the predicted values in order to check the validity of the models. The percentage error (%E) between the experimental value and the predicted value is calculated as provided in EquationEq. (1(1)
(1) ); (Aworanti et al., Citation2017):
Where Ziis the predicted value and Zjis the experimental value.
2.2.4. Nutritional quality: Proximate analysis
The PTC was estimated using Kjedahl nitrogen standard method (AOAC (Association of Official Analytical Chemists), Citation2019). Phenol-sulphuric acid method (Tamboli et al., Citation2020) was utilized for the CHC determination. Oven drying method (AOAC (Association of Official Analytical Chemists), Citation2019) was utilized for moisture content (MC) determination.
2.2.5. Microbiological quality: Total plate count analysis
Total plate count (TPC) was utilized as the microbial or microbiological quality index. For TPC determination, serial dilution and pour plate methods were used (Isnawaida et al., Citation2021; Ragab et al., Citation2020). Fresh and dried okra samples were separately homogenized using Stomacher and 1 g each of the homogenized samples was weighed in an aseptic condition and introduced separately into a sterilized peptone water (9 mL). Serial tenfold dilution was performed and from an appropriate dilution, 1 mL was taken and dispensed into sterile plates. The plates were cooled, and there after plate count nutrient agar was poured on to each of the plates and then incubated. The plate was incubated at 37°C for 24–48 h. After the period of incubation, the total isolates were subsequently counted using a colony counter (Galaxy 230) and thus recorded accordingly. The TPC was calculated by multiplying the average or mean number of colonies per plate by the dilution factor and recorded as colony forming unit per gram (CFU/g).
2.2.6. Mathematical modelling and variance analysis (ANOVA)
Mathematical model in the form of a second-order or quadratic polynomial model that describes or correlate the relationship between the independent process variables and the dependent response variables was developed as given in Eq. (2). After the conduct of the experiment, the design-based experimental drying data were adjusted to this model equation, employing the Design-Expert 6.08 software ((state-Ease, Inc., Minneapolis MN, USA)). This model can be used for the prediction of the response variables based on multiple linear regression analysis.
where Zi = predicted response, Zi = offset term (i.e. the constant that fixed the response at the experiment centre point), Zi = linear coefficient, Zi = quadratic coefficient, and Zi = interaction coefficient. Zi(= 1, 2, 3) and Zi (Zi = 1, 2, 3) are the drying process independent variables. The quadratic polynomial model adequacy to fit the okra drying experimental data was assessed and evaluated using the variance analysis (ANOVA) and regression analysis with the following components: lack of fit, coefficient of variation (CV), coefficient of determination, Adjusted, Predicted, and Adequate Precision. The model terms were evaluated for each response by the probability value (i.e. p-value).
3. Results and discussions
3.1. Linear effects of AV, DT, RH and DRT on PMC, TPC, PTC and CHC
Results of the dependent response variables, which include PMC, PTC, CHC and TPC obtained under different drying process conditions are provided in Figure ).
Figure 2. Plots for (a) PMC (b) TPC (c) PTC (d) CHC results obtained from different experimental runs carried out at different drying process parameters (AV, DT, RH and DRT).
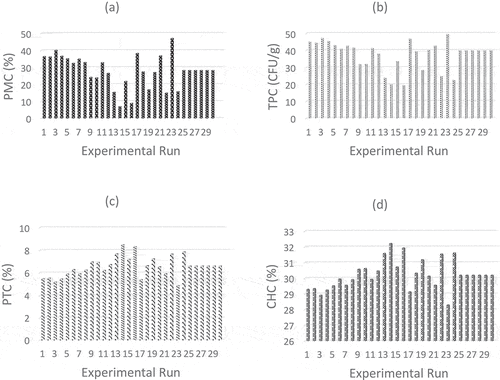
(Figure )) shows the PMC, TPC, PTC and CHC results obtained at different experimental runs carried out at different drying process parameters. The results revealed that the PMC (Figure )) and TPC (Figure )) of the okra gradually decreases while the PTC (Figure )) and CHC (Figure )) increases as the AV gradually increased from 0.0 m/s (i.e. without the use of air velocity) to 2.0 m/s (see Experimental Run 1 and 2; 3 and 4; 5 and 6; 7 and 8; 9 and 10; 11 and 12; 13 and 14; and 15 and 16). That is, the increase in AV had a significant (p < 0.05) negative linear impact on the PMC and TPC as well as a significant (p < 0.05) positive linear effect on PTC and CHC (see, Table ). Since PMC is the most important property in drying, this observation indicates that increase in AV results in decreased amount of moisture that was retained in the dried product due to increased moisture loss from the fresh okra samples (Garba & Oviosa, Citation2019). The reduced moisture content in the dried okra was the reason for the reduction in the TPC (microbial load) as low moisture content suppresses the growth of microorganisms (Abdel-Hameed et al., Citation2017) as well as the reason for the increased concentration of the PTC and CHC. Similar observation of a decreased PMC as a result of increasing AV has been presented for dark red onions (Bhong & Kale, Citation2020).
Table 2. Model coefficient estimate and ANOVA for the dried okra’s PMC, PTC, CHC and TPC
The results of the investigated effect of DT on PMC (Figure )), TPC (Figure )), PTC (Figure )) and CHC (Figure )) demonstrated that increase in DT from 40°C to 80°C resulted in decreased amount of moisture or water retained in the dried product (i.e. decrease in the PMC), which thereby led to reduced TPC and increased concentration of the PTC and CHC (see Experimental Run 1 and 5; 2 and 6; 3 and 7; 4 and 8; 9 and 13; 10 and 14; 11 and 15; 12 and 16; and 21 and 22). This is as a result of increased moisture evaporation from the fresh okra samples due to increased temperature (thermal) gradient between the material and drying air, which resulted in increased heat transfer or driving force for moisture evaporation (Md Saleh et al., Citation2020; Sidhu et al., Citation2019). That is, a rise in DT had a significant (p < 0.05) negative linear effect on the PMC and TPC as well as a significant positive linear effect on PTC and CHC (see, Table ). Also, the low PMC in the dried okra product due to increased DT will largely suppress and prevent or delay microbial growth (Abdel-Hameed et al., Citation2017; Alp & Bulantekin, Citation2021) and thus the reduction in the TPC (microbial load). In addition, as the quantity of moisture removed rises with increasing DT, the PTC and CHC became more concentrated (Garba & Oviosa, Citation2019) and thus a rise in the PTC and CHC. This indicates that PTC and CHC were still quite thermally stable up to 80°C. A decrease in moisture content due to increase in drying temperature in the course of fruits and vegetables drying has been observed and reported by several researchers (Bhong & Kale, Citation2020; P. M. R. Correia et al., Citation2017; Shishir et al., Citation2016; Silva et al., Citation2017; Taheri-Garavand & Meda, Citation2018), while a similar observation of a decrease in microbial load due to low PMC induced by higher DT has been reported for the drying of green onions (Martinazzo et al., Citation2016), roselle (Abdel-Hameed et al., Citation2017) and tomato (Dauda et al., Citation2019). A similar observation has been reported for Moringa leaves dried at 30–60°C (Ayegba et al., Citation2017) and cabbage dried at 80°C (Duarte et al., Citation2019). In contrast, Famurewa and Olumofin (Citation2015) reported a decrease in PTC as well as an increase in CHC with steady rise in DT (40–60°C) for okra drying, while Pendre et al. (Citation2012) observed an initial increase in PTC as DT increased from 50°C to 60°C and above 60°C, it then gradually decreased. The reason(s) for the difference in the effect of DT on PTC in this study in comparison with the observation of Famurewa and Olumofin (Citation2015) may probably be due to the type of drying method employed (Duarte et al., Citation2019) and type of okra variety utilized (Babanovska-Milenkovska et al., Citation2016).
The results depicting the investigated effect of RH on PMC (Figure )), TPC (Figure )), PTC (Figure )), and CHC (Figure )) revealed that increase in the RH from 60% to 80% resulted in high residual moisture content in the product (i.e. increase in the amount of moisture (PMC) that was retained in the dried okra), which in turn resulted in increased TPC and decreased concentration of the PTC and CHC (i.e. less concentrated PTC and CHC) as a result of the decrease in moisture evaporation from the fresh okra samples (see Experimental Run 1 and 3; 2 and 4; 5 and 7; 6 and 8; 9 and 11; 10 and 12; 13 and 15; 14 and 16; and 19). That is, increased RH had a significant (p < 0.05) positive linear or main impact on the PMC and TPC as well as significant (p < 0.05) negative linear effect on PTC and CHC (see, Table ). At higher RH, heat and mass transfer is low and thus moisture loss from the okra sample is low. The high PMC of dried okra subsequently led to its high TPC. This is due to the fact that moderate to high PMC supports microbial growth (Gomez et al., Citation2022). Agnihotri et al. (Citation2017) reported that relative humidity at constant temperature has significant effect on moisture content as it controls the rate of moisture transport from the surface of the material to the air (or environment). Taheri-Garavand and Meda (Citation2018) have reported similar observation of a decrease in moisture content for the drying of savory leaves using a forced convective dryer.
Furthermore, the results of the effect of DRT carried out on PMC (Figure )), TPC (Figure )), PTC (Figure )) and CHC (Figure )) indicated that an increase in DRT from 90 min to 450 min resulted in decreased or low PMC in the dried okra due to increasing moisture removal from the fresh okra samples which in turn led to low TPC and increased PTC and CHC (see Experimental Run 1 and 9; 2 and 10; 3 and 11; 4 and 12; 5 and 13; 6 and 14; 7 and 15; 8 and 16; 23 and 24; and 23 and 25). This means that increased DRT displayed a significant (p < 0.05) negative linear effect on PMC and TPC as well as a significant (p < 0.05) positive linear effect on PTC and CTC (see, Table ). Zhao et al. (Citation2017) and Senadeera et al. (Citation2020) have reported similar observation of a reduced PMC due to increasing DRT for the drying of squid-laver snack and persimmon slices, respectively.
From the results presented in (Figure )), the values of the final PMC ranged from 6.88% to 47.0%, while the final TPC ranged from 19.80 to 49.30 CFU/g. The final TPC values of the dried okra product were found to be lower than 2.85 × 10⁵ CFU/g obtained for the fresh okra. The high TPC (microbial load) observed in the fresh okras utilized in this study may be a reflection of the conditions of storage and how long these fresh okras were kept before they were obtained for drying. Nevertheless, the observed difference between the dried okra product value and the fresh okra product value may be attributed to the synergistic effects of thermal inactivation and dehydration inactivation based on temperature intensity, drying environment characteristics (such as relative humidity), and drying time (Bourdoux et al., Citation2016; Dauda et al., Citation2019). The high moisture content of the fresh okra, which invariably means high water activity might be responsible for the observed high TPC. This is because microorganisms thrive more in such a favorable moisture environment. The TPC values of the dried okra product are within the accepted range of <105 CFU/g specified for fruits and vegetables by the International Commission on Microbiological Specification for Foods (ICMSF; Van Schothorst, Citation1998), thus the dried okra products are within the limit acceptable for consumption. The results of the low TPC (microbial load) obtained for the dried okra in this study are similar to the TPC values of 8 − 11 CFU/g obtained by Dauda et al. (Citation2019) for tomato samples dried at temperature range of 50–60°C using oven drying method. Also, as observed from the results in (Figure )), the final PTC and CHC values of the dried okra slices obtained at the varying DT (40–80°C) with respect to other drying process parameters ranged from 4.88–8.50% to 28.30–32.22%, respectively. These values are relatively greater than the PTC (2.51%) and CHC (7.39%) values obtained for the fresh okra. This observation indicates that at the range of the different drying process parameters employed in this work, the PTC and CHC present in the fresh okra after the drying process were relatively and highly retained or preserved in the dried okra product.
3.2. Mathematical modelling
Modelling of the effects or influence of the drying process parameters (AV, RH, DT and DRT) on the response variables was performed by adjusting or fitting the drying data to Eq. (2). The coefficients of the model equations obtained are presented in Table . Therefore, the mathematical model equations derived for PMC, PTC, CHC and TPC as a function of AV, RH, DT, and DRT are EquationEq. (3(3)
(3) ), EquationEq. (4
(4)
(4) ), EquationEq. (5
(5)
(5) ), and EquationEq. (6
(6)
(6) ), respectively. The equations included all the significant and insignificant model terms.
Where represent the AV, RH, DT, and DRT, respectively.
In order to test the fit of the model, variance analysis (ANOVA) where the Fischer test (F-value), probability value (p-value) and coefficient of determination (being a measure of fit goodness) were determined and evaluated (Table ). It is to be noted that a coefficient with negative sign depicts an antagonistic influence or impact, while coefficient with positive sign is indicative of a synergistic impact or effect (Taheri-Garavand et al., Citation2017).
For the PMC, PTC, CHC, and TPC, respective of 0.9871, 0.9921, 0.9885, and 0.9799; Adjusted (Adj) of 0.9751, 0.9847, 0.9777, and 0.9611; and Predicted (pred) of 0.9259, 0.9545, 0.9336, and 0.8841 were obtained. The relatively high values obtained show a high degree of correlation between the observed experimental value and predicted values. The respective “Pred of 0.9259, 0.9545, 0.9336, 0.8841 are in reasonable agreement with the corresponding “Adj of 0.9751, 0.9847, 0.9777, and 0.9611; and thus the model is adequate. The Model F-values of 82.2, 134.5, 91.8, and 52.2 respectively estimated for PMC, PTC, CHC, and TPC of okra samples obtained during cabinet hot drying implies that the quadratic regression models are significant (Table ). The ANOVA for the quadratic regression model revealed that the model was highly significant, as evident from the very low probability value (<0.0001) of the F-test. In addition, values of Prob > F lower than 0.05 indicate that the terms of the model are significant and values higher than 0.1000 reveal that the terms of the model are insignificant. Hence, the linear terms are significant model terms in each of the quadratic regression model equations for PMC, PTC, CHC, and TPC, respectively. Therefore, AV, RH, DT, and DRT respectively had significant linear or main effect on PMC, TPC, PTC and CHC. More also, it was generally observed that DRT exerted more pronounced linear effect (higher coefficient values) on PMC, TPC, PTC and CHC, respectively. That is, both the PMC and TPC of okra were mostly and negatively influenced by DRT followed by DT, AV and positively influenced by RH; while the PTC and CHC were mostly and positively impacted by DRT and then followed by DT and AV as well as negatively influenced by RH. Taheri-Garavand et al. (Citation2017) have similarly observed that DT, AV and DRT had significant negative linear effect on the moisture content of dried banana. The authors also observed that DRT had more pronounced linear effect on dried banana moisture content, followed by AV and DT, respectively.
3.3. Evaluation of the influence of variables interaction on dried okra quality-traits
The quadratic regression model equations (i.e., EquationEq. 3(3)
(3) , Equation4
(4)
(4) , Equation5
(5)
(5) and Equation6
(6)
(6) ) showed that in the HAD of okra, the PMC and TPC was each influenced negatively by the interaction effect of AV and RH, AV and DT, AV and DRT as well as the interaction effect of DT and DRT. While it was positively influenced by the interaction effect of RH and DRT. The PTC and CHC in the okra were positively influenced by the interaction effect of AV and RH, AV and DRT, AV and DRT as well as the interaction effect of DT and DRT. While they were negatively influenced by the interaction effect of RH and DRT. The interaction of DT and DRT exerted more pronounced negative influence (due to higher coefficient) on PMC and TPC in the okra, while it exerted more pronounced positive influence on PTC and CHC than the interaction effect of other variables. This was relatively followed by the interaction effect of AV and DT.
The three dimensional (3D) graphical representation of the responses are shown in (Figures ) to assist in visualizing the effect of AV, RH, DT and DRT on the PMC, PTC, CHC, and TPC of the dried okra. The interaction effect of RH and AV on PMC, PTC, CHC, and TPC are illustrated in Figure ).
Figure 3. Three dimensional (3D) response surface plot indicating the interaction effect of RH and AV on (a) PMC (b) TPC (c) PTC (d) CHC during the okra drying process.
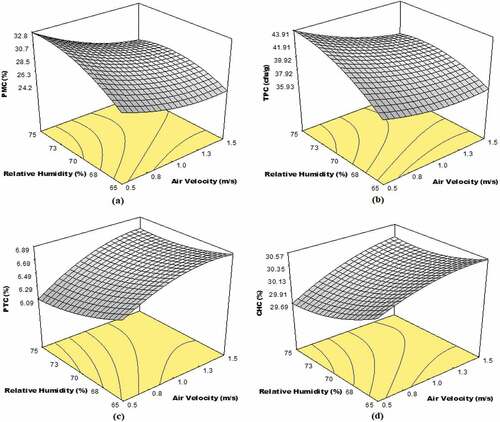
Since the objective functions are to minimize PMC and TPC as well as to maximize PTC and CHC, Figure shows that at a fixed DT (60°C) and DRT (270 min), decrease in RH with simultaneous increase in the AV resulted in a decrease in the PMC (Figure )) as well as a decrease in the TPC (Figure )), while it led to increase in concentrating the PTC (Figure )) and CHC (Figure )) of the dried okra, respectively. This observation indicates that at a higher AV and lower RH, the PMC as well as the TPC will be low as a result of more moisture being removed from the sample; while the PTC and CHC will both be high due to their been concentrated as a result of moisture or water loss (Garba & Oviosa, Citation2019). On the other hand, at a low AV and high RH, the PMC and the TPC will be high as a result of low moisture being removed while the PTC and CHC will both be low, though still higher than the value for fresh okra.
The interaction effect between AV and DT on PMC, PTC, CHC, and TPC are depicted in Figure ).
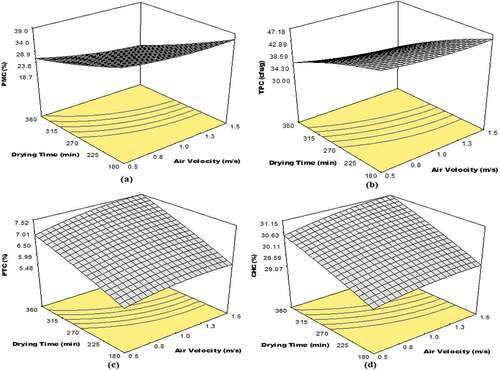
Figure 4. Three dimensional (3D) response surface plot indicating the interaction effect of DT and AV on: (a) PMC (b) TPC (c) PTC (d) CHC during okra drying process.
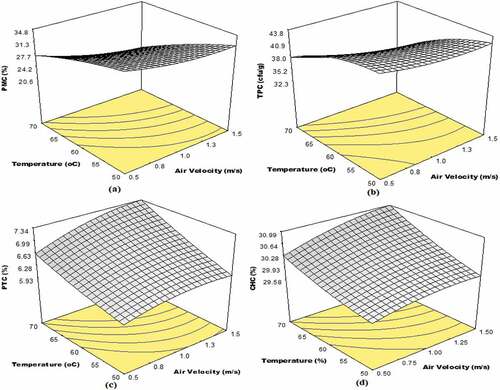
The 3D response surface plot for PMC, TPC, PTC and CHC (Figure ) indicates that at a fixed RH (70%) and DRT (270 min), the PMC (Figure )) as well as the TPC (Figure )) of the dried okra decreases, while the PTC (Figure )) and CHC (Figure )) rises with increase in both AV and DT. This 3D response plot reveals that both the AV and DT have individual negative influence on the PMC and TPC of okra. However, the impact of DT is more than that of AV. A similar report was made for the drying of dark red onions (Silva et al., Citation2017). In addition, the 3D plot also depicts that both AV and DT have individual positive influence on the PTC and CHC of the okra. However, the impact of DT is more than that of AV. Thus, Figure ) suggests that at a fixed RH and DRT, the AV and DT have to be relatively increased so as to obtain a dried okra product that will possess a lower PMC, TPC and a higher PTC and CHC.
Figure ) shows the 3D response surface plot of the effect of interaction between AV and DRT on the PMC, TPC, PTC and CHC of dried okra.
Figure 5. Three dimensional (3D) response surface plot indicating the interaction effect of DRT and AV on: (a) PMC (b) TPC (c) PTC (d) CHC during okra drying process.
There is a negative mutual impact of AV and DRT on the PMC and TPC as well as a positive mutual impact on the PTC and CHC of the dried okra (EquationEq. (3(3)
(3) -Equation6
(6)
(6) )). The plot in Figure demonstrates that at a fixed RH (70%) and DT (60°C), both the PMC (Figure )) and TPC (Figure )) decrease while the PTC (Figure )) and CHC (Figure )) of dried okra increases as the AV and DRT simultaneously increase. That is, a lower PMC and a lower TPC as well as a higher PTC and CHC of dried okra product will be obtained at a higher AV and a higher DRT. DRT exerted more negative influence on both the PMC and the TPC than the AV, while it exerted more positive influence on the PTC and the CHC than the AV.
The interaction effects between RH and DRT on PMC, PTC, CHC, and TPC are illustrated in Figure ).
Figure 6. Three dimensional (3D) response surface plot indicating the interaction effect of DRT and RH on: (a) PMC (b) TPC (c) PTC (d) CHC during the okra drying process.
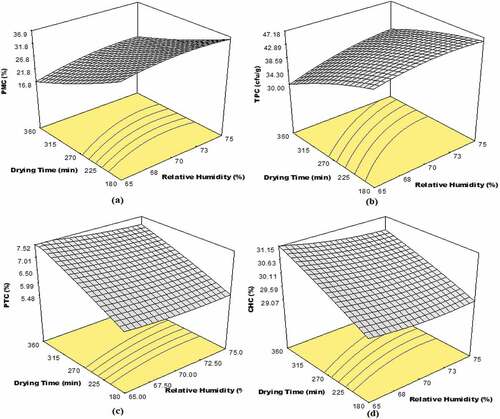
The 3D response surface plot for PMC, TPC, PTC and CHC (Figure ) indicates that at a fixed AV (1 m/s) and DT (60°C), the PMC (Figure )), as well as the TPC (Figure )) of the dried okra decreases while the PTC (Figure )) and CHC (Figure )) increase with decrease in RH and increase in DRT. This 3D response plot demonstrates that the RH has a positive influence and the DRT has a negative influence on the PMC and TPC of dried okra and their interaction effect is positive. However, the impact of DRT is higher than that of the RH. In addition, the 3D plot also reveals that the RH has a negative influence and the DRT has a positive influence on the PTC and CHC of the dried okra and their interaction effect is negative. Nevertheless, the impact of DRT is higher as compared to RH. Thus, Figure )–(d) suggests that at a fixed AV and DT, the RH has to be decreased while the DRT has to be increased to obtain dried okra products that are having lower PMC, TPC, and higher PTC and CHC.
Figure ) shows the 3D response surface plot of the effect of interaction between DT and DRT on the PMC, TPC, PTC and CHC of dried okra.
Figure 7. Three dimensional (3D) response surface plot indicating the interaction effect of DRT and DT on: (a) PMC, (b) TPC, (c) PTC and (d) CHC during okra drying process.
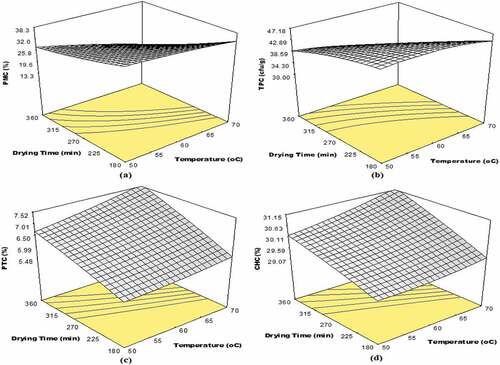
There is a negative mutual impact of DT and DRT on the PMC and TPC as well as a positive mutual impact on the PTC and CHC of the dried okra (EquationEq. (3-6)(3)
(3) ). The plots in Figure shows that the drying of okra at a fixed AV (1 m/s) and RH (70%), both the PMC (Figure )) and TPC (Figure )) decrease while the PTC (Figure )) and the CHC (Figure )) of dried okra increase with simultaneous increase in the DT and DRT. That is, dried okra products with lower PMC, TPC, and higher PTC and CHC will be obtained if fresh okras are subjected to drying at a higher DT and longer DRT. Nevertheless, if the DT is too high and DRT is too long, hardening will occur and a casing will be formed. This is because moisture will be removed from the vegetable surface more rapidly as it is been dried than water will diffuse from the moist interior of the vegetable (Zhao et al., Citation2017). On the other hand, a low DT and short DRT will not effectively remove the moisture as to reach the PMC that is required. In addition, extreme DT and DRT can result in serious damage to product nutrients, colour and flavor as well as reduce the dried product rehydration capacity (A. F. K. Correia et al., Citation2015). DRT exerted more negative influence on the PMC and TPC than the DT, while it exerted more positive influence on the PTC and CHC than the DT. A similar observation of a decrease in moisture content with simultaneous increase in both the drying time and drying temperature has been reported for squid-laver snack by Zhao et al. (Citation2017).
3.4. Okra drying process optimization and verification
Predicted optimum drying conditions for the production of dried okra products were determined using the numerical optimization tool of Design Expert (6.08) statistical software based on desirability function. According to this tool, the target goal for AV, RH, DT and DRT was each set in the ranges that were investigated. The responses (PMC and TPC) were set on minimize, while PTC and CHC were each set on maximize. The predicted drying process conditions with the highest desirability were selected and then experimentally verified. The respective predicted optimum values for AV, RH, DT and DRT as presented in Table were found to be 1.64 m/s, 60%, 55°C, and 450 min required to produce dried okra products with minimum PMC (5%), minimum TPC (10.30 CFU/g), maximum PTC (8.54%) and maximum CHC (32.41%). The desirability function was 1.000.
Table 3. Optimization and verification of PMC, TPC, PTC and CHC
Verification experiment was carried out at these above predicted optimum drying process conditions to verify the predicted minimum PMC, minimum TPC, maximum PTC, and maximum CHC. From the verification experiment, the minimum PMC, minimum TPC, maximum PTC and maximum CHC obtained for the dried okra were 5.2%, 11.00 CFU/g, 8.64%, and 32.52%, respectively (Table ). The percent errors between predicted and validated experimental or actual values calculated according to EquationEq. (1)(1)
(1) were found to be-4%, -6.80%, -1.17% and -0.34% (Table ) which explicitly indicated that there are no significant differences between them.
4. Conclusions
Response surface methodology was effectively used to describe the effect of drying conditions in the retention and preservation of carbohydrate and protein and also, the decline of moisture content and total plate count. The most significant drying conditions that exerted more pronounced linear and interactive effect on the moisture content, protein content, carbohydrate content and total plate count of okra in the course of drying are drying time and drying temperature while the least significant are air velocity as well as relative humidity. The drying treatment at the different drying process parameters generally concentrated and retained the protein and carbohydrate contents (nutritional properties) in the dried okra products as well as reduced the okra product microbial load to an acceptable limit allowed for consumption. The optimized drying conditions for minimum PMC and minimum TPC as well as maximum PTC and maximum CHC quality traits were obtained as DT, 55°C; AV, 1.64 m/s: RH, 60% and DRT, 450 min. However, further studies will be performed in our laboratory to evaluate the effects of physical and chemical pretreatments, air velocity distribution pattern inside the dryer, temperature and drying time on the nutritional and microbial qualities of different varieties of okra using different types of drying equipment.
Acknowledgements
The authors wish to thank the management of Federal Institute of Industrial Research, Oshodi, Nigeria for making available some of the measuring instruments used for this study.
Disclosure statement
No potential conflict of interest was reported by the author(s).
Additional information
Funding
References
- Abdel-Hameed, S. M., Abdel-Raouf, R. M., & Abdel-Aleem, W. M. (2017). Drying kinetics, quality attributes and moisture sorption isotherms during storage of Roselle (Hibiscus sabdariffa) dried under solar drying conditions. Egyptian Journal of Food Science, 45, 43–21. https://ejfs.journals.ekb.eg/article_20387_dcfac5ce431b056a60ad76bd8d84b64b.pdf
- Agarry, S. E., Osuolale, F. N., Agbede, O. O., Ajani, A. O., Afolabi, T. J., Ogunleye, O. O., Ajuebor, F., & Owabor, C. N. (2021). Transport phenomena, thermodynamic analyses, and mathematical modelling of okra convective cabinet-tray drying at different drying conditions. Engineering and Applied Science Research, 48(5), 637–656. https://ph01.tci-thaijo.org/index.php/easr/article/view/243546
- Agnihotri, V., Jantwal, A., & Joshi, R. (2017). Determination of effective moisture diffusivity, energy consumption and active ingredient concentration variation in Inula racemosa, rhizomes during drying. Industrial Crop and Products, 106, 40–47. https://doi.org/10.1016/j.indcrop.2016.09.068
- Ajayeoba, A. O., Samson, O. F., & Olawale, W. A. (2014). Design and development of a domestic biscuit cabinet tray dryer. International Journal of Engineering Research and Applications, 4(3), 13–20.
- Alp, D., & Bulantekin, Ö. (2021). The microbiological quality of various foods dried by applying different drying methods: A review. European Food Research and Technology, 247(6), 1333–1343. https://doi.org/10.1007/s00217-021-03731-z
- AOAC (Association of Official Analytical Chemists). (2019). Official Methods of Analysis (21st ed.). AOAC International.
- Aworanti, O. A., Agarry, S. E., & Ogunleye, O. O. (2017). Biomethanization of cattle manure, pig manure and poultry manure mixture in co-digestion with waste of pineapple fruit and content of chicken-gizzard- Part II: Optimization of process variables. The Open Biotechnology Journal, 11(1), 54–71. https://doi.org/10.2174/1874070701711010054
- Ayegba, C., Makinde, O., Obigwa, P., & Orijajogun, J. (2017). Effect of drying temperature on nutritional content of moringa oleifera leave. World Journal of Food Science and Technology, 1(3), 93–96.
- Babanovska-Milenkovska, F., Karakasova, L., Petanovska-Ilievska, B., Manasievska-Simic, S., Miskoska-Milevska, E., Velkoska-Markovska, L., & Jankulovska, M. (2016). Change in the quality properties of two different pepper varieties in fresh and dried condition. Journal of International Science Publication of Agriculture & Food, 4, 250–259.
- Baltacıoğlu, C. (2017). Optimization of drying and osmotic dehydration of asparagus officinalis in microwave and conventional hot air oven using response surface methodology. Carpathian Journal of Food Science and Technology, 9(3), 5–16.
- Bhong, M. G., & Kale, V. M. (2020). Drying mechanism of Indian dark red onion slices at high velocity. AIMS Agriculture and Food, 5(2), 245–261. https://doi.org/10.3934/agrfood.2020.2.245
- Bourdoux, S., Li, D., Rajkovic, A., Devlieghere, F., & Uyttendaele, M. (2016). Performance of drying technologies to ensure microbial safety of dried fruits and vegetables. Comprehensive Review of Food Science and Food Safety, 15(6), 1056–1066. https://doi.org/10.1111/1541-4337.12224
- Correia, P. M. R., Guiné, R., Correia, A. C., Gonçalves, F., Brito, M. F. S., & Ribeiro, J. R. P. (2017). Physical, chemical and sensory properties of kiwi as influenced by drying conditions. Agricultural Engineering International: CIGR Journal, 19(3), 203–212.
- Correia, A. F. K., Loro, A. C., Zanatta, S., Spoto, M. H. F., & Vieira, T. M. F. S. (2015). Effect of temperature, time, and material thickness on the dehydration process of tomato. International Journal of Food Science, 970724, 7.
- Dantas, T. L., Alonso Buriti, F. C., & Florentino, E. R. (2021). Okra (Abelmoschus esculentus L.) as a potential functional food source of mucilage and bioactive compounds with technological applications and health benefits. Plants, 10(8), 1683. https://doi.org/10.3390/plants10081683
- Das, A. K., Sultana, Z., Kabir, A., & Kabir, S. (2018). Effect of washing on reducing bacterial loads in common vegetables sold in Dhaka City. Bangladesh Journal of Microbiology, 35(2), 96–101. https://doi.org/10.3329/bjm.v35i2.42637
- Dauda, A., Abiodun, O., Salami, T., & Akintayo, O. (2019). Chemical and microbiological evaluation of dried tomato slices for Nigerian system. Global Journal of Nutrition and Food Science, 1(5), 1–4. https://doi.org/10.33552/GJNFS.2019.01.000521
- Dey, A., Singhal, S., Rasane, P., Kaur, S., Kaur, N., & Singh, J. (2019). Comparative kinetic analysis of convective and vacuum dried Opuntia ficus-indica (L.) Mill. cladodes. Research in Agricultural Engineering, 65(No. 1), 1–6. https://doi.org/10.17221/18/2018-RAE
- Dimitrios, A. T., Alenxandros, P. V., Achilleas, V. B., Andronikos, E. F., & Dionissio, P. M. (2012). Airflow patterns in a laboratory batch-type, tray air dryer. Proceedings of 5th International Conference from Scientific Computing to Computational Engineering, Greece.
- Dixit, A., Upadhyay, A., & Mishra, A. (2018). Process optimization for the development of low fat fried Indian traditional snack using response surface approach. Carpathian Journal of Food Science and Technology, 10(3), 57–71.
- Dos Santos, F. S., de Figueirêdo, R. M. F., Queiroz, A. J. D. M., De lima, A. R. C., & de Lima, T. L. B. (2021). The effect of temperature on the okra drying process: Kinetic study and physical properties of powders. Australian Journal of Crop Science, 15(5), 649–660. https://doi.org/10.21475/ajcs.21.15.05.p2919
- Duarte, C., Sousa, P., Rocha, S., Pinheiro, R., & Vaz Velho, M. (2019). The effect of different drying processes on physicochemical characteristics and antioxidant activity of brassica spp. cultivars from Northern Atlantic Portugal. Chemical Engineering Transactions, 75, 421–426. https://doi.org/10.3303/CET1975071
- Famurewa, J. A., & Olumofin, K. M. (2015). Drying kinetics and influence on the chemical characteristics of dehydrated okra (Abelmoschus esculentus) using cabinet dryer. European Journal of Engineering and Technology, 3(2), 7–19.
- Ganje, M., Jafari, S. M., Farzaneh, V., & Malekjani, N. (2018). Kinetics modelling of color deterioration during thermal processing of tomato paste with the use of response surface methodology. Heat and Mass Transfer, 54(12), 3663–3671. https://doi.org/10.1007/s00231-018-2394-3
- Garba, U., Kaur, S., Gurumayum, S., & Rasane, P. (2015). Effect of hot water blanching time and drying temperature on the thin layer drying kinetics of and anthocyanin degradation in black carrot (Daucus carota L.) shreds. Food Technology and Biotechnology, 53(3), 324–330. https://doi.org/10.17113/ftb.53.03.15.3830
- Garba, Z. N., & Oviosa, S. (2019). The effect of different drying methods on the elemental and nutritional composition of Vernonia amygdalina (bitter leaf). Journal of Taibah University for Science, 13(1), 396–401. https://doi.org/10.1080/16583655.2019.1582148
- Gomez, S., Kuruvila, B., Maneesha, P. K., & Joseph, M. (2022). Variation in physico-chemical, organoleptic and microbial qualities of intermediate moisture pineapple (Ananas comosus (L.) Merr.) slices during storage. Food Production, Processing and Nutrition, 4(5), 1–11. https://doi.org/10.1186/s43014-022-00084-2
- Guiné, R. P. F. (2018). The Drying of foods and its effect on the physical-chemical, sensorial and nutritional properties. International Journal of Food Engineering, 4(2), 93–100.
- Huang, J., & Zhang, M. (2016). Effect of three drying methods on the drying characteristics and quality of okra. Drying Technology, 34(8), 900–911. https://doi.org/10.1080/07373937.2015.1086367
- Hussein, J. B., Ilesanmi, J. O. Y., Filli, K. B., & Sanusi, M. S. (2018). Effects of drying methods on the chemical properties of okra (Abelmoschus esculentus L. Moench) slices. Current Journal of Applied Science and Technology, 26(6), 1–10. https://doi.org/10.9734/CJAST/2018/38796
- Isnawaida, Y., N, F., Prahesti, K. I., Malaka, R., & Hajrawati, (2021). Detection of coliform bacteria, total plate count and pH value in chicken eggs from Maros traditional market. IOP Conference Series: Earth and Environmental Science, 788, 012158.
- Kumar, D., Prasad, S., & Murthy, G. S. (2014). Optimization of microwave-assisted hot air drying conditions of okra using response surface methodology. Journal of Food Science and Technology, 51(2), 221–232. https://doi.org/10.1007/s13197-011-0487-9
- Li, H., Xie, L., Ma, Y., Zhang, M., Zhao, Y., & Zhao, X. (2019). Effects of drying methods on drying characteristics, physicochemical properties and antioxidant capacity of okra. LWT-Food Science and Technology, 101, 630–638. https://doi.org/10.1016/j.lwt.2018.11.076
- Maghfiroh, L., Estoepangestie, A. T. S., Nurhajati, T., & Harijani, N. (2021). Total plate count of commercial pasteurized milk sold by street vendors in Mulyorejo Sub-District Surabaya. Journal of Halal Product and Research, 4(2), 56–61. https://doi.org/10.20473/jhpr.vol.4-issue.2.65-70
- Martinazzo, A. P., Correa, F., Luiz, C., & Berbert, P. A. (2016). Drying kinetics and microbiological quality of green onions. Revista Ceres, 63(6), 769–774. https://doi.org/10.1590/0034-737x201663060004
- Md Saleh, R., Kulig, B., Hensel, O., & Sturm, B. (2020). Investigation of dynamic quality changes and optimization of drying parameters of carrots (Daucus carota var. laguna). Journal of Food Process Engineering, 43(2), e13314. https://doi.org/10.1111/jfpe.13314
- Menon, A., Stojceska, V., & Tassou, S. A. (2020). Systematic review on the recent advances of the energy efficiency improvements in non-conventional food drying technologies. Trends in Food Science & Technology, 100, 67–76. https://doi.org/10.1016/j.tifs.2020.03.014
- Nurkhoeriyati, T., Kulig, B., Sturm, B., & Hensel, O. (2021). The effect of pre-drying treatment and drying conditions on quality and energy consumption of hot air-dried celeriac slices: Optimisation. Foods, 10(8), 1758. https://doi.org/10.3390/foods10081758
- Nwakuba, N. R., Chukwuezie, O. C., Asonye, G. U., & Asoegwu, S. N. (2018). Energy analysis and optimization of thin layer drying conditions of okra. Arid Zone Journal of Engineering, Technology and Environment, 14(SP.i4), 129–148. https://azojete.com.ng/index.php/azojete/article/view/260
- Okunola, A., Adekanye, T., & Idahosa, E. (2021). Energy and exergy analyses of okra drying process in a forced convection cabinet dryer. Research in Agricultural Engineering, 67(No. 1), 8–16. https://doi.org/10.17221/48/2020-RAE
- Olajire, A. S., Tunde-Akintunde, T. Y., & Ogunlakin, G. O. (2018). Drying kinetics and moisture diffusivity study of okra slice. Journal of Food Processing and Technology, 9, 751–757. https://www.walshmedicalmedia.com/open-access/drying-kinetics-and-moisture-diffusivity-study-of-okro-slice-37277.html
- Omolola, A. O., Jideani, A. I. O., & Kapila, P. F. (2017). Quality properties of fruits as affected by drying operation. Critical Review of Food Science and Nutrition, 57(1), 95–108. https://doi.org/10.1080/10408398.2013.859563
- Onwude, D. I., Iranshahi, K., Rubinetti, D., Schudel, S., Schemminger, J., Martynenko, A., & Defraeye, T. (2022). How much do process parameters affect the residual quality attributes of dried fruits and vegetables for convective drying? Food and Bioproducts Processing, 131, 176–190. https://doi.org/10.1016/j.fbp.2021.11.005
- Owolarafe, O. K., Bello, T. K., Ogunsina, B. S., Falana, O. B., Adetifa, B. O., & Ogunseeyin, O. (2021). Performance evaluation of a small-scale dryer for agricultural products. Agricultural Engineering International: CIGR Journal, 23(3), 261–270.
- Pendre, N. K., Nema, P. K., Sharma, H. P., Rathore, S. S., & Kushwah, S. S. (2012). Effect of drying temperature and slice size on quality of dried okra (Abelmoschus esculentus (L.) Moench). Journal of Food Science and Technology, 49(3), 378–381. https://doi.org/10.1007/s13197-011-0427-8
- Ragab, G. M., El-Barrawy, M. A., & Meheissen, M. A. (2020). Evaluation of the microbial quality of food served in a University Hospital in Alexandria. Journal of High Institute of Public Health, 50(2), 101–105. https://doi.org/10.21608/jhiph.2020.109128
- Samakradhamrongthai, R. S., Nortuy, N., Jannu, T., Supawan, T., Chanakun, P. et al. (2022). Influence of three drying methods on physicochemical properties of okra (Abelmoschus esculentus L.) powder. Journal of Food Processing and Preservation, 46(3), e16381. https://doi.org/10.1111/jfpp.16381
- Samakradhamrongthai, R. S., Nortuy, N., Jannu, T., Supawan, T., Chanakun, P., Yimkaew, Y., & Renaldi, G. (2022). Influence of three drying methods on physicochemical properties of okra (Abelmoschus esculentus L.) powder. Journal of Food Processing and Preservation, 46(3), 1–9. https://doi.org/10.1111/jfpp.16381
- Sasongko, S. B., Hadiyanto, H., Djaeni, M., Perdanianti, A. M., & Utari, F. D. (2020). Effects of drying temperature and relative humidity on the quality of dried onion slice. Heliyon, 6(7), e04338. https://doi.org/10.1016/j.heliyon.2020.e04338
- Senadeera, W., Adiletta, G., Önal, B., Di Matteo, M., & Russo, P. (2020). Influence of different hot air drying temperatures on drying kinetics, shrinkage, and colour of persimmon slices. Foods, 9(1), 101–112. https://doi.org/10.3390/foods9010101
- Shishir, M. R. I., Taip, F. S., Aziz, A., Talib, R. A., & Sarker, S. H. (2016). Optimization of spray drying parameters for pink guava powder using RSM. Food Science and Biotechnology, 25(2), 461–468. https://doi.org/10.1007/s10068-016-0064-0
- Sidhu, G. K., Singh, M., & Kaur, P. (2019). Effect of operational parameters on physicochemical quality and recovery of spray‐dried tomato powder. Journal of Food Processing and Preservation, 43(10), e14120. https://doi.org/10.1111/jfpp.14120
- Silva, B. G., Fileti, A. M. F., Foglio, M. A., Rosa, P. D. T. V., & Taranto, O. P. (2017). Effects of Different Drying Conditions on Key Quality Parameters of Pink Peppercorns (Schinus terebinthifolius Raddi). Journal of Food Quality, 2017, 1–12. https://doi.org/10.1155/2017/3152797
- Singhal, S., Rasane, P., Kaur, S., Singh, J., & Gupta, N. (2020). Thermal degradation kinetics of bioactive compounds in button mushroom (Agaricus bisporus) during tray drying process. Journal of Food Process Engineering, 43(12), e13555. https://doi.org/10.1111/jfpe.13555
- Taheri-Garavand, A., Karimi, F., Karimi, M., Lotfi, V., & Khoobbakht, G. (2017). Hybrid response surface methodology–artificial neural network optimization of drying process of banana slices in a forced convective dryer. Food Science and Technology International, 24(4), 277–291. https://doi.org/10.1177/1082013217747712
- Taheri-Garavand, A., & Meda, V. (2018). Drying kinetics and modeling of savory leaves under different drying conditions. International Food Research Journal, 25(4), 1357–1364. https://doi.org/10.1177/1082013217747712
- Tamboli, F. A., More, H. N., Bhandugare, S. S., Patil, A. S., Jadhav, N. R. et al. (2020). Estimation of total carbohydrate content by phenol sulphuric acid method from Eichhornia crassipes (Mart.) Solms. Asian Journal of Research in Chemistry, 13(5), 357–359. https://doi.org/10.5958/0974-4150.2020.00067.X
- Van Schothorst, M. (1998). International commission on microbiological specification for foods) principles for the establishment of microbiological food safety objectives and related control measures. Food Control, 9(6), 379–384. https://doi.org/10.1016/S0956-7135(98)00129-7
- Yolmeh, M., & Jafari, S. M. (2017). Applications of response surface methodology in the food industry processes. Food and Bioprocess Technology, 10(3), 413–433. https://doi.org/10.1007/s11947-016-1855-2
- Zhao, -C.-C., Jiang, G.-H., & Eun, J.-B. (2017). Optimization of drying process for squid-laver snack by a combined method of fuzzy synthetic and response surface methodology. Journal of Food Quality, 2017(Article ID 9761356), 1–10. https://doi.org/10.1155/2017/9761356
- Zielinska, M., & Michalska, A. (2016). Microwave-assisted drying of blueberry (Vaccinium corymbosum L.) fruits: Drying kinetics, polyphenols, anthocyanins, antioxidant capacity, colour and texture. Food Chemistry, 212(1), 671–680. https://doi.org/10.1016/j.foodchem.2016.06.003