
 ?Mathematical formulae have been encoded as MathML and are displayed in this HTML version using MathJax in order to improve their display. Uncheck the box to turn MathJax off. This feature requires Javascript. Click on a formula to zoom.
Abstract
The relationship between road infrastructure parameters and road crashes is not widely investigated in developing countries. The study objective is to create a measure for rating road safety performance as a tool to predict road crashes. A checklist included 184 elements categorized into nine groups, a sample of 105 selected streets in two districts with different population densities and incomes in Amman. The road elements’ safety impact was rated by two groups (professionals and non-professionals). Other data include vehicular and pedestrian traffic, speed, and road crash data. The principal component analysis was used to reduce variables and generalized linear models for the crash prediction considered the parameters or the road safety performance index as the predictors (un/extracted). The results showed that the road safety performance index in the less dense area is better than that of the densely populated. The professionals’ and non-professionals’ safety ratings did not establish a significant consensus. Modeling results indicated that using unextracted predictors poorly predicts road crashes for both the parameters and the Road-Safety-Performance-Index (RSPI). The safety-weighted predictors used in the modeling provide a valid estimate for road crashes with a high correlation of 69% for the) RSPI. Additional traffic parameters improve, to some extent, the prediction power of the RSPI-based models. The study concluded with the need to develop policies and procedures to improve road conditions and their performance, thus enhancing road safety.
1. Introduction
In 2010, United Nations (UN) General Assembly officially, through its resolution 74/299, declared the Decade of Action for Road Safety 2011–2020 to save the lives of millions by reducing global road fatalities. The resolutions requested the World Health Organization (WHO) with other UN agencies to prepare an action plan for its implementation. The action plan provides an overall framework for activities categorized into five pillars: road safety management, safer road and mobility, safer vehicles, safer road users, and post-crash response. The plan demands that countries consider these five pillars within their national road safety strategy framework but acknowledges that some countries may need to adopt an incremental approach. The plan set a target of a 50% reduction in road deaths by 2020 compared to 2010 statistics. However, WHO global road safety status report in 2018 indicates that progress in realizing this target remains insufficient as the number of road fatalities increases steadily at a constant mortality rate. WHO estimated the annual death toll in road traffic to be 1.25 million; in 2016, 1.35 million died. Later, a new resolution in 2020 was adopted (A/RES/74/299) announcing a Decade of Action for Road Safety 2021–2030, targeting further prevention of at least 50% of road traffic deaths and injuries by 2030.
1.1. Road crash contributory factors
The contributory factors for traffic accidents have been analyzed for the last five decades to enable policymakers, planners, and professionals to set up and implement plans to improve road safety. The contributory factors include road users, infrastructure, vehicles, the surrounding environment, and their interaction, which vary from country to country. A comparative study in three countries investigated the interaction of road environment, humans, and vehicle factors. It showed that human factors alone contributed to crashes by 57.1%, 63.3%, and 70.2%. In contrast, roads alone (infrastructure) contributed 3.2%, 3.3%, and 5.2% in Ireland, the USA, and the UK, respectively (National Roads Authority of Ireland, Citation2012). No similar studies were conducted in Jordan, but the leading causes of road crashes were evaluated (Al-Khateeb, Citation2010; Al-Marafi & Balbissi,, 2016Citation2016; Jadaan, Citation1997). Al-Khateeb concluded that road user behaviour, tailgating and walking on the street, is considered one of the leading causes of crashes. Khateeb looked into other high-risk factors like the road-user gender and age; further, he addressed the association between speed limits and road crashes. Road infrastructure in the vicinity of the schools and its relation to road safety were investigated, including student behaviour and involvement in conflicts. and safety improvement schemes were assessed (Shbeeb & Saleh, Citation2018).
Many research works and projects investigated road condition assessment from a safety perspective. A model was developed for Asian countries to analyze the interaction between road safety risk and the influencing factors, including finance, institutional framework, infrastructures, legislation with policy, vehicular and human impact, and trauma management (Shah et al., Citation2018). European Commission-funded research project “All-Hazard-Guide for Transport Infrastructure.” The project aimed to develop a practical guide for all-hazard for land-transport infrastructure. The work involves identifying criteria for essential transport infrastructures and all relevant hazards for transport infrastructures. The guide provides a framework for combining all hazard types with road types and rail infrastructure (Kaundinya et al., Citation2016). An online questionnaire was posted to assess the public perception of selected road safety problems in 7 EU countries. The subjects were requested to rate how safe their region’s roads were on a 7-point scale (1- I can’t entirely agree at all to 7—I agree). They were also given a set of remedial measures and asked to rate how they improve road safety. The respondents rated road safety in their region as 3.62, almost in the middle of the scale. Based on 2,956 responses, the subjects evaluated the pedestrian and bikers’ infrastructure. The best score was related to zebra crossings and sidewalks, while the worst was the number of bike lanes and bicycle racks/parking (Mikušová & Hrkút, Citation2014).
1.2. Social equity in transportation infrastructure
The social equity of the public transportation system in the USA was investigated based on job accessibility. Despite the overall low transit ridership, the findings show that low-income populations and minorities have the highest transit job accessibility. On average, accessibility differences by income are more significant than accessibility differences by race (Yeganeh et al., Citation2018). In Medellín- Colombia, a questionnaire of 187 questions covering 14 parameters was circulated over 3 years (2009–2012). A study comparing road safety in dense urban areas with lower-dense environments in the suburbs concluded that dense urban areas appear safer. The reason was attributed to the less-forgiving design treatments, including calming measures, in dense urban provide drivers with clear information on safe and appropriate operating speeds (Ewing & Dumbaugh, Citation2009). The aim is to compare changes in quality of life between three transit development zones and three non-intervention zones by considering income levels and gender. The study concluded that well-designed transit interventions could make cities more equal and climate-friendly (Milan & Creutzig, Citation2017).
1.3. Road safety performance index
The use of indices in road safety has been rapidly growing, given the complex nature of the road safety phenomenon. Worldwide research focuses on developing a benchmarking mechanism that enables interested agencies to make relevant safety performance comparisons (Akaateba, Citation2012; Arowolo et al., Citation2013; European Transport Safety Council ETSC, Citation2019; Al Haji, Citation2005; Hakkert et al., Citation2007). The use of road safety performance parameters (SPIs) was perceived as a suitable parameter for the operational conditions of the road traffic system in each of the 27 Brazilian states based on 28 indicators under three domains (road user, environment, and vehicle; Bastos et al., Citation2016). The use of the road safety index as an indicator for road and street network safety based on crash and consequence indicators and the traffic performance index, which relay on lawlessness and surveillance and traffic management indicator, was recommended (Botha, Citation2005).
A study used a composite road safety index and used apply two approaches to compare the road safety performances of 20 selected EU and African Countries. In the first method, a road safety index was developed using simple averaging techniques for cross-sectional data for 2006. The second method used the multi-regression analysis with time-series data for six years (2001–2006). Results of the study produced different country rankings of the composite road safety index from those based on the traditional rankings based on fatality rates. The study concluded that the road safety index could become an effective method of international comparisons of road safety performances (Akaateba, Citation2012).
SUNflowerNext project developed a knowledge-based framework for comprehensive benchmarking of road safety performances. A composite index includes three leading indicators (road safety, policy, and implementation performance). Principal Component Analysis (PCA) and Common Factor Analysis (FA) weighting were examined using data for 27 European countries. Fundamental indicators were weighted based on statistical models into a composite index. The composite index was used to rank the safety performance of these countries (Wegman et al., Citation2008; Wegman & Oppe, Citation2010). Further, the selection of indicators and data preparation, including weighting and aggregating indicators and ranking traffic safety conditions in 10 African countries, were investigated (Oluwole et al., Citation2013). In Italy, a road safety performance index was developed based on six-class infrastructure features: the number of occurred crashes, the density of intersections/access points on the road section; road surface irregularity; problems related to geometric design; traffic control devices; and deficiencies of roadside with related safety barriers (Vaiana et al., Citation2014). Road safety inspection as a tool order to identify all the road infrastructure-related features with poor safety conditions was used high-risk rural road in Southern Italy. Several mathematical models was developed to identify the contribution of infrastructure-related variables on the crash occurrences. The results showed that a high density of driveways and road marking gap strongly impact crash frequency (Vaiana et al., Citation2021).
1.4. Road safety performance research gaps in Jordan
Few studies addressed and compared road safety conditions in the Arab world. Human factors are investigated as risk factors (World Health Organization. Regional Office for the Eastern Mediterranean, Citation2010; WHO, Citation2018; Badr & Salamé, Citation2019). The situation does not differ when considering each Arab country individually, with Jordan as an example (Al-Majali & Imam, Citation2019; Al-Masaeid, Citation2009; Al-Omari et al., Citation2013). Other studies looked at potential road conditions improvements, including infrastructure measures (Jadaan et al., Citation2013; L.I. Shbeeb & Awad, Citation2016) or accident modelling (Al-Majali & Imam, Citation2019; Khasawneh et al., Citation2018).
2. Study objectives
The core idea of this research is to develop a tool for collision prediction based on road network physical conditions and its surrounding assessment, including its utilization by the users. Such a tool, the road safety performance index (RSPI), can be helpful to rate safety embedded in the road infrastructure once constructed or even at planning or if it has been in operation for a long time. The research will investigate the possibility of using the RSPI for crash prediction with or without traffic flow parameters like speed or traffic flow. A complementing objective is providing measures for rating the safety of the road elements and surroundings and examining the road users’ safety perception when assessing the road safety conditions and the surroundings, and if the transport professionals perceive road element safety impact differ from non-professionals. The study also explores if the users’ rating of safety impact varies by the element impact on the type of traffic being assessed (vehicular or pedestrian traffic).
3. Study area
Two districts in the capital city of Amman were selected; Basman is one of the oldest districts in the city, a dense urban area inhabitant by low-middle income groups. Zahran, one of the new city districts, is less dense in population but wealthier. Two neighborhoods were selected for data collection (Figure ). Table shows that the high densely populated area (Al-Hashmi Ash-Shamaly) is more significant in size and population, with a density that is 1.75 times of the less densely populated area (Uthainah Al Sharqi-Zahran). The road standard of the latter neighborhood is relatively better than the former, with fewer road crashes. The data were for a sample of 105 streets in two neighborhoods, each described for the roads’ conditions of one district, was defined (69 and 36 streets in the dense and low populated area, respectively). Each street was further divided into sections; the section (link) is the distance between two successive intersections.
Figure 1. Study area: Road network.
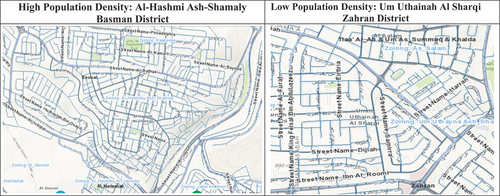
Table 1. Study area characteristics
4. Study methodology
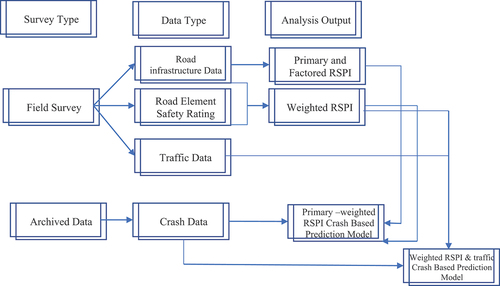
Data collection included field surveys conducted within the study area and the related archived data analyzed using different statistical tools and techniques, as shown in the following sections—a schematic framework for the survey and data collection types and the associated analysis outcome (Figure ). Road inspection survey aimed at collecting data on the infrastructure characteristics grouped into nine categories as shown below. Traffic counts and speed measurements provide data on operational conditions. The safety impact of road elements The perception of road users on the road safety impact of road elements was assessed using personal interviews of transport experts and non-professionals (laymen). The archived data is related to crash data.
Figure 2. Survey and data collection types.
5. Road infrastructure data collection
Several checklists used in road safety inspections were reviewed, adopted, and modified to suit the purpose of this study (João et al., Citation2007; Nadler et al., Citation2014; Vaiana et al., Citation2021). The developed checklist consisted of 184 elements for assessing the quality of road safety of the selected road network. The elements are categorised into the following nine parameters: road elements or adjacent facilities that are detailed in Table . The itemized checklist was used to assess the section’s safety. Each section of streets in both areas was visited and checked for each item in the list. A binary scale was used where “1” if the investigation section satisfied the tested item (exists) and “0” otherwise (does not exist).
Table 2. The description of the evaluated parameters and the associated indictors
6. Road’s element safety rating
The tested parameters were rated as existing or not existing, and all were given equal weight regardless of their impact on road safety, which may not reflect the road performance from the safety perspective. Thus, another survey was planned and executed to assess each parameter’s safety impact, rated by two focus groups, namely professionals (road/traffic experts) and non-professionals, each consisting of 16 subjects (Table ). The participants in the focus group were few due to the nature of the survey. The participants were interviewed in person. The subjects needed to allocate time to participate in the study and provide a thorough and reliable assessment after being introduced to the form and the elements they were expected to rate.
Table 3. Road safety rating surveys’ subject characteristics
Male non-professional composes more than 80% of the sample compared to 75% of the professional (Experts) group. Most of the expert group own private cars (81%), while less than two-thirds of the sample in the non-professional group own personal vehicles. The average age group was 40 and 33 for the experts and non-professionals. The subjects were asked to rate the safety impact on a six-point scale (0 no impact and five very high impacts). The rating considered the safety impact from two perspectives, vehicular and pedestrian traffic.
7. Traffic data survey
Data collection covered speed, vehicular traffic, pedestrian volumes (2 hours), and pedestrian behaviour for 10 streets (48 sections) in both districts. Directional classified vehicular traffic 15-min counts continued for 2 hours (morning and afternoon peaks). The counting process considered three categories of vehicles (Passenger cars, Buses, and Trucks). Directional pedestrians count on the sidewalks for the same two peak periods in 15 minutes measuring intervals. Space speed measurements were conducted on the same tested road sections by taking the time elapsed to cross 50 m. The sample minimum size was 30, including all vehicles that passed the test section; it reached 100 observations on arterial streets. In parallel to the vehicular speed study, pedestrian walking speeds were measured.
8. Crash data
Police traffic records were searched for the reported road crashes on all study area streets. The crash data identify the type (collision, turnover, and pedestrian) and the crash injury consequences (fatal, serious, and slight injuries). The record also shows the police officer’s interpretation of the cause of the crash. Other data related to the involved parties were available (gender, age, driver’s license type, etc.). Still, they were not included in the analysis since this study’s objective is not to investigate the why and how the crash happened in depth. Data were collected for one calendar year.
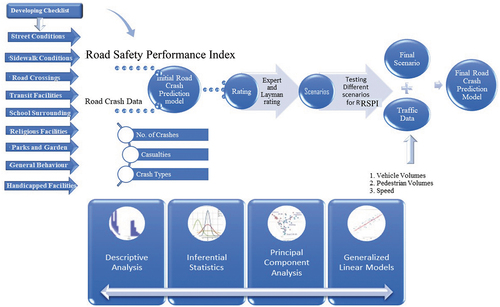
9. Analysis method
Figure illustrates the research framework, including the sequence activities and the appropriate statistical techniques used in this study. The data were scanned for completeness, then coded into an excel sheet and transferred to SPSS. Descriptive analyses were conducted for the collected -untreated data, including the frequency, summation, and central tendency measures. A composite performance index was calculated for each parameter by considering two approaches. The first index is the average value for each parameter; the second is the sum of each parameter re-scaled on a 100-point scale, referred to as Primary RSPIs.
Figure 3. Research framework and analysis tools.
The idea of applying principal component analysis (PCA) is to reduce the number of variables into fewer components. The PCA was used to reduce the 184 variables into nine synonymously the above parameters. According to Kaiser’s rule, two criteria were used in extracting the correct number of components: the component’s Eigenvalues and the extent of explained variance. The component is maintained if the eigenvalue exceeds 1 (λ ≥1). Component with λ ≥1explains more data variance than the original variables (Donald, Citation1993). The recommended cumulative percentage of explained variation for social science disciplines ranges between 40% and 60% (Kutluca et al., Citation2010), which was adopted, although some other literature recommends a range of 70–80%.
After creating the factor, the data were standardized (observation was subtracted from the mean and divided by standard deviation) multiplied by the respective standardized scoring coefficients to obtain the factor score. More than one technique was used to calculate a Road Safety Performance Index (RSPI) for each street by considering different weights for different factors; alternatively, no weights were applied, assuming they contribute equally to the RSPI. The RSPI was calculated using the simple equal average of all factored variables for each parameter for the latter approach.
where:
fi: the principal factor score I and n is the number of variables.
: Unweighted RSPI
The weighted RSPI was calculated for all tested factors by weighing the factor by its eigenvalue to the sum of all eigenvalues that exceed one. Thus, the weight reflects the explanation power of a particular factor to the explanation power of all extracted factors.
where
fi: the principal factor I,
n: the number of variables and
Ei: the eigenvalue for the related factor.
: Weighted RSPI
The crash prediction model was developed by considering the generalized linear model (GLM), which allows to model response variables with error distribution models other than a normal distribution. There are three components of the GLM. The random component defines the probability distribution of the response variable (Y or µ). The systematic component describes the linear predictors of the model, which are the explanatory variables (x1, x2, …, xn) and their coefficients . The third component is the Link Function g (μ), which specifies the link between random and systematic components. It shows how the response variable is related to the linear predictor of explanatory variables.
The random component, the dependent or response variable (Y), is assumed to follow the negative Binomial distribution in this study. The log function is considered to relate the response to the predictors because the predictors or independent variables (x1, x2, …, xn) are mixed of categorical and continuous variables as follows:
The models’ validity looked into the statistical significance of the model coefficients and the model prediction power by correlating the number of crashes with the predicted values. The presentation of GLM modeling results will be progressive over analysis phases, starting from the primary—untreated collected data to the weighted extracted variables (parameters) or the composite road safety index, which includes more than one parameter. Table summarizes the research methodology related to GLMs data definition and processing.
Table 4. GLM independent variable type and data processing
Collected traffic data were processed to determine the peak hour volume and calculate the traffic flow based on the associated peak hour factors for vehicular and pedestrian traffic. The speed data were processed, and its parameters include the mean, median, mode, and 85th percentile for both vehicular and pedestrian traffic. Inferential statistical analyses, including the t-test or ANOVA, were conducted, when necessary, to test some formulated hypotheses testing the difference in study area parameters or the road safety ratings.
10. Results
10.1. Primary data analysis- no safety weight impact
The primary Safety performance index is based sum of unweighted or unprocessed data, as shown in Figure .
Figure 4. Primary RSPI by parameter: No weight—itemized sum.
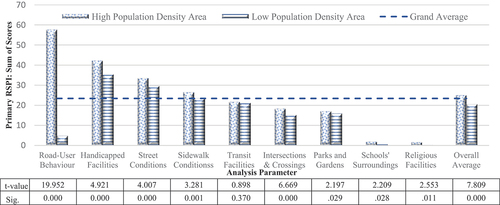
The higher the index value, the less safe the parameter is, while the lower the index value is, the safer the parameter is. The road users’ general behaviour in the dense urban area is rated very low (57.7), two folds and half of the overall average (23.4), indicating unsafe conditions. Figure suggests poor safety conditions for handicapped facilities, streets and sidewalk conditions, which were higher than the overall average irrespective of the type of area. T-test was applied to investigate any statistical difference attributed to area type. The results found a significant difference in the IRSPI explained by the area type, with few exceptions related to two parameters (transit facilities and school surroundings).
Two RSPI types were used in the analysis for crash prediction; the first is the sum of all assessed items for each parameter and then for all parameters. The second is the average of estimated items for each parameter and all parameters. The results of GLM showed a poor correlation between the predicted numbers of crashes (Table ).
Table 5. General linear models summary: Primary data sum and averaged based models
Developed models include the parameters as predictors proved to be valid as indicated by the likelihood ratio test statistic expressed in chi-squared value and its significance value (p <0.0250). The coefficients of these predictors (model parameters) differed from zero, except for the mode’s intercept of the sum-based model. The composite performance indices calculated as an overall average for parameters (sum or averaged-based) were not valid predictors for crashes [(χ2 =0.29, p =0.59) and (χ2 =2.16, p =0.142) for sum-and average-based models, respectively]. The four models failed to predict the number of crashes for the selected sites (r <0.001).
Table summarizes the results of PCA for each safety parameter. The parameter with a high number of variables produced more components to reflect the variation of the original data. The first component eigenvalues range between 1.86 and 5.26, while the values for the last component range between 1.01 and 1.4. This high eigenvalue of the first component means it summarizes more evidence than the original variables. Four parameters have eigenvalues that are more than 3.5 (Streets, sidewalks, transit facilities, and parks and gardens). The components explained variance ranges between 62% (Road-users’ general behaviour) and 87% (Parks and playgrounds) with an average of 75%. These proportions exceed the minimum accepted variance explanation threshold (40% or more). The composite factor was estimated for each parameter and the overall composite factor (the road safety performance index) by applying two approaches. Firstly, the factor score is calculated based on the average scores of all factor components, assuming they have equal weight. Secondly, the factor score is the average of the factor component weighted by the proportion of each component’s eigenvalue, greater than 1, to all eigenvalues greater than 1.
Table 6. Principal component analysis results: Primary data
The results in Table showed that reduced variables were four factors explaining around 62% of the data variation. The first component describing streets, sidewalks, disabled facilities, and road user general behaviour explains about 20% of the variation in data. Street conditions have the highest loading on the first component, while the disabled facilities have the lowest loading. The second component reflects the service facilities (Religious and parks). Gardens and parks highly correlated to this factor (loading of 0.81). The third factor explains 13% of data variations describing intersection conditions, including the crossing and school surroundings. Intersections’ variables have a higher correlation (0.788) with this factor than variables describing school surroundings (0.613). The fourth factor reflects transit facilities variables explaining13% of the data variation. Variables depicting sidewalk conditions are poorly correlated to the fourth principal factor.
Table 7. Principal component analysis: Principal factors loading and related eigen values and percent of variance explained—primary data
The four factors were combined to produce composite RSPI based on the score coefficient matrix. The average score of each composite factor by area is summarized as shown in Figure . The composite factors describing safety performance in the densely populated urban area are above average for the first factors (1 through 3) but different. The highest average positive score (0.28) is related to streets and sidewalk conditions. Less-densely populated urban area has the lowest average score related to the first factor (0.46). Streets, sidewalks, disabled facilities, and road users’ general behaviour conditions differ significantly between the two areas under investigation. The slightest difference between the two areas was evident for the second principal factor describing service facilities (Religious facilities and Parks and Gardens), followed by the third factor. The positive value of the parameters means that it is above average and vice versa for the negative value.
Figure 5. Principal factor analysis-average-by area: Primary data.
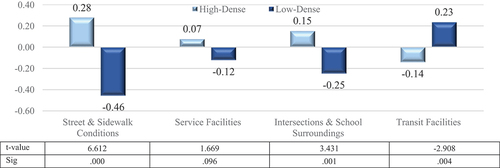
The results shown in Figures should be read together. The parameters above the average in Figure have positive values above the average in Figure ; the same applies to those below the average (factors with negative values). The conditions in the less densely populated areas vary more than those in the dense urban population area. Oppositely, the fourth factor is mainly related to transit facilities.
To some extent, sidewalk conditions are associated with high variation in the less-dense area with a positive average score. Still, the high-densely populated area variation is low, with a negative average score. To conclude, the positive value of a factor implies that traffic safety conditions tend to be worse. If it is above the average, this study infers that road safety conditions are inferior to the below-average conditions.
GLM analysis was conducted based on the developed principal factors for each parameter and the composite RSPI. The models presented in Table have parameters that differ from zero, except for the model intercept. Like the previously developed models, principal factor-based models showed that road parameters provide valid models for crash prediction, as indicated by the likelihood ratio test statistic expressed in chi-squared value and its significance (p <0.0250). The composite RSPIs were not demonstrated to be valid [(χ2 =0.23, p =0.63) and (χ2 =26.25 p =0.59) for Eigen-based and average-based models, respectively]. All four models failed to predict the number of crashes at the selected sites (r <0.01).
Table 8. General linear models summary: Principal factor-based models
10.2. Safety impact weight analysis
To further improve the predictive power of the developed models, a scale to weigh the impact of the assessed items on road safety was introduced per the methodology presented earlier. Figure illustrates a boxplot for the average rating for each safety parameter that comprises many items. There is a significant difference in weighted parameters. The plot indicates that the rating spread over a broader range of infrastructure-related parameters (Streets, sidewalks, and intersections). There was a noticeable agreement among all subjects when assessing the road-user general behaviour (a range of 1.01 and a standard deviation of 0.29). The rating range for the other parameters varies from 1.37 to 1.78 (standard deviation ranges between 0.37 and 0.42). The inconsistency of the infrastructure safety impact assessment, not the surrounding facilities, may explain the variation. Further, subjects’ responses seem to spread toward high values, as suggested by the skewness of the responses.
Figure 6. The dispersion of subjects’ responses on safety impact by parameter.
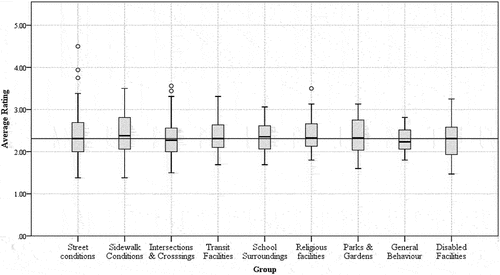
The overall average of all responses for all parameters is 2.38, a little short than half the scale (2.5). It may point to the low perception of the impact of weighted items on safety (Table ). Irrespective of the type of assessor, there is no statistically significant difference between the parameters’ weights (F =0.846, p =0.562).
Table 9. Descriptive analysis of subject’s weighing impact on Safety by parameter
The safety impact on vehicular traffic rating perceived by non-professionals is higher than the corresponding impact on pedestrian safety. Contrarily, experts’ perception of these items’ impact on pedestrian safety is higher than their impact on vehicle safety (Figure ). Expert rating is consistent with slight variation (σ =0.38 and 0.37 for vehicle and pedestrian safety, respectively), whereas non-professionals’ rating extends over a broader range (σ =0.45 and 0.47 for vehicle and pedestrian safety, respectively). The average ratings indicated high similarity between aggregated groups, except for the rating of non-professionals concerning vehicular safety (Table ).
Figure 7. The Dispersion of subjects’ responses on safety impact by group.
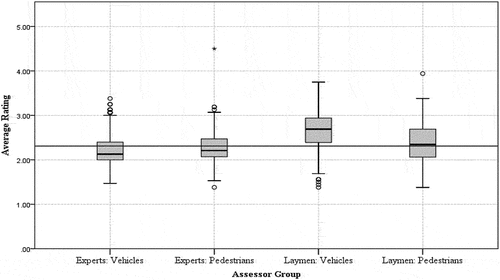
Table 10. Descriptive analysis of subject’s weighing impact on safety by assessor group
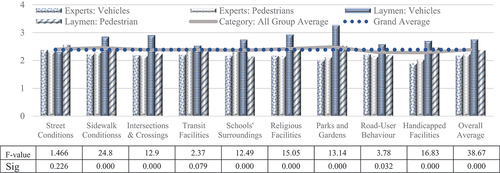
The relation between the assessing group and safety parameter showed significant differences, with few exceptions related to street conditions, transit facilities, and road users’ general behaviour (Figure ). In general, the non-professionals’ approach to assessing the impact on vehicle safety is distinctly higher than other groups, which is a valid point across all parameters.
Figure 8. Average weights of parameters by assessor group type.
The discrepancies in the weights given by respondents show the need for selecting the appropriate definition of the weight of road safety impact of the element/parameter. Three scenarios for incorporating the safety impact of the tested elements/parameters were placed forward, namely:
First scenario: surveyed items were weighted using the arithmetic mean of weights given by all assessor groups for each parameter item. The principal component analysis was not applied to the weights given by the assessor.
Second scenario: surveyed items were weighted using the calculated factor resulting from applying principal component analysis for weights given for each parameter by all assessor groups.
Third scenario: surveyed items were weighted using the calculated factor resulting from applying principal component analysis for weights given by three assessor groups that show harmonized assessment (excluding Nonprofessional: vehicular traffic group).
The results of PCA only related to the 2nd and 3rd scenarios, presented in Table , show that the third scenario provides a better explanation power of variance (60.3%) than the 2nd scenario (48.51%). Both scenarios have only one component with an eigenvalue exceeding one, λ =1.940 and λ =1.81 for the 2nd and 3rd scenarios.
Table 11. Principal component analysis results: Two tested scenarios
Although the 3rd scenario was associated with a higher degree of variance explanation, both scenarios and the 1st scenario were used in developing crash prediction models. All checked items of each parameter were weighted and then analyzed by PCA to reduce the number of variables and create the composite index reflecting the overall safety-weighted infrastructure conditions index.
The overall results of GLM analysis were summarized in Table , together with Pearson coefficients correlating the actual crash numbers to the predicted number of crashes. The correlation coefficient of less than 0.6 was deemed to be unsatisfactory. The 1st scenario-based models, followed by the 3rd scenario-based model, provide evidence of the satisfactory prediction power. The 2nd scenario-based models were not able to show proof of predictive power. Table suggests that composite extracted factor-RSPI predictors produced high prediction power than those based on the extracted components for the parameters.
Table 12. Summary of GLM models: Correlation between prediction and observed crashes
The model’s highest prediction power was associated based on the mean of the extracted components used to calculate the composite index (RSPI), not those based on Eigenvalue or the parameters. Few models based on the extracted components for the parameters provide good crash predictions. Therefore, the subsequent analysis considers only the 1st and 3rd scenarios. Like the un-scaled (primary) data reduction, the number of extracted weighted components explains 61.92% and 62.5 % of the variation for scenarios 1st and 3rd scenarios, respectively (Table ).
Table 13. Principal component analysis: Principal factors loading and related eigen values and percent of variance explained—scaled data
The first component describes street, sidewalk, disabled facilities, and road user general behaviour explaining around 20% of the variation in data; the 3rd scenario provides a slightly higher proportion than the 1st scenario. The street conditions parameter is related to the first component; this parameter has the same loading as the first component irrespective of the test scenario. The sidewalk condition parameter contributes less to the first component of the 1st scenario (0.67), while its contribution is higher in the 3rd scenario (0.72). The disabled facilities parameter has the lowest loading on the 1st component. Its contribution is higher in the 1st scenario (0.501) than 0.477 for the 2nd scenario.
The second component depicting the service facilities explains around 16% of the variation with no significant difference between the two scenarios. The loading of religious facilities parameter on this component does not differ between both scenarios. The same applies to the parameter that reflects the parks and garden conditions. The third component, for both scenarios, explains nearly 13% of data variations; still, this proportion is marginally lower than the analysis based on the 1st scenario (13.02% for 1st scenario compared to 12.92% for the 3rd scenario). Both scenarios are associated with similar component loadings for intersections and school surrounding conditions, which this component reflects.
The last factor mainly describes transit facilities variables explaining 12.69% and 12.59% of data variation for the 1st and 3rd scenarios. The transit facilities parameter equally contributes to this component for both scenarios. Table shows some difference in the loadings of the first and fourth components between the two scenarios, but more pronounced for the later component (4th component). The differences for the remaining components are minimal.
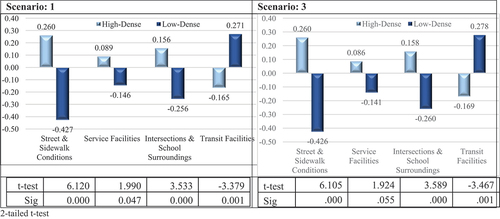
Average factor scores of weighted data for each component by study area presented in Figure show a similar trend to primary data (Figure ). Also, there is an explicit agreement for factor scores of all components between the two scenarios. The densely populated area factor scores are above the average because they have positive values, with one exception for the fourth component (Transit facilities), which, as stated earlier, reflects poor road safety conditions. Figure suggests high variations in road safety conditions between the investigated areas for the road infrastructure (1st component) and the transit facilities (fourth component). The factor scores of three out of four extracted components differ significantly due to area type. Only the average score of the second extracted component does not vary due to area type (t =1.990, p =0.047 and t =1.934, p =0.055 for the 1st and 3rd scenarios, respectively). In general, the conditions in the less densely populated area vary more than those in the dense urban area.
Figure 9. Principal factor score-average-by area: Weighted data.
Factor scores’ variations of the four components presented in six two-dimensional-format (Figure ) do not differ due to the tested scenario. Therefore, the following analysis is only related to the 1st scenario. The first component explains the highest variation in data, as evident from all the diagrams that have this component on its x-axis. The scores of the second component are less spread along the y-axis with few outliers. The infrastructure characteristics in the less densely populated area tend to be homogeneous with slight variation around the mean, and the same applies to the service facilities’ conditions (Figure ). The scores of the third component describing intersections and school conditions of both areas spread over a wide range, and it is more pronounced in the less densely populated zone (Figure ). This hints that some street sections can be considered safe but not all. The conditions in the densely populated area vary, mainly above average, implying unsafe conditions.
Figure 10. Factors’ scores plot by area-weighted data- 1st scenario.
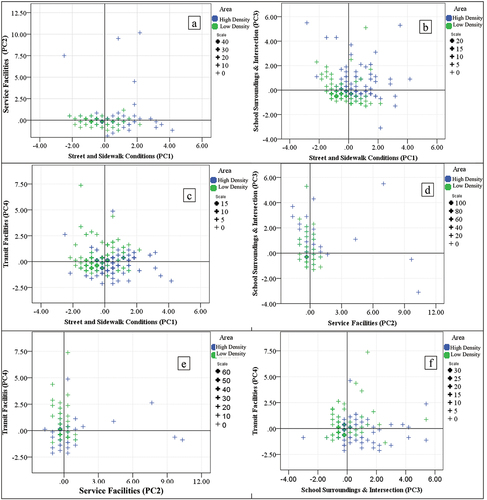
Transit facilities’ conditions in the densely populated area are less homogeneous than the less densely populated area. On the other hand, the infrastructure characteristics in the densely populated zone are mainly above the average, implies less-favourable safe conditions, and tend to be more homogeneous with a slight variation around the mean. The plot relating the infrastructure to transit facilities conditions (Figure ) shows that the conditions of street sections in the less-dense area are primarily above the mean with minor deviations. But, the street sections’ scores in the densely populated zone are scattered around the average with no clear trend. Thus, transit facilities are consistently less safe in the less populated area, while there is no consistency in their conditions in the densely populated zone. Service facilities scores of the less-densely populated area are consistent and vary over a small range (Figure ).
Factor’s scores describing intersections and school surroundings fluctuate above and below the mean. Street sections’ scores for both factors in the densely populated area spread over an extensive range compared to those in the less densely populated zone, suggesting an inconsistent quality of the service and safety conditions in the densely populated area. Street sections’ scores of the transit facilities in the less-densely populated area are mainly above the average with a slight variation, while they are below the average of the densely populated zone with a considerable variation (Figure ). The last two-dimensional presentation of the extracted factors’ scores relating to transit facilities, school surroundings, and intersection conditions demonstrates no clear trend differentiating any pattern related to area type (Figure ).
10.3. Crash prediction—weighted safety parameters
The same technique used for the primary data (no safety weight) modelling was applied to predict the number of crashes based on safety-weighted data. Four methods were used to reduce the number of variables while searching for the most valid predictors. The first set is related to un-extracted parameters- safety weighted data, namely the sum and average of checked items to reduce the 184 variables to nine and the overall safety index RSPI. The second set is related to the composite parameters calculated by averaging the score of the parameters’ element, assuming equal weight or weighted average based on the proportion of each valid element eigenvalue. The extracted factors were used to predict the number of crashes based on GLMs. The results for the 1st and 3rd scenarios are presented in Table . Based on the 1st and 3rd scenarios’ results, the extracted factors’ structure and loading coefficients are similar . The paired t-test provides evidence that there is no significant difference in these coefficients (p >0.05).
Table 14. A comparison between the PCA by data type and weighing scenarios
The PCA loading’s components of the primary data (no safety weight impact) are like the safety weighted components, with few marginally different exceptions, including street conditions and disabled facilities, and less extended the general behaviours and school surrounding conditions. It is expected, as the data were only scaled by the weight given to reflect the safety impact, and it is not a new set of data that could produce different structures of the extracted factors. Further, the average factor scores of weighted data for each component for each area (dense or less densely populated area) show a similar trend to basic. The models’ predictors for the number of crashes are either parameters or composite factors that combine all parameters in RSPI (Table ).
The models presented are the only ones demonstrated to be valid based on their likelihood ratios and the associated significance. The first conclusion on GLM results entails that extracted factors-based models, with few exceptions, produced a high prediction power. The coefficient of determination relating the predicted number of crashes to the observed reaches (R2) at 0.69 for the 3rd scenario based on RSPI. Similar results were reported for 1st scenario (R2 =0.64).
Table indicates that the extracted average RSPI-based models provide a better prediction than un-extracted average parameter-based models. None of the models has parks and gardens parameters as the predictor variable. The disabled facilities parameter is a valid predictor in all models included in the tested scenarios. Intersection and school surroundings parameters are good predictors for three models developed for the 1st and 3rd scenarios. Parameters related to sidewalks, streets, and transit were valid predictors for some models, but not all. The area type as a predictor variable is relevant for the models based on RSPI as a predictor, which summarizes elements related to the infrastructure, surroundings conditions, and road–user interactions. The area type reflecting the population density and infrastructure level of development showed that the collision in the less-densely populated area is predicted to be higher than the highly densely populated area for the un-extracted-based models. In contrast, the less densely populated area is expected to have a lower collision if the extracted-based model is considered by (0.41) for the model with the highest prediction power.
The author expected that including traffic flow parameters as predictors would improve the prediction quality. Many variables were tested for validity as crash prediction, but few were validated to work. The test variables include average, 85th speed, morning and afternoon peak vehicular traffic, and morning and afternoon peak pedestrian traffic. The valid predictors are 85th speed, morning vehicular and morning pedestrian traffic, and the composite extracted factor - RSPI (Table ).
Table 15. General linear models summary: Principal factor based models
Table 16. General linear models summary: RSPI and traffic parameter based models
The models that employ RSPI as a crash predictor based on the average extracted factor have a high coefficient of determination (R2 = 0.64 and 0.69 for the 1st and 3rd scenarios, respectively). Other models that include traffic parameters as one of the predictors produced contradicting results as their predictions could be considered as an enhancement for the model related to the 1st scenario (R2 increased to 0.68 compared to 0.64) but not based on the 3rd scenario where the R2 slightly dropped (R2 =0.67 compared to 0.69).
11. Discussion of results and conclusions
The main objective of this study is to develop a measure for assessing road safety performance that could be utilized for predicting crashes. The study explored the user’s perception of road safety conditions and whether the assessor’s experience and background differ. Road performance indices were developed based on assessing 184 checked road elements grouped in nine categories for105 selected streets in two districts of different population density and income in Amman, the capital city of Jordan. Other pertinent data include vehicular and pedestrian traffic data, speed, and one-year crash data.
The RSPI, on a 100-point scale of the densely populated area (25.1), is higher than the less-population area (20.6). The safety indices of the schools and religious facility surroundings, and to a lesser extent, parks and pedestrian crossings are safer than the other parameters. Research from Dominicans showed, contrary to this study’s findings, the general perception states that in comparison to other road features, pedestrian roads and public transport vehicles remain in inferior condition (Alonso et al., Citation2021), which may be a reflection of different road agency’s priorities or cultural values that in Jordan for instance, giver the focus to private vehicular traffic.
There are significant statistical differences between the tested indices of dense and less-dense populated areas, with few exceptions. The higher the value of RSPI is, the poorer road safety conditions are because the auditing checked the presence of the unsafe elements /practice, implying high index values if so, many hazardous elements exist, which was the case in the densely populated area. However, suppose traffic flow parameters are integrated with the analysis, related to the road user behaviour, car ownership level, and socio-economic status. In that case, the interaction between the road users and the infrastructure and among themselves in the less densely populated area may be more hazardous than in densely populated areas that are in confirmed by the findings of Ewing and Dumbaugh (Citation2009) who attribute the safety of the dense urban areas to the introduction of calming measures. Traffic speed is higher in the less densely populated areas, particularly its residents tend to acquire modern cars that encourage speeding, thus increasing the risk of collision, confirming the findings of Alonso et al. (Citation2020) reporting that the safety perceived in urban environments and public transport systems plays a significant role in the choice of transportation modes.
The predictors composed of either the sum of the checked elements (binary variables) or the average of all variables within each parameter did not provide a satisfactory level of crash prediction. Furthermore, the two indices representing an overall road performance index (RSPI), either as a sum of all parameters across all categories, again based on the summation or the average of all parameters, did not improve the GLM collision model prediction, which contradicts Akaateba (Citation2012) findings that show country road safety ranking based on road safety performance is better than those based on fatality rates, despite such a conclusion is related to the safety a high macro-national level not at a street level.
The variables were reduced by applying PCA based on the component’s Eigenvalues and the extent of explained variance. The parameters were reduced by establishing a composite parameter(s), which were, in turn, used to form the composite RSPI factor reflecting all-composite parameters. The composite RSPI summarizing the 184 variables in four factors explains around 62% of the data variation. Streets’ safety parameter contribution is highest to the first factor explaining the power of data variation by 20%. The second factor (service facilities) explains 16% of data variation. The third and fourth factors have equal explanatory power of data variation (13%), describing the intersection and transit facilities. The composite RSPI calculated either as Eigen or average based did not yield a valid prediction for road crashes. The main conclusion of this part of the analysis suggests that not all parameter elements may have the same impact on safety.
Therefore, instead of only checking the existence or the absence of safety elements, their impact on road safety was assessed by two groups of professionals (experts) and non-professionals from vehicular and pedestrian safety perspectives. A five-point scale was used, and the higher the value on the rating scale, the higher the impact of the road element is on-road users’ safety. The average of all participants was in the middle of the scale, like the previous findings (Mikušová & Hrkút, Citation2014), which might be a general tendency toward the center of the scale irrespective of its description.
The rating of infrastructure-related parameters (Streets, sidewalks, and intersections) spread over a broader range, indicating an inconsistency in the assessment, which was not the case for road-user general behaviour or road surrounding facilities. The physical road characteristics either vary to a large extent, or their perception among the subjects who participated in the survey varies, which explains the significant inconsistency in the ratings. The professional transport ratings for the two perspectives were not as high as the non-professional rating with a slight deviation, indicating consistent assessment within the parameter. The professional’s background and practical experience are reflected on their rating as they are continuously exposed to dealing with parameters and their implication on on-road performance and may better recognize their impact based on practical life experience; thus, they tend to estimate the effect on the safety of different parameters at the lower part of the scale. The non-professionals’ rating of the safety impact of the tested parameters on vehicular traffic outscores the effect on pedestrian traffic, which is way higher than the professionals’ rating. The car culture still dominates in the mindset of the general public; the impact of the parameters is perceived to be high on vehicle traffic because vehicle safety is essential. But not the pedestrian traffic, which is perceived similarly to that of the transport professionals, that is not receiving the same attention as vehicular traffic. The professionals gave slightly more weight to the parameters’ impact on pedestrian traffic than vehicular traffic. Che et al. (Citation2021) show that pedestrians’ general perception of the cyclist risk is higher than their risk, making them less cautious. Similar to the laymen’s perception in this study, vehicle safety impact is higher than the road element impact on pedestrian safety.
Based on the above, three scenarios were formulated and tested to reflect the weight of road safety impact on the tested road element/parameter and RSPI. First, use the average weights ratings by all assessor groups (1st scenario). Second, the extract factors from the principal component analysis are used based on the weights given by all assessor groups (2nd scenario). Third, use the average weight given by the three groups that show harmonized assessment, excluding the non-professionals rating of the impact on vehicular traffic (3rd scenario), which provides a better explanation power of variance (60.3%) compared with the second scenario (48.51%). Components’ loadings for the tested scenarios compared to the primary data -not safety weighted, with few exceptions were similar in magnitude and direction, which might be due to the fact the safety weighted data are scaled by the weight given to reflect the safety impact.
The 1st scenario-based models, followed by the 3rd scenario-based model, provide evidence of the good prediction power of their models. In contrast, 2nd scenario-based models could not show a sufficient predictive power for road crashes. The low prediction power of these 2nd scenario-based models may be related to the fact this scenario explains less than 50% of data variation. The composite extracted factor (3rd scenario), describing the road safety performance (RSPI) predictors, produced higher prediction power than those based on the extracted components for the parameters. Furthermore, the RSPI based on the average of the extracted components, not on the proportion of Eigenvalue, which are the two approaches used in developing the PCA-based RSPI, provides a better prediction for road crashes.
The un-extracted weighted data-based model (sum of all elements/indicators or their average) produces low prediction power compared to the extracted based model (the average or Eigenvalue), implying that weighing the parameters by their safety impact improves the prediction power of the models. The models based on composite extracted RSPI as a predictor provide better prediction than the parameters themselves. The highest coefficient of determination (R2) relating the predicted number of crashes to the observed reaches 0.69 for the 3rd scenario based on RSPI, explaining more than two-thirds of the variation in reported crash number. The district area is a predictor found to be valid and contributed to the model prediction power, particularly in conjunction with RSPI as a predictor. However, there is no clear trend explaining how the area type would influence the collision prediction. The un-extracted-based model showed the less-densely populated area might have more collisions than the densely populated area (0.67). While it is (0.41), fewer collisions reverse the situation for the extracted-based model with the highest prediction (3rd scenario and mean factor weight). The inclusion of safety impact weight on developing RSPI showed the safety performance of the less-densely populated area might be improved as not all parameters are given the same weight, and the weight reflects enhanced road safety performance.
For the parameter-based model, the disabled facilities parameter proved to be a valid predictor in all models and, to less extent, the intersections and the school surroundings parameters. Sidewalks, streets, and transit parameters proved to be valid predictors for some models, but not all. None of the models has parks and gardens parameters as predictor variables. Despite the low prediction power of such models, the study findings highlighted the need to improve the conditions for disabled mobility, schools’ surroundings, and safety at intersections, sidewalks, and streets.
Introducing traffic flow parameters as a predictor and the RSPI improved the prediction power for the 1st scenario-based model (R2 increased to 0.68 compared to 0.64) but not for the 3rd scenario-based model (R2 decreased 0.67 compared to 0.69). The increase was related to the model with a relatively lower coefficient of determination, and both models, once the traffic flow parameters were included, provided similar power in explaining the collision variations, which may be the highest possible variation that the collected data can explain. Other data that need to be included in future work, such as police surveillance and post-crash response, could improve the models. However, despite some improvement, once traffic parameters are incorporated, it is possible to conclude that the extracted safety-weighted RSPI could be enough to predict crashes producing a satisfactory level. A literature review showed that the road safety index is effective (Akaateba, Citation2012; Botha, Citation2005). The safety performance index was extensively used at the macro level to rank safety conditions among countries (Wegman et al., Citation2008; Wegman & Oppe, Citation2010) and not many at the micro level. This study may contribute to the knowledge from this perspective by describing how the safety index can be applied in developing countries and addressing conditions in areas within a city of different socio-economic factors. The findings also suggest that the road infrastructure conditions, irrespective of the traffic characteristics it carries, are directly related to road crashes suggesting the need to develop policies and procedures to improve road conditions and their performance, thus enhancing road safety.
Disclosure statement
In accordance with Taylor & Francis policy and my ethical obligation as a researcher, I am reporting that I did not receive any fund and an any financial help from any agency, and I cover all cost incurred. To my knowledge there are no company or agency may be affected by the research reported in the enclosed paper.
Additional information
Funding
Notes on contributors

Lina Shbeeb
Lina I. Shbeeb - was born in Nablus, Palestine, in 1962. She received a B.Sc. degree in civil engineering from the University of Jordan (1985) and an M.Sc. in traffic and highway engineering from the University of Jordan (1993). She had a Ph.D. in traffic planning and engineering from Lund University, Sweden (2000). She is a senior traffic and transport engineer with over 37 years of experience in traffic and transportation engineering, serving in the public and private sectors, including 21 years in academia. She is an associate professor in the civil engineering department at Hussein Technical university and served as the Dean of Social and Basic Science (2019-2022) and as the Dean of Engineering faculty at Al-Ahliyya Amman University (2017-2018), and as minister of transport (2013-2015) in Jordan Government. Research interests include traffic safety, traffic analysis and operation, pavement management, public transport planning and operation, transportation economics, and intelligent transportation systems. She is an active member of professional institutes. She is the co-founder and the CEO of Enrich business consultant.
References
- Akaateba, M. A. (2012). Comparing road safety performance of selected EU and African countries using a composite road safety performance INDEX. Journal of Natural Sciences Research, 2(8), 31–37. https://www.iiste.org/Journals/index.php/JNSR/article/view/3091
- Al Haji, G. (2005). Towards a road safety development index (RSDI). Development of an international index to measure road safety performance. Linkoping studies in Science and Technology, Licentiate Thesis, Department of Science and Technology, Linkoping University.
- Al-Khateeb, G. (2010). Analysis of accident data and evaluation of leading causes for traffic accidents in Jordan. Jordan Journal of Civil Engineering, 4(2), 76–94. https://jjce.just.edu.jo/issues/show_paper.php?pid=111
- Al-Majali, S., & Imam, R. (2019). Analysis of pedestrian accidents in Amman. International Journal of Civil Engineering and Technology, 10(12), 240–251. https://iaeme.com/Home/article_id/IJCIET_10_12_024
- Al-Marafi, M. N., Balbissi, A.H. (2016). Analysis of fatal traffic accidents in Amman City, Jordan. International Journal of Civil & Environmental Engineering IJCEE-IJENS, 16(3), 8–16. https://ijens.org/Vol_16_I_03/164603-9797-IJCEE-IJENS.pdf
- Al-Masaeid, H. R. (2009). Traffic Accidents in Jordan. Jordan Journal of Civil Engineering, 3(4), 331–343. https://jjce.just.edu.jo/issues/show_paper.php?pid=91
- Al-Omari, B., Ghuzlan, K. A., & Hasan, H. (2013). Traffic accidents trends and characteristics in Jordan. International Journal of Civil & Environmental Engineering, 13(5), 9–16. https://www.ijens.org/IJCEEVol13Issue05.html
- Alonso, F., Faus, M., Cendales, B., & Useche, S. A. (2021). Citizens’ perceptions in relation to transport systems and infrastructures: A nationwide study in the dominican republic. Infrastructures, 6(11), 153. https://doi.org/10.3390/infrastructures6110153
- Alonso, F., Useche, S. A., Faus, M., & Esteban, C. (2020). Does Urban security modulate transportation choices and travel behavior of Citizens? A national study in the dominican republic. Frontiers in Sustainable Cities, 2(42), 167–176. https://doi.org/10.3389/frsc.2020.00042
- Arowolo, M. O., Mat, R. A. R., & Jafri, M. R. (2013). Integrating road safety parameters into performance road safety index. Journal of Engineering and Applied Sciences, 8(9), 757–762. http://eprints.utm.my/id/eprint/49873/1/ArowoloMatthewOluwole2013_Integratingroadsafetyindicators.pdf
- Badr, Y., & Salamé, R.(2019) Note on the status of road safety priorities in the Arab region prepared for the 3rd Meeting of the UNRSTF Advisory Board, September 3, 2019. The Africa Transport Policy Program (SSATP). https://www.ssatp.org/publication/note-status-road-safety-priorities-arab-region
- Bastos, J. T., Shen, Y., Hermans, E., Brijs, T., Wets, G., & Clóvis, A. (2016). Road safety performance in Brazil : Towards a composite indicator. Proceedings of the 17th International Conference Road Safety On Five Continents (RS5C 2016), 17-19 May 2016. Linköping: Statens väg- och transportforskningsinstitut. Rio de Janeiro, Brazil, pp.1–12. http://urn.kb.se/resolve?urn=urn:nbn:se:vti:diva-10634
- Botha, G. (2005) Measuring road traffic safety performance. Proceeding of the 24th Southern African Transport Conference (SATC 2005). 11-13 July 2005. University of Pretoria, Pretoria, South Africa. 1–920-01712–7. http://hdl.handle.net/2263/6580
- Cardoso, J.L, Stefan, C., Elvik, R., & Sørensen, M. (2007). Road Safety Inspection - Best Practice Guidelines and Implementation Steps. Work package No. WP5. The Federal Highway Research Institute (BASt).
- Che, M., Wong, D., Lum, K. M., & Wang, X. (2021). Interaction behaviour of active mobility users in shared space.Transportation research part A. Transportation Research Part A: Policy and Practice, 153(C), 52–65. https://doi.org/10.1016/j.tra.2021.08.017
- Donald, A. J. (1993). Stopping rules in principal components analysis: A comparison of heuristical and statistical approaches. Ecology, 74(8), 2204–2214. https://doi.org/10.2307/1939574
- European Transport Safety Council ETSC (n.d.) 2019 Ranking Eu progress on road safety 13th Road Safety Performance Index Report.
- Ewing, R., & Dumbaugh, E. (2009). The built environment and traffic safety. Journal of Planning Literature, 23(4), 347–367. https://doi.org/10.1177/0885412209335553
- Hakkert, A. S., Gitelman, V., & Vis, M. A. (Eds.). (2007). Road safety performance indicators: Theory. deliverable D3.6 of the EU FP6. Project SafetyNet.
- Jadaan, K. S. (1997) A Study of contributory factors in road accidents in Jordan, IPENZ annual conference 1997, proceedings of: engineering our nation’s future; volume 1; Papers presented in the technical programme of the IPENZ Annual Conference held in Wellington.
- Jadaan, K., Al-Hyari, I., Naghawi, H., Ammourah, R., & Al Nabulsi, Z. (2013). Traffic safety in Jordan: Magnitude, cost and potential countermeasures. Journal of Traffic and Logistics Engineering (JTLE), 1(1), 54–57. https://doi.org/10.12720/jtle.1.1.54-57
- Kaundinya, I., Nisancioglu, S., Kammerer, H., & Oliva, R. (2016). All-hazard guide for transport infrastructure. Transportation Research Procedia, [Online], 14, 1325–1334. . https://doi.org/10.1016/j.trpro.2016.05.205
- Khasawneh, M., Ali Al-Omari, A., & Ganam, B. (2018). Forecasting traffic accidents in Jordan using regression techniques. Jordan Journal of Civil Engineering, 12(4), 570–579. https://jjce.just.edu.jo/issues/show_paper.php?pid=4465
- Kutluca, T., Arslan, S., & Özpinar, I. (2010). Developing a scale to measure information and communication technology utilization levels. Journal of Turkish Science Education, 7(4), 37–45. https://www.acarindex.com/pdfs/717167
- Mikušová, M., & Hrkút, P. (2014). Public perception of selected road safety. Problems. Procedia - Social and Behavioral Sciences, 162, 330–339. https://doi.org/10.1016/j.sbspro.2014.12.214
- Milan, B. F., & Creutzig, F. (2017). Lifting peripheral fortunes: Upgrading transit improves spatial, income and gender equity in Medellin. Cities, 70, 122–134. https://doi.org/10.1016/j.cities.2017.07.019
- Nadler, B., Nadler, F., & Strnad, B. (2014). Road safety inspection- manual for conducting RSI. Research of the Austrian Road Safety Fund.
- National Roads Authority of Ireland. (2012). Contributory factors analysis for road traffic collisions. ( n.d.). Issue 2 Contact report: risk solution.
- Oluwole, A. M., Rani, M. R.A, Rohani, M., & Rohani J.M. (2013). Integrating road safety indicators into performance road safety index. ARPN Journal of Engineering and Applied Sciences, 8(9), 757–762. http://eprints.utm.my/id/eprint/49873/
- Shah, S. A. R., Ahmad, N., Shen, Y., Pirdavani, A., Basheer, M. A., & Brijs, T. (2018). Road safety risk assessment: An analysis of transport policy and management for low-, middle-, and high-income Asian countries. Sustainability, 10(2), 389. https://doi.org/10.3390/su10020389
- Shbeeb, L. I., & Awad, W. H. (2016). Road traffic safety perception in Jordan. Cogent Engineering, 3(1), 1127748 https://doi.org/10.1080/23311916.2015.1127748
- Shbeeb, L., & Saleh, N., (2018) Evaluation of school zone improvement schemes. 6th annual international conference on architecture and civil engineering (ACE 2018). 460–469.
- Vaiana, R., Iuele, T., Astarita, V., Festa, D. C., Tassitani, A., Rogano, D., & Zaffino, C. (2014). Road safety performance assessment: A new road network risk index for info mobility. Procedia - Social and Behavioral Sciences, [Online], 111(5), 624–633. https://doi.org/10.1016/j.sbspro.2014.01.096
- Vaiana, R., Perri, G., Iuele, T., & Gallelli, V. A. (2021). Comprehensive approach combining regulatory procedures and accident data analysis for road safety management based on the European directive 2019/1936/EC. Safety, 7(6), 6. https://doi.org/10.3390/safety7010006
- Wegman, F., Commandeur, J., Doveh, E., Eksler, V., Gitelman, V., Hakkert, S., Lynam, D., & Oppe, S. (2008). SUNflowerNext: Towards a composite road safety performance index. Institute for Road Safety Research, the Netherlands SWOV. https://www.swov.nl/publicatie/sunflowernext-towards-composite-road-safety-performance-index
- Wegman, F., & Oppe, S. (2010). Benchmarking road safety performances of countries. Safety Science, 48(9), 1203–1211. https://doi.org/10.1016/j.ssci.2010.02.003
- WHO. (n.d.). (2018) Global status report on road safety 2018.
- World Health Organization. Regional Office for the Eastern Mediterranean. (2010). Eastern Mediterranean status report on road safety: Call for action. [online] apps.who.int. https://apps.who.int/iris/handle/10665/119908
- Yeganeh, A. J., Hall, R., Pearce, A., & Hankey, S. (2018). A social equity analysis of the U.S. public transportation system based on job accessibility. Journal of Transport and Land Use, 11(1), 1039–1056. https://doi.org/10.5198/jtlu.2018.1370