
 ?Mathematical formulae have been encoded as MathML and are displayed in this HTML version using MathJax in order to improve their display. Uncheck the box to turn MathJax off. This feature requires Javascript. Click on a formula to zoom.
Abstract
This study presents a framework for semi-empirical slope stability analysis of Mohmand dam, an important ongoing mega concrete-faced rockfill dam hydropower project in Pakistan. The project comprises of 213-m-high hybrid dam that will produce 800 megawatt of clean hydropower energy in addition to an effective flood mitigation. Also, it will supply water for both irrigation and drinking to the provincial capital city, Peshawar. In this study, finite element and limit equilibrium methods (LEM) have been used for slope stability analysis and factors of safety have been computed for all anticipated loading conditions including earthquake loading. The rockfill samples of main dam were obtained from the construction material site of Mohmand dam and the input parameters for slope stability analysis were obtained both empirically and through laboratory testing. Results of both limit equilibrium and finite element analyses have been compared, and it was observed that the latter is more conservative than the former giving 11%–19% lower FOS as compared to the FOS obtained through LEM, except for earthquake loading. The implications of current findings have been demonstrated using an important case study of an independent dam site that would boost the confidence of practitioners.
1. Introduction
An accurate method for analysis of slope stability has a major impact on the assessment of safety of a project, whereas an appropriate method of stability analyses would result in both safety and economy. For instance, a small factor of safety (FOS) would result in a significant difference in construction cost and time (Bromhead, Citation2007). Slope stability analyses is generally conducted using classical limit equilibrium methods (LEM) and finite element methods (FEM) given their obvious limitations are overshadowed by their financial and computational advantages (Aryal et al., Citation2008). For instance, the limit equilibrium approaches rely on geometrical and spatial characteristics of anticipated failure surfaces, whereby the shear strength of the material is insufficient to resist the applied shear stresses (Griffiths & Lane, Citation1999; Zhao et al., Citation2022). Similarly, recent research on computational geomechanics has significantly enhanced rigor and robustness of FEM approaches (Hammouri et al., Citation2008), hence making its use for slope stability analyses more reliable (Aryal, Citation2005). Contrary to LEM, no prior knowledge about shape and location of the failure surface is required. In essence, Athania et al. (Citation2015) concluded that FEM provides more reliable and conservative estimates of factors of safety than the LEM. For brevity, the LEM satisfies equilibrium of forces or moments at the limit state based on the principle that if resisting shear strength of material remains higher than the destabilizing shear stresses on a pre-determined failure plane, the slope remains stable. Mathematically, this is expressed as the ratio of resisting to destabilizing forces in the slope, termed as FOS, which quantifies the stability of a slope (Keawsawasvong & Shiau, Citation2022). In contrast, the FEM is regarded as a more detailed and accurate approach that analyses the slope stability problem based on stress-strain constitutive relationship to capture material behaviour and determines the failure surface by looking at the developing shear stresses (Astaraki et al., Citation2022; Griffiths & Lane, Citation1999). These stresses, if greater than the material strength, can lead to slope failure. A slope stability problem is typically analysed by FEM through the use of two possible approaches, namely, elastoplastic stress analyses and strength reduction method. In former, the model is loaded incrementally to failure and the number of times the failure load is greater than the field load gives the FOS, while in latter, the shear strength of the material is decreased to cause slope failure. The number of times the actual material shear strength is greater than the failure shear strength yields the FOS (Jun-jie et al., Citation2017).
Mohmand Dam Hydropower Project is located on Swat River about 48 km from Peshawar City (Pakistan) in Mohmand District, and about 5 km downstream of the existing Munda Head-works in Khyber Pakhtunkhwa (KP) Province of Pakistan. The Mohmand Dam forms a 56-km-long reservoir extending into Mohmand and Bajaur Districts. The surrounding districts will benefit from the water supplies of the Mohmand Dam. This study purports to compare the outcomes of both LEM and FEM approaches to analyse slope stability of Mohmand Dam using post-earthquake stability by pseudostatic and dynamic analysis.
For developing countries like Pakistan, where funding options for a mega project like Mohmand Dam may be very limited, overdesigning would not be a smart solution because of associated additional costs to a conservative design. The work in this paper is focused on evaluation and interpretation of a correlation to link input parameters for rockfill material with rock cores, where large-scale testing is unavailable. For instance, Espin and Araujo (Citation2018) analysed the rock slopes of a highway section in Ecuadorian amazon using an indirect method of seismic tomography because collection of geomechanical data was nearly impossible. Also, this study purports to present a comparative evaluation of FEM and LEM of slope stability for possible direct use by practitioners to optimize design of earthen dam cross-sections. In the end, results for various anticipated loading conditions such as end of construction, full supply level and seasonal variation are also evaluated.
2. Project description and geology
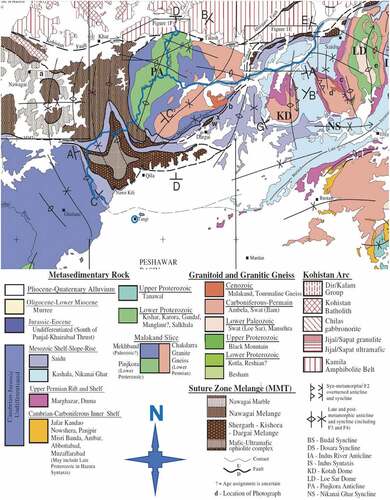
The dam will be founded on Schist, left and right banks will be underlain by hard Quartz Talcosic Schist and Chlorite Mica Schist, respectively. The spillway will be on Quartz Talcosic Schist. Powerhouse will be constructed on Graphitic Schist. Geological map of the dam site is shown in the Figure . The bedrock is in hard, fresh and intact condition (NESPAK, SMEC & ACE (Joint Venture), Citation2017). The under-construction dam is a concrete face rockfill dam (CFRD). The main dam body comprise of rockfill Material of different grades/qualities. A concrete slab spans the upstream face acting as a barrier to retain the reservoir due to the high permeability of rockfill. To model the dam by both LEM and FEM, evaluation of rockfill material properties is a pre-requisite and a critical part of this study.
Figure 1. Geological map of the dam site (adopted from NESPAK, SMEC & ACE (Joint Venture)).
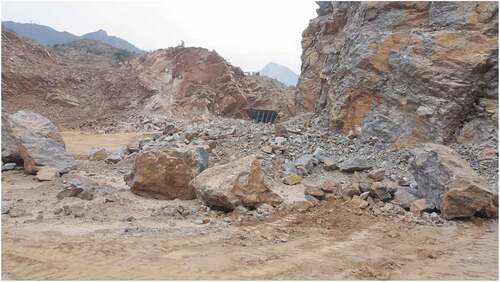
The size of rockfill material used in this project is large enough to necessitate the use of large-scale triaxial test apparatus. However, due to non-availability of such equipment with the authors, shear strength properties of the rockfill were determined using cores obtained from the rockfill and tested using traditional triaxial apparatus. Later, the rockfill parameters were obtained by correlating the results of core-testing with the literature references. Obtained parameters serve as input for LEM and FEM models. Rockfill samples to be tested were collected from the actual quarry site to be used for dam construction, suggested by Mohmand dam consultants in the detailed design report (NESPAK, SMEC & ACE (Joint Venture)). The sample collection site is shown in Figure . Laboratory testing carried out for the study is discussed in the following section.
Figure 2. Sample collection location at quarry site proposed for dam construction.
3. Laboratory investigations
For the current study, Petrographic analysis is performed on rockfill sample collected at site to determine its mineral composition. Petrographic analysis results are used to assess the suitability of the material to be used as concrete aggregate and to confirm the rock classification carried out in the field.
Due to unavailability of large-scale testing facilities for rockfill in Pakistan, shear strength parameters of the rockfill were determined through correlations available in the literature (Pinto de Citation2008). For this, Unconfined Compressive Strength Tests were performed on the Rock Cores of the rockfill source material in accordance with the provisions of ASTM D2938–95. The tests were performed using Universal Testing Machine (UTM) to find Unconfined Compression Strength (UCS) of rock cores. A minimum length-to-depth ratio of 2.5 was maintained while preparing the core sample. Load at failure was recorded and failure stress (UCS) was calculated using area of the sample.
Point Load Strength Test provides a Point Load Strength Index of the tested specimen which can be readily converted to UCS through available correlations. Point Load Tests on rockfill sample is performed in accordance with ASTM D 5731–08. The testing equipment consists of a Loading frame, Conical Platen and Pump handle. Rockfill sample was block-shaped with different widths. Average of both sides was taken to find mean width and mean depth. Maximum load was measured at the point where the sample failed, and relevant relationship was used to obtain the Point Load Strength Index. UCS was calculated using index-to-strength conversion factors.
Rebound hammer tests were also performed in accordance with ASTM D5873–00. For brevity, hammer spring was pressed by depressing the plunger until the hammer was triggered and the impact occurred. Height of hammer rebound was measured to the nearest whole number, and UCS was calculated using specific equation for the material under consideration.
4. Numerical model and parameters
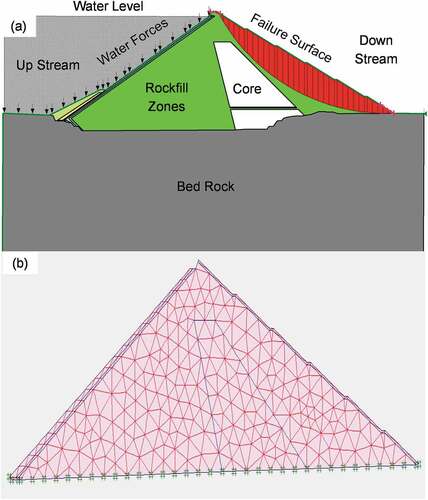
Two commercially available software packages, each LEM and FEM based, are used to evaluate slope stability. FOS is computed using input parameters derived using both empirical relations and laboratory test results. The FEM was meshed with 15 nodal elements with suitable mesh refinement. Mohr-Coulomb model was used as the material model for both LEM and FEM analyses (Figure ).
Figure 3. Typical layout for analysis using; (a) limit equilibrium method, and (b) finite element method.
4.1. Loading conditions
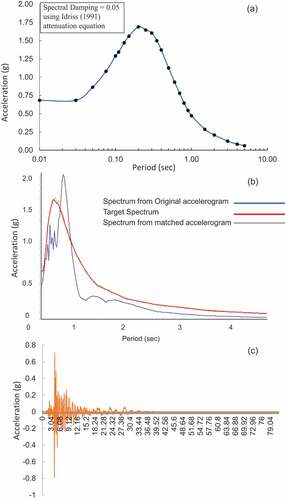
Analyses are performed for all anticipated loading conditions including end of construction, full supply level, minimum water level and earthquake loading. Furthermore, given that the project area falls in a tectonically active zone due to collision between the north moving Indian plate and the Eurasian plate i.e. Zone 2B (Building code of Pakistan, Citation2007), post-earthquake stability was also examined using both pseudostatic and dynamic analysis. The recommended ground motion value corresponding to maximum credible earthquake (MCE) is 0.68 g, peak ground acceleration of 0.16 g was fixed for the operation basis earthquake (OBE). Equivalent horizontal force component for pseudo static analysis (OBE) (= 2/3 of PGA i.e. 0.107 and for MCE = 1/2 of PGA i.e. 0.34) was used, while the vertical component in pseudostatic analysis was kept zero. To perform dynamic time history analysis, design response spectra was developed with a PGA of 0.68 (Figure )) and the following Idriss Equation was used to develop the design spectra.
Figure 4. (a) Sample time history, 18 October 1989, Loma Prieta earthquake recorded at Lexington dam, California, (b) design response spectra generated using Idriss equation, (c) design time history of Mohmand dam using spectral matching in seismomatch.
where Y is ground motion parameter, M is earthquake magnitude, R is the closest distance to the source in Km, F is style of faulting factor (i.e. F = 0 for a strike slip fault; F = 1 for a reverse fault and F = 0.5 for an oblique source), ε is standard error term (natural logarithm) and αo, α1, α2, β0, βl, β2 are constants.
The design response spectrum was matched with sample time history of Loma Prieta Earthquake recorded at Lexington Dam California on 18 October 1989 (Figure )) to generate design time history using Seismomatch software (Figure )). Lexington dam was selected because of its similar geological features with Mohmand Dam. Notably, major input parameters, which affect the slope stability, are angle of internal friction (), undrained cohesion (c; Irfan et al., Citation2013) and modulus of elasticity (Bhandary et al., Citation2018).
4.2. Friction angle
Barton (Citation2013) compared shear strength of the Rockfill material with the shear strength of the intact rock, jointed rock, filled discontinuities and fractured rock. He derived an Equation for the Rockfill material shown below.
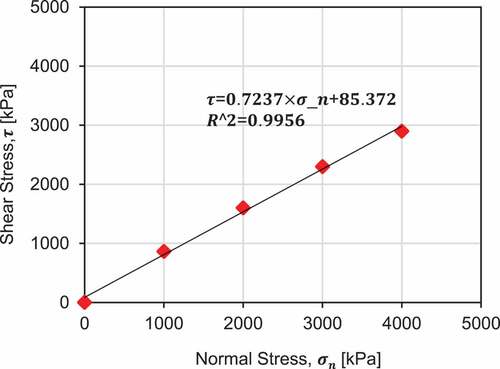
where τ = Shear Stress, σn = Normal Stress, R = Roughness, S = Unconfined Compression Strength, = Basic Friction Angle.
R is the value of roughness which was calculated using visual observation of rockfill sample (7 mm mean value), is the Basic Friction Angle (30°) provided by Barton (Citation2013), S is the value of UCS calculated through Laboratory testing (35 MPa). Shear stress was plotted against normal stress to find out the friction angle (Figure ).
Figure 5. Plot between shear stress and normal stress for friction angle.
Empirically, friction angle was calculated using International Commission on Large Dams (ICOLD, Citation2016). For brevity, it suggests that the friction angle for rockfill varies from 45° (lowest density, poorly graded weak particles) to as high as 60° for high density well-graded particles. For slope stability analysis using critical conditions, a conservative estimate of friction angle was taken as 45°.
4.3. Modulus of elasticity
Material modulus of elasticity thus affects the FOS in FEM (Köken, Citation2013). Pinto’s (Citation2008) method was used to calculate modulus of elasticity from valley shape factor, which is defined as the area of concrete face slab (measured normal to the face) divided by the square of maximum dam height. i.e. (A/H2). Face slab area of Mohmand Dam is 151,470 m2 and height of main dam is 213 m. Valley shape factor (A/ H2) comes out to be 3.33. From this valley shape factor, modulus of elasticity from Pinto’s chart is calculated as 70 MPa that is referred to as the construction modulus (Ecr). This will change to a new value when the dam is filled, called Filling Modulus. To calculate the filling modulus, Pinto de (Citation2008) method is used. In this method, a Modular Ratio is calculated using Valley Shape Factor. Modular ratio is defined as the ratio of Filling Modulus to Construction Modulus.
Using the graph between shear stress and normal stress (Figure ), the friction angle is calculated to a value of 41.5°. Further to that, the friction angle is calculated empirically using (ICOLD, Citation2016) manual with a recommended value of 45°. The value of friction angle obtained empirically was overestimated (7.8 %) than the one obtained through laboratory testing. The probable reason for increased values of friction angle through empirical equations (ICOLD, Citation2016) may be related to the fact that the given equations are generalized and did not truly represent the specific dam material being used (rockfill). In contrast, the laboratory tests were performed on samples collected from the actual site, suggesting more reliable results. In essence, the values of A/ H2, modular ratio, and filling modulus have been computed as 3.33, 2.65, and 185.5 MPa (i.e. 2.65 × 70 MPa).
5. Results and discussion
As Table shows, the tested material mainly consists of Carbonates, Quartz, Muscovite/ Sericite, clay and Haematite/ Limonite. It is noteworthy that the current samples exhibit no alkali carbonate reaction (ACR) potential because of lower dolomite CaMg(CO3)2. Also, because of low Quartz (<5 %), there is no alkali silica reaction (ASR) potential and hence rockfill sample can safely be used as aggregate with ordinary Portland cement (OPC; after Francieli et al., Citation2018).
Table 1. Summary of petrographic analysis result
In this study, the FOS was calculated and compared using the LEM and FEM techniques with input parameters calculated through laboratory testing on the material collected from the actual dam site as well as through the use of empirical relations. Table summarizes the results strength and deformation characteristics tests conducted in the laboratory including unconfined compression test, point load strength index test and rebound hammer test yielding values of 35.13 MPa, 51.04 MPa and 39.83 MPa, respectively. The unconfined compression test provided the lowest value of strength as compared to other two methods (i.e., 35.13 MPa) that has been adopted as a conservative value for further computations involving the determination of friction angle and FOS against slope failures under different loading scenarios.
Table 2. Summary of laboratory test results
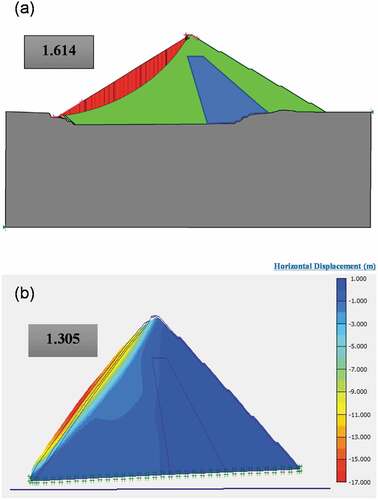
Figures show computations of FOS based on empirical model parameters for the conditions of end of construction using LEM, and FEM, respectively. The results of numerical simulations are compared in Table , where the slopes are stable under all loading conditions except for MCE condition in pseudostatic analysis. The probable reason for this discrepancy would be that the dynamic analysis uses actual time history of the earthquake as input parameter that may or may not be represented truly by the assumed pseudostatic condition. Hence, the pseudostatic approach is conservative than the governing dynamic analysis based on actual time history. In case a structure fails in pseudostatic analysis, dynamic analysis should be performed to reassure the structure’s safety.
Table 3. Results of factor of safety (FOS)
Figure 6. Computations of factor of safety for the condition of end of construction based on empirical model parameters using; (a) limit equilibrium method, and (b) finite element method.
As Figure ) shows, the horizontal displacements of the embankment soil at full supply level are larger than those at the bottom. Although phreatic pressure is minimum at the top, soil mass at the bottom is more confined therefore displacement is maximum at the top. Similarly, Figure ) presents the distributions of vertical displacements vectors, wherein relatively larger displacements are accumulated at the top due to lesser confinement than the bottom that may result in overall settlement of the dam body.
Figure 7. Distributions of displacement vectors of embankment soil at full supply level; (a) horizontal displacement, and (b) vertical displacements.
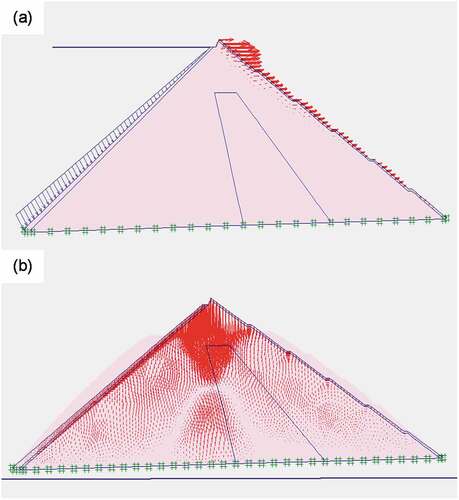
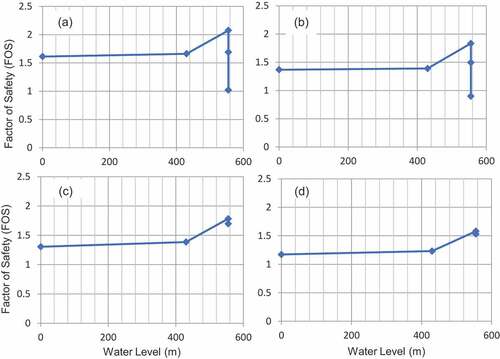
Figure presents the variation of FOS against the elevation of water level in the reservoir. Figures ) show the results of both LEM and FEM analyses using empirical factors, respectively, while Figures ) present the plots of both LEM and FEM analyses using laboratory parameters, respectively. For end of construction (EOC) stage, water level is zero so the stabilizing force on the dam is minimum which provides minimum value of FOS. FOS is maximum when reservoir is full (555 m) in all cases. During seasonal variations, water level is reduced to 430 m, which reduces the FOS than that at full supply in the reservoir. Notably, the FOS markedly drops when the reservoir at full supply would be hit by an earthquake. For instance, the FOS is lowest for the case of MCE shown in Figures ).
Figure 8. Factors of safety versus upstream phreatic level; (a) results of LEM analysis using empirically estimated properties, (b), results of FEM analysis using estimated properties, (c) results of LEM analysis using laboratory results, and (d) results of FEM analysis using laboratory results.
Overall, the FOS value for LEM was 11%–19% higher compared to the FOS obtained through FEM. The reason being that FEM uses stress-strain constitutive relationship and incorporates material stiffness which results in a more accurate and representative behaviour of material, that is shown by more-conservative values compared to the LEM. Such behaviour is also confirmed by Aryal et al. (Citation2008) wherein FEM-based calculations resulted in a smaller value of FOS than LEM-based method. LEM-based models are based on simplistic approach and these methods ignore some crucial complex mechanisms of soil and rockfill failure. Many parameters: for instance, the dilation angle (ψ) and the horizontal to vertical stress ratio (k0) are not included in an LEM analysis as compared to FEM. Results of this study have shown the effect of these parameters on slope stability and on the FOS. Although the location of critical slip surface may occasionally be the same for both methods, the FEM provides results based on stresses and deformations without providing prior slip surface. Hence, FEM can be considered as a more reliable technique to model slopes of the dam under consideration compared to LEM.
6. Case study
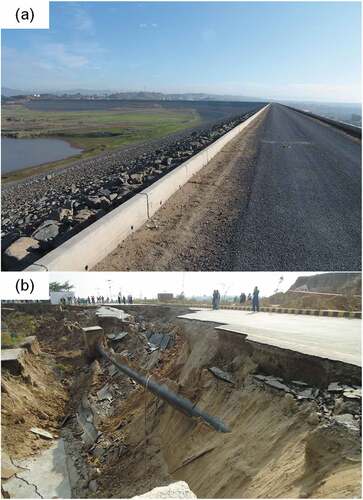
Mangla dam in Mirpur district is a multipurpose project constructed in 1967 to conserve the water of river Jhelum, irrigation releases and generation of power up to 1000 MW. Main features of the project include three earth dams with a maximum height of 115.8 m and a total length of 12.8 Km. By the year 2000, Mangla reservoir lost about 20% of its gross storage capacity due to sediment deposition. Raising of Mangla was needed to regain the lost capacity and thereby augment the irrigation releases as well as hydropower generation. In year 2012, Mangla dam was raised by 12 m thereby increasing storage capacity by 3577.1181 Million Cubic Metres (MCM). During the design phase of the project, the Morgenstern and Price’s LEM-based method was adopted for two-dimensional slope stability analyses of the embankments. Slopes were analysed for Normal drawdown, Steady seepage with reservoir full and emergency drawdown conditions by adapting a minimum FOS of 1.6 (Mangla Design Report, NESPAK, BARQAAB, Binnie and Partners and Harza, Citation2013). However, in November 2014, a landslide on Mirpur–Kotli Road near Khaliqabad resulted in failure of slope along reservoir rim, whereas the results of FEM simulations using Plaxis revealed that the FOS was 1.2 (Mehmood & Farooq, Citation2020). This clearly suggested that the LEM-based methods are often proved non-conservative because they over-estimate the FOS that is fully consistent with the findings of this study. ) show the images of slopes before and after the failure, respectively.
Figure 9. (a) Slope during construction before failure, and (b) slope along Mangla Reservoir Rim just after occurrence of failure.
7. Conclusions
In this paper, results have been reported from the comparison between LEM- and FEM-based slope stability analyses for a CFRD dam based on input parameters calculated using both laboratory tests and empirical methods. FOS was computed and compared for various loading conditions of the dam. Stability of the dam was also checked for pseudostatic and dynamic earthquake loading. Following main conclusions can be drawn from the presented work:
The unconfined compression test is a more conservative approach which gives smaller values of UCS than both the point load strength index test and the rebound hammer test. Similarly, the shear strength parameters calculated through empirical methods and equation often over-estimate than those obtained through laboratory testing of rock sample samples collected from the site.
In practice, the design engineers prefer LEM over FEM believing it is conservative and the design will have an additional FOS. However, this study has demonstrated that LEM often overestimates the FOS as LEM-based analysis demonstrated larger values compared to the FEM-based approach. This has been further verified through a practical case study of failure of slope along reservoir rim of Mangla dam, whereby the original FOS obtained from LEM-based analysis was found to be 1.2 from FEM-based analysis.
Although the location of critical slip surface is similar for both methods, the FEM provides results based on stresses and deformations without providing prior slip surface. Hence, FEM can be considered as a more reliable technique to model slopes of the dam under consideration compared to LEM.
Highlights
FEM and LEM have been used to quantify rock slope stability for all anticipated loading conditions, including dynamic loads.
Samples were obtained from the Mohmand dam construction site, while input parameters for analysis were obtained both empirically and experimentally.
Comparisons of analyses results revealed that the FEM is more conservative than limit equilibrium except for earthquake loading.
Implications of current work are demonstrated through an important case study of an independent dam site to boost the confidence of practitioners.
List of abbreviations
FEM: Finite Element Method
LEM: Limit Equilibrium Method
UniversalTesting Machine: (UTM)
EOC: End of Construction
FSL: Full Supply Level
PSI: Point Load Strength Index
Hr: Rebound Number
ACR: Alkali Carbonate Reaction
ASR: Alkali Silica Reaction
Acknowledgement
Supports from Helan Research Scholar Program of Ningxia University, China, and Geotechnical Engineering Laboratory of Civil Engineering Department, University of Engineering & Technology (UET) Lahore are heartily acknowledged. Similarly, technical assistance from both Prof. Farooq Ahmad, Chairman Geological Engineering of UET Lahore, and National Engineering Services Pakistan (Pvt.) are gratefully acknowledged.
Disclosure statement
No potential conflict of interest was reported by the author(s).
Additional information
Funding
References
- Aryal, K. P. (2008). Differences between LE and FE methods used in slope stability evaluations. The 12th International Conference of International Association for Computer Methods and Advances in Geomechanics (IACMAG), Goa, India, Osaka: Millpress Science Publishers/IOS Press, 4509–4516. http://hdl.handle.net/11250/231364
- Aryal, K., Sandven, R., & Nordal, S. (2005). Slope stability evaluation by limit equilibrium and finite element method. 16th International Conference on Soil Mechanics and Geotechnical Engineering (pp. 2471–14). Osaka: Millpress Science Publishers/IOS Press. https://doi.org/10.3233/978-1-61499-656-9-2471
- Astaraki, F., Rad, M. M., Esfandiari, R., Mehni, G. L., Esmaeili, M., & Jing, G. (2022). Effect of geocell, on the mechanical behavior of railway embankments, using FE modeling. Acta Polytechnica Hungarica, 19(6), 63–80.
- Athania, S. S., Shivamanth, Solanki, C. H., & Dodagoudar, G. R. (2015). Seepage and stability analyses of earth dam using finite element. International Conference on Water Resources, Coastal and Ocean Engineering (ICWRCOE 2015) (pp. 876–883). Mangalore: Elsevier B.V, https://doi.org/10.1016/j.aqpro.2015.02.110
- Barton, N. (2013). Shear strength criteria for rock, rock joints, rockfill land rock masses: Problems and some solutions. Journal of Rock Mechanics and Geotechnical Engineering, 5(2013), 249–261. https://doi.org/10.1016/j.jrmge.2013.05.008
- Bhandary, A., Krishnamoorthy, R. P., & Rao, A. U. (2018). Stability analysis of slopes using finite element method and genetic algorithm. Journal of Geotechnical and Geological Engineering, Research, 37, 1877–1889. https://doi.org/10.1007/s10706-018-0730-5
- Bromhead, E. N. (1992). “The Stability of Slopes (2nd edn ed.). Blackie Academic & Professional”.
- Building code of Pakistan. (2007). Seismic parameters”. concrete face rockfill dams, concepts for design and construction. ICOLD, 2004, Committee on materials for Fill Dams. https://pec.org.pk/downloads-documents/building-code-of-pakistan/
- Espin, J. R., & Araujo, S. (2022). “Stability Assessment of a Bedding Rock Slope Using Q-slope and Seismic Tomography: A Case Study in the Ecuadorian Amazon. Periodica” Polytechnica Civil Engineering, 66(1), 220–227. https://doi.org/10.3311/PPci.19005
- Francieli, T., Florindo, R., Vieira, G., Gomes, M., Dal Molin, D., Lermen, R. (2018). Influence of the quartz deformation structures for the occurrence of the alkali–silica reaction. Materials, 11(9), 1692. https://doi.org/10.3390/ma11091692
- Griffiths, D. V., & Lane, P. A. (1999). Slope stability analysis by finite elements. Geotechnique, 49(3), 387–403. https://doi.org/10.1680/geot.1999.49.3.387
- Hammouri, N. A., Husein Malkawi, A. I., & Yamin, M. M. A. (2008). Stability analysis of slopes using the finite element method and limiting equilibrium approach. Bulletin of Engineering Geology and the Environment, 67(4), 471–478. https://doi.org/10.1007/s10064-008-0156-z
- ICOLD Guideline for selecting seismic parameters for large dams. (2016), Bulletin 148.
- Irfan, M., Aziz, M., Aziz, M., & Khan, A. H. (2013). A parametric study on stability of open excavations in Alluvial Soils of Lahore District, Pakistan. Journal of Geotechnical and Geological Engineering, Research, 31(2), 729–738. https://doi.org/10.1007/s10706-013-9623-9
- Jun-jie, H., Ya-guang, Q., Shuang, Z., Wei, W., Lei, W., & Shukla, S. K. (2017). Strength response characteristics and coupling support of deep roadway in soft rock masses. Cogent Engineering, 4(1), 1339337. https://doi.org/10.1080/23311916.2017.1339337
- Keawsawasvong, S., & Shiau, J. (2022). Stability of spherical cavity in hoek–brown rock mass. Rock Mechanics and Rock Engineering, 55(8), 5285–5296. https://doi.org/10.1007/s00603-022-02899-4
- Köken, E. (2022). Estimation of deformation modulus of coals using artificial neural networks (ANN). Acta Technica Jaurinensis. https://doi.org/10.14513/actatechjaur.00661
- Mangla Design Report, NESPAK, BARQAAB, Binnie and Partners and Harza, 2013
- Mehmood, F., & Farooq, K. (2020). Failure analysis of a landslide along the Mangla reservoir rim near Khaliqabad. Proceedings of the Institution of Civil Engineers - Forensic Engineering, 173(4), 130–140. https://doi.org/10.1680/jfoen.20.00011
- NESPAK, SMEC, & ACE (Joint Venture). (2017). Detailed engineering design report. WAPDA.
- Pinto de, N. L. S. (2008). Very high CFRDs: Behaviour and design features. International Journal on Hydropower and Dams, 15(4), 43–49.
- Ul Haq, I., Munir, K., & Farooq, K., (2009) “Rock testing at Diamer Basha dam project”, Proceedings of the 17th International Conference on Soil Mechanics and Geotechnical Engineering (Volumes 1, 2, 3 and 4). https://doi.org/10.3233/978-1-60750-031-5-989
- Zhao, X., Zhu, J., Wu, Y., Jia, Y., Colliat, J.-B., & Bian, H. (2022). A on the Influence of on the crushing of rockfll materials. Rock Mechanics and Rock Engineering. https://doi.org/10.1007/s00603-022-02985-7