
Abstract
Dedicated welding fixtures have been utilized in the railcar manufacturing industry to stabilize welded parts during welding-assembly processes. The use of this fixture results in poor quality and repeatability of welded parts, as well as reduced versatility amongst components and storage problems. The intelligent reconfigurable welding fixture (IRWF) was therefore developed to mitigate the problems encountered in the railcar manufacturing environment. This paper presents the heating-analysis study conducted on the welding fixture components to evaluate the transient heat distribution during the welding of stainless steel 316 components using both an experimental and a finite element analysis approach. In addition the temperature distribution on welded components during a Tungsten Inert Gas (TIG) welding operation was analysed. The TIG welding experiment was first conducted to generate data that served as input during the Finite Element Analysis (FEA) study. A Thermographic camera was used to measure the heat distribution across welded parts immediately after welding. Solid edge FEA was used to conduct a sequential numerical simulation analysis of the thermal heating effects on stainless steel. Thermocouples were embedded in the fixture blocks of the respective welding stations to measure the heat generated on the fixture during welding. The heat analysis study conducted on the fixture using thermocouples yielded very good results. It was successfully proven using experiments that the fixture was exposed to a temperature of less than 30°C during welding. The numerical simulation conducted on welded parts during TIG welding showed a maximum temperature distribution of 309°C.
PUBLIC INTEREST STATEMENT
The heat generated on the welded parts during welding assembly process requires detailed analysis using both the numerical simulations and experimental evaluation to better understand the root-cause and to quantify its effects on the quality of welded parts. The intelligent welding fixture was developed to conduct the experimental heat distribution analysis study on six stainless steel 316 components from the railcar manufacturing industry. The developed fixture utilized intelligent clamping arrangement which was controlled from a control a programmable logic control (PLC) as well as part detect sensors to detect the presence and orientation of part when loaded on the welding station. In addition, type K thermocouples were used to measure the amount of heat generated on the fixture during welding and the Thermograph camera was used to measure the heat distribution across the welded parts respectively.
1. Introduction
Welding fixtures are used to hold and stabilize welded components for improved quality, repeatability and reduced distortion during the welding assembly process. Furthermore, welding fixtures play a significant role in the reduction of production loss and manufacturing lead time since they provide proper positioning and holding of welded components during a welding assembly process.
Fixtures form part of the accuracy path of the assembly system, since their tolerances affect the quality of the parts after processing (Li & Melkote, Citation1999; Moroni et al., Citation2014; Raghu & Melkote, Citation2004).
Dedicated welding fixtures are rigid and non-modular. This makes them non-reconfigurable when the need arises to meet new market demands (Namthakumar & Prabakaran, Citation2014). Modelling of the process work piece- fixture system allows the implementation of optimization strategies for attaining a suitable fixture layout (Kaya, Citation2006; Pelinescu & Wang, Citation2002; Y. Wang et al., Citation2006; Wang & Nee, Citation2011).
Welding fixtures have direct impact on the product manufacturing, quality, productivity and cost. Wang et al (H. Wang et al., Citation2010) reported the methodology and guidelines for the design and assembly of welding fixtures. Welding fixtures have the following three elements: the locators and their support, the fixture base, and the clamping system. The positioning of the locators should restrict the six degrees of freedom on the work piece during welding, i.e., linear movement in the direction or opposite direction of the axis in X, Y, and Z and the rotation of the X, Y, and Z axes (Darmawan et al., Citation2018).
Welding fixtures for workpieces comprise the usual locating and clamping elements, as used in other fixtures. However, the effect of heat and the prevalence of welding spatter must be taken into account when designing hot joining fixtures. The design considerations for welding fixtures are outlined as follows as emphasized by Naveen & Girish, (Citation2014):
Expansion of the heated work piece and resulting distortion should not affect the proper location, clamping, loading and unloading.
There should be adequate clearance between the work piece and locators to permit expansion, contraction and distortion of the work piece without jamming the fixture.
Handles subjected to heating should be made from insulated materials such as wood.
Welding spatter should not be allowed to fall on the threaded parts of the clamping elements. The parts near the welding area should not be threaded.
Efficiency metrics can be used to develop a comparative design procedure for reconfigurable assembly fixtures that can adapt to manufacturing processes (Erdem et al., Citation2017).
The railcar manufacturing industry utilizes a Tungsten Inert Gas (TIG) welding assembly process to fuse the stainless steel 316 components together. Welding is the process of permanently joining similar or dissimilar metals at their contacting surfaces by application of heat and/or pressure (Patel & Gandhi, Citation2013; Arunkumar, Citation2012). TIG welding is one of the important welding processes used to fuse metal components in the development and fabrication environment (Reddy Pinninti, Citation2015).
TIG welding or GTAW (Gas Tungsten Arc Welding) uses a non-consumable tungsten electrode protected by an inert gas. The electrode is either made of pure tungsten or tungsten mixed with small amounts of oxides (thoriumoxide, zirconiumoxide) to improve the stability of the arc and to make it easier to strike. Since the process uses a non-consumable electrode, extra filler material is usually added (Ericsson, Citation2003; Avadheshkumar & Patel, Citation2017). The TIG welding process has been widely used in high-tech industry applications, such as, the nuclear industry, aircraft, the food industry, maintenance and repair work, as well as some manufacturing areas (Larry, Citation2002, Citation2012). The process itself can be manual, partly mechanized, fully mechanized or automated (Kazi, Citation2015). The welding power source delivers direct or alternating current. Helium and argon gases are the most suitable for shielding, as they are not chemically reactive (Joshi, Citation2014).
GTAW-AM (Gas Tungsten Arc Welding Additive manufacturing) can also be used to fabricate components with large geometry and moderate complexity (Patanayak & Kumar Sahoo, Citation2021).
The FEA/numerical simulation study was conducted to evaluate the heat distribution across the welded parts and the fixture assembly during the welding assembly operation.
Li et al. (Li et al., Citation2014) conducted a numerical simulation using thermo-mechanical interface element to study the weld size, penetration and contact conditions between the welded plates and their influence on the sample distortion. Rong et al. (Rong et al., Citation2016) and Perić et al. (Perić et al., Citation2014) conducted welding simulations based on a combination of three-dimensional solid and shell elements to shorten the computation time. Wang et al. (C Wang et al., Citation2014) dealt with the impact of the gap between the skin plate and stiffener on the residual stress field and deflections on welded parts.
A TIG welding arc can produce temperatures of up to 19,400 degrees. However the heat transfer efficiency for TIG welding can be as low as 20%, which means that 80% of the heat generated does not enter the electrode. Based on the above statement the amount of heat generated by the welding electrode on welded parts is around 3880 (20% of TIG welding arc temperature; Jeyaprakash et al., Citation2015).
Moslemi et al. (Moslemi et al., Citation2022) conducted a 3D FE analysis based on a thermal-elastic-plastic model using predicted Goldak’s parameters. These parameters were validated by experimental tests in terms of the size of the welding pool, temperature distribution and induced residual stress.
Maś et al. (Maś et al., Citation2014) used Thermographic measurement to detect the defects that may appear on a welded joint during welding. The materials used during the experimental analysis were Inconel 718, stainless steel 410 and stainless steel 321.
Saldanha et al (Saldanha et al., Citation2018) used Artificial Neural Network analysis to predict the Weld-Bead and the Heat Affected Zone in TIG welding. Feed-forward neural networks with a back propagation training algorithm were used.
The intelligent reconfigurable welding fixture (IRWF) was developed in this study to conduct the experimental study. The fixture consists of pneumatic clamps linked to the fixture control panel, Part detection sensors were used to detect the correct placement of the parts loaded on the welding assembly stations, thermocouples were used to measure the heat generated on the fixture and the fixture cooling system was used to reduce the cooling rate of the fixture during high volume production. In addition, a Thermographic camera was used to measure the amount of heat generated on the welded parts immediately after welding while the Solid edge FEA software was used to conduct a numerical simulation of the transient heat distribution welded parts during welding respectively.
The next section of this paper presents the materials and methods, experimental test setup, experimental test results, finite element analysis results as well as recommendations, acknowledgement, conclusion and references.
2. Materials and method
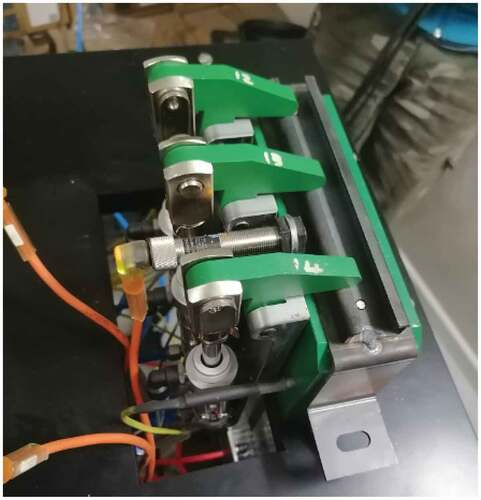
The developed IRWF utilizes clamping fingers attached to the pneumatic cylinder to clamp the welded parts on the respective fixture assembly stations. The fixture design was equipped with sensors on each station to detect the presence of parts and to reconfigure the clamping arrangement using the control system Programmable Logic Controller (PLC). The fixture was manufactured from aluminium 6082T6 alloy. Aluminium 6082T6 was selected because it is lightweight and dissipates heat rapidly. The IRWF was then coated with Teflon to create a non stick surface and to mitigate the adherence of welding splatter on the fixture during welding.
The parameters considered during the design of the IRWF include automated synchronization with the PLC, reconfigurability, and clamping force. The choice of control systems and other materials employed was driven by the need to meet the design requirements. The use of the pneumatic control systems plays a significant role in industrial automation systems because of the advantages of easy maintenance, cleanliness, low cost of production, availability and low energy consumption (Ahn & Yokota, Citation2005; Denkena et al., Citation2014; Ebel et al., Citation2010; Oladapo et al., Citation2015).
The objective of the study was to evaluate the heat distribution on welded parts, as well as on the fixture, by means of thermocouples and a thermographic camera. In addition, the results obtained from the experimental test evaluation served as inputs to the numerical simulation analysis. The heat distribution on the welded parts was quantified using both experimental and numerical simulation.
2.1. Reconfiguration novelties
The fixture design consists of part identification sensors on each welding station to detect the presence of the part and to also distinguish the respective part loaded. In instances where the incorrect part or non conforming parts are loaded at the station, the control system digital panel won’t display any part. When the parts are loaded correctly, the system will display the presence of the part on the station .This setup ensures the correct loading of parts for each welding cycle to minimize scraps. Once the parts are loaded, the sensors detect and send a signal to the control system PLC to activate the pneumatic clamping arrangements. The pneumatic cylinders were also fitted with proximity sensors to monitor the open and close movements of the cylinders.
The clamping pressure of the cylinders can also be varied to mitigate distortion on part during clamping operation. In addition the fixture was fitted with thermocouples to measure the amount of heat generated on the fixture during welding.
2.2. Welding assembly process methodologies
TIG welding operation was used to manually weld the components on the respective stations. The component used in the welding assembly process consists of the welding fixture, gas supply, tungsten electrode and the welding power source. Thermocouples embedded in the fixture block on each station were used to measure the amount of heat generated on the welding fixture while a Thermographic camera was used to record the amount of heat generated on the welded part during the welding operation. The schematic image of the welding assembly setup showing all the components is shown in Figure and the 3D representations of the welding assembly setup are shown in Figure . The parameters used to weld stainless steel according to Reddy Pinninti, (Citation2015) are shown in Table . Material thicknesses of 1.6 mm and 5 mm were used to evaluate the effective parameters required to weld stainless steel with various thicknesses.
Figure 1. 2D schematic representation of the welding assembly layout.
Figure 2. 3D representation of the welding assembly layout.
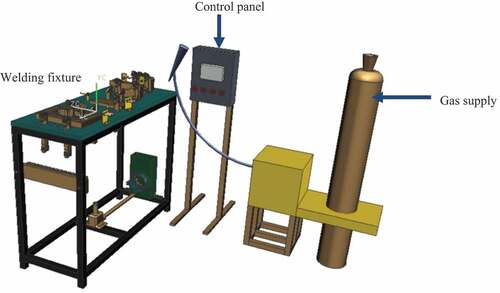
Table 1. Parameters for stainless steel welding (Reddy Pinninti, Citation2015)
The materials employed in the experiments are shown in Table .
Table 2. Materials employed in the experiments
2.3. Finite element analysis materials and methods
Solid edge 2019 FEA was utilized to conduct the transient heat distribution analysis on welded parts during welding assembly. The boundary condition with initial starting temperature and final temperatures with convection and welding cycle time was applied to the FEA study, followed by the mashing and results analysis.
3. Experimental setup
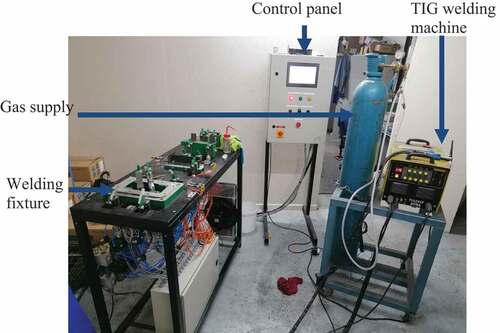
The intelligent reconfigurable welding fixture was developed for the TIG welding operation. The fixture utilizes pneumatic cylinders and part detection sensors for reconfiguration. The fixture was developed to be fully automated and synchronized with the control panel PLC. The various parts of the family of components of the IRWF design were welded using the manual TIG welding process on the actual fixture design to evaluate the heat distribution on both the parts as well as on the fixture. The thermocouples located in each fixture locating block were used to measure the heat generated on the fixture. In addition, a Thermographic camera was used to measure the temperature distribution on the actual parts immediately after welding. The experimental test setup showing the fixture, control panel and the TIG welding equipment is depicted in Figure . The data obtained from the experimental setup was used to quantify the heat distribution on welded parts and the fixture as well as for the initial inputs to the numerical simulation analysis.
Figure 3. TIG welding experimental test setup.
4. Experimental welding evaluation
The welding cycle times for each welded assembly were recorded using a stopwatch. The cycle time data also served as inputs to the FEA analysis study. The welding evaluation process was conducted with and without cooling to quantify the effects of using continuous cooling during welding on both the fixture and the welded parts. The welding assembly experimental evaluation test setups for each station are shown from Figures and the detailed Testo thermographic camera used to measure the temperature distribution on welded parts is shown in Figure .
Figure 4. Welding operation at station 1.
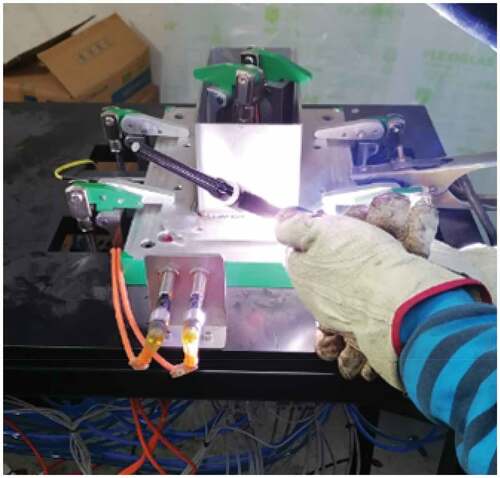
Figure 5. Welding operation at station 2.
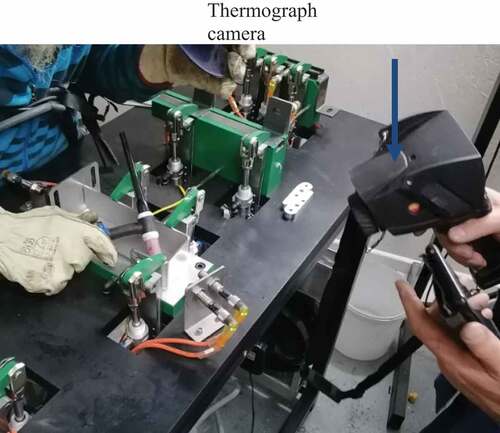
Figure 6. Welding operation at station 3.
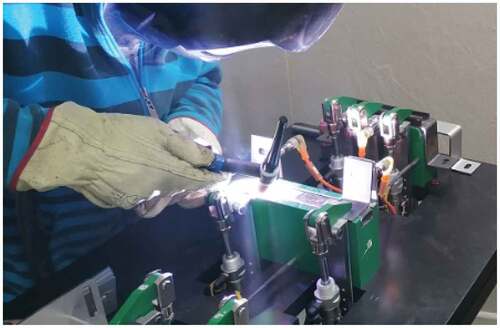
Figure 7. Welding operation at station 4.
5. Experimental test results
The experimental test results obtained from the thermocouples imbedded in the fixture block as well as the thermal distribution histograms from the Testo thermograph IR camera taken immediately after the welding cycle for the respective parts are presented in this section. Testo thermograph analyser uses an Infrared (IR) camera to carry out a wide range of different thermal imaging tasks. Crystal clear thermal images are taken from a wide angle; parallel digital real images of the same measuring object with manual or motor-driven focusing. The thermograph analyser measures the temperature by recording the IR energy emitted by the object. The camera can measure high temperatures of around 1200 °C safely from a minimum safety distance of around 200 mm. Different materials radiate different amounts of IR energy at the same temperature. This efficiency factor is called the emissivity, which is defined as the fraction of radiation emitted by an object as compared to the radiation emitted by a perfect radiator, called the blackbody, at the same temperature. The emissivity may vary from close to 0 (for a highly reflected mirror) to almost 1 (for a blackbody). The control panel with a PLC-based data acquisition system linked with thermocouples type K was used to measure the amount of heat generated on the fixture locating block at the respective stations and the temperature trends at each station were monitored on the control panel screen. The recorded cycle times for all the welded parts are tabulated in Table . These cycle times served as inputs for the FEA analysis.
Table 3. Recorded cycle times for the respective parts
5.1. Experimental results discussion
The experimental data obtained from the thermocouples and Thermographic camera on each station is presented in this section.
5.1.1. Station 1 (BO Tube assembly )
The ambient temperature of the respective stations prior to welding is shown in Figure . These temperature readings were measured by the type K thermocouples imbedded in the part locating blocks of the fixture at the respective stations. The data showing the heat distribution measured by the thermocouple during welding of BO tube assembly is presented in Table . The maximum temperature recorded by the thermocouple during welding was 24°C. Based on these results it is evident that very little heat is exerted on the fixture components during welding. The temperature difference measured between ambient and during welding was around 2.6 °C.
Figure 8. Temperature readings on all the stations.
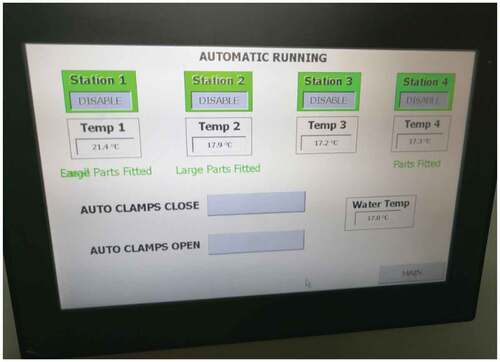
Table 4. Temperature trend during welding for station1 without cooling
The Testo thermographic picture data showing the emissivity and the starting temperature is presented in Table , while the heat distribution data taken immediately after welding is presented in Figure . The maximum temperature of 308°C was recorded closer to the welding path with a minimum of 50°C recorded across the part. In addition the temperature histogram shown in Figure across the welded area indicated that 8 % of the part experienced a maximum temperature of 308 °C and a minimum of 50 °C across the welded part. The Temperature profile measured across the welded area to quantify the maximum heat distribution is shown in Figure .
Figure 9. Thermographic data for Bo tube assembly.
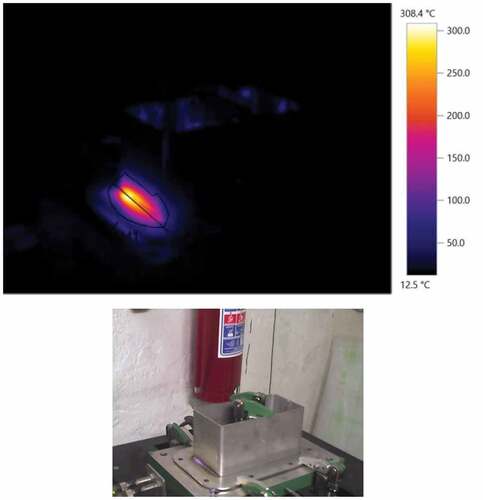
Figure 10. Temperature histogram on Bo tube assembly.
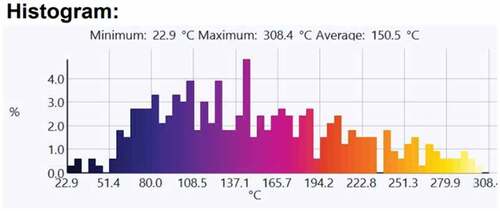
Figure 11. Temperature profile measured across the welded area.
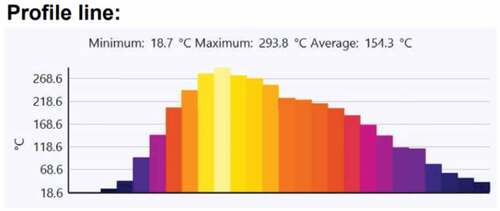
Table 5. Thermographic picture data
5.1.2. Station 2 (Support bracket )
The temperature trend results presented in Table also show that very little heat enters the fixture and its components during welding. The maximum temperature reading from the thermocouple located inside the part locating block for station 2 was 25.2°C, which indicates a temperature rise of 7.3°C from the ambient temperature of 17.9°C.
Table 6. Temperature trend during welding for station 2 without cooling
Although very little heat was generated on the fixture locating block without cooling, it was vital to further evaluate the effects of fixture cooling during continuous welding. The cooling rate of the fixture with and without cooling is presented in Table . The fixture cooling rate improved from 4 minutes when run without cooling to 2 minutes when cooling is activated. Based on these results, it is clear that cooling is beneficial for high volume production.
Table 7. Cooling rate of the fixture during welding
The thermographic data showing the emissivity and the starting temperature is presented in Table . The thermograph heat distribution data shown in Figure was captured immediately after the welding cycle was completed. The data shows the maximum temperature of 91.4°C was recorded closer to the welding path and a minimum of 10°C was recorded across the welded part. In addition the temperature histogram across the welded area indicates around 2% of the part experienced a temperature of 81.3 °C, while over 10% of the part around the welded area experienced a temperature of 15 °C. The detailed histogram is presented in Figure . The temperature profile measured across the welded area as depicted in Figure shows a minimum temperature of 16.8°C and a maximum of 111.3 °C.
Figure 12. Thermograph data on support bracket assembly.
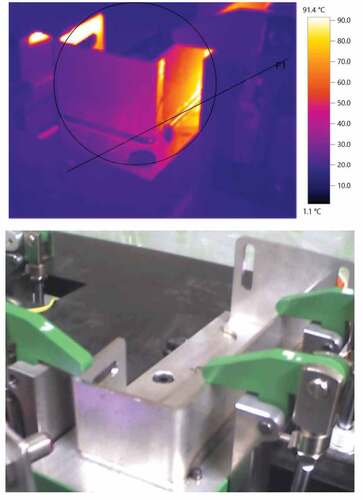
Figure 13. Temperature profile measured across the welded area.
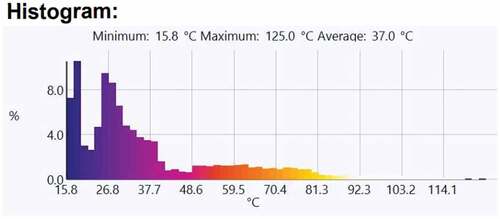
Figure 14. Temperature profile measured across P1.
Table 8. Thermographic Picture data
5.1.3. Station 3 (AO Bracket Fig )
The welding on this station was minimal and much localized. The result presented in Table clearly shows that very little heat was distributed to the fixture during welding. The temperature recorded by the thermocouple was the same as the ambient temperature shown in Figure for station 3.
Table 9. Temperature trends during welding without cooling
The thermographic picture data showing the emissivity and the starting temperature is presented in Table . The thermographic image taken immediately after welding shows the maximum temperature of 91.4°C was recorded closer to the welding path and a minimum of 10°C across the part, as shown in Figure . In addition the temperature histogram across the welded area indicates around 2% of the part experienced a temperature of 84.4 °C while over 30% of the part experienced a temperature 17.7 °C. The detailed histogram is presented in Figure .
Figure 15. Thermograph data on AO bracket assembly.
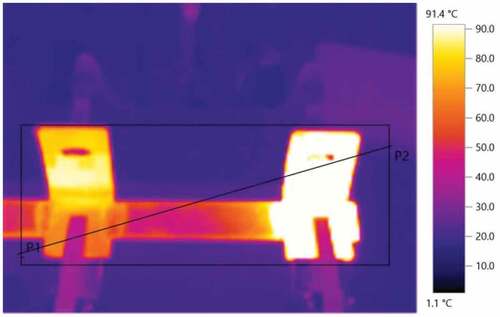
Figure 16. Temperature profile measured across the welded area.
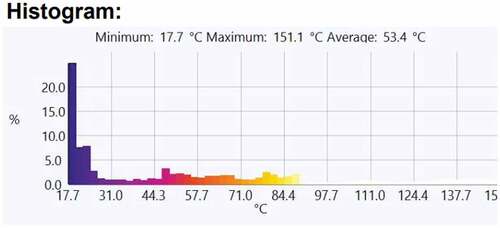
Table 10. Thermographic picture data
5.1.4. Station 4 (BO Bracket Fig )
The welding on this station was also minimal and much localized. The results presented in Table measured by the thermocouples showed no change in temperature from ambient. The Part locating block saw a close to nothing temperature change.
Table 11. Temperature trends during welding without cooling
The thermographic image data showing the emissivity and the starting temperature is presented in Table . The thermograph image taken immediately after welding shows the maximum temperature of 91.4°C was recorded closer to the welding path while a minimum of 10°C was recorded across the part as shown in Figure . In addition the temperature histogram across the welded area shows a minimum recorded temperature of 17.1°C and a maximum temperature of 108.1°C .The detailed histogram is presented in Figure . The welded parts are also shown in Figure .
Figure 17. Thermographic dta on BO bracket assembly.
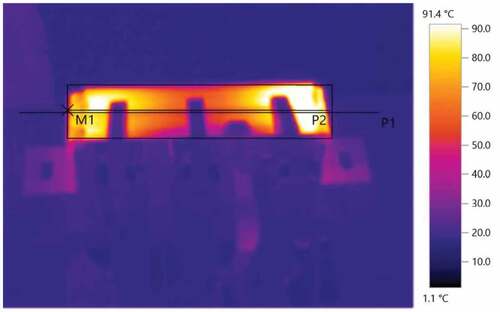
Figure 18. Temperature profile measured across the welded area.
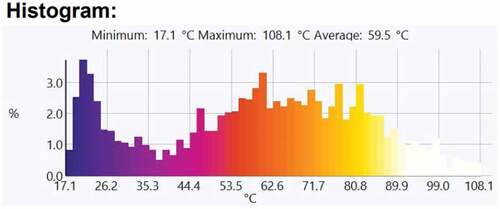
Figure 19. Welded parts.
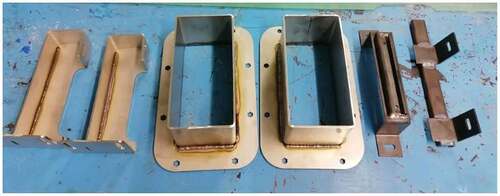
Table 12. Thermographic picture data
6. Finite element analysis study
The Solid edge Finite Element Analysis (FEA) was used to conduct the heat distribution study on welded parts during TIG welding. Peric et al. (Perić et al., Citation2014) assumed that the total heat input to the weld bead takes place via melting droplets, and that the heat flux is uniformly distributed over the weld volume. The above assumptions were also taken into account during the FEA analysis study.
6.1. Boundary conditions
Peric et al. (Perić et al., Citation2014) investigated the transient heat generated on welded parts using both numerical simulations and experiments. Two type K thermocouples with the ability to measure temperatures between − 220 and 1150 °C were used. The temperature ranging between 550 °C and 650 °C was recorded by the thermocouples closer to the welding path.
Ravinder et al. (Reddy Pinninti, Citation2015) also conducted a non-linear transient thermal analysis to obtain the global temperature history generated during the welding process. The temperature measured along the welding path ranged from 505°C to 550 °C.
According to Gardner & Ng, (Citation2006) the convective heat transfer or film coefficient of 25 W/m2K can be used for stainless steel 316.
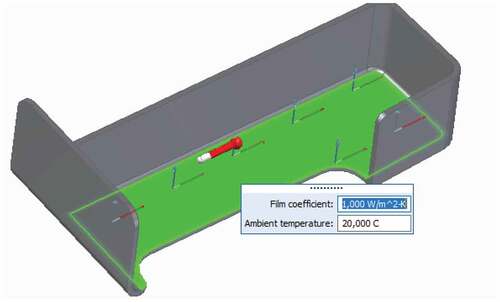
Based on the above statements by other researchers the boundary conditions used in the analysis study were the initial/ ambient temperature of 20°C (room temperature). The temperature exerted on parts during welding according to Reddy Pinninti, (Citation2015) and Perić et al., (Citation2014) was around 650°C and a Convection film coefficient of 25 W/m2K was used. The cycle time for each welded part as recorded during the experiment is shown in Table . The software input parameters required for the FEA analysis study are shown in Figures .
Figure 20. FEA input parameters.
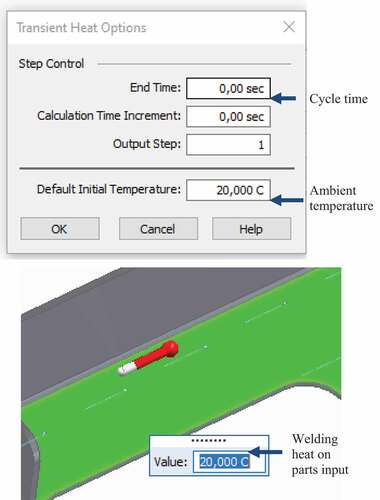
Figure 21. FEA input parameters.
6.2. Mesh
Finite element analysis was used to conduct the basic concept analysis of the structure, which is an assembly of discrete pieces called elements that are connected together at a finite number of points called nodes. Loading boundary conditions are then applied to these elements and nodes. The network of elements is called mesh (Reddy Pinninti, Citation2015).
Tetrahedral meshing was used during the transient heat analysis study. Tetrahedral mesh provides a very dense mesh in the weld pool and in the surrounding areas and coarser mesh in the areas far away from the weld in order to reduce the total number of elements.
6.3. Heat distribution results discussion for bo tube assembly
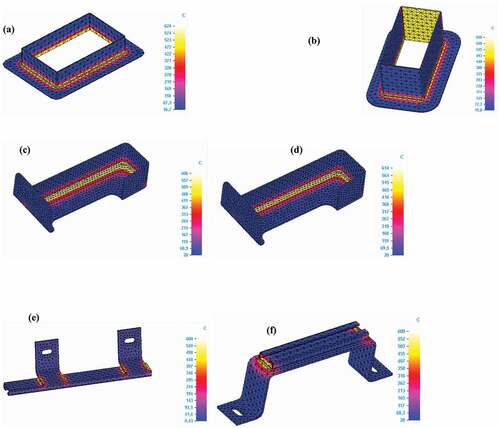
The thermal heat distribution on the BO tube assembly during TIG welding is shown in Figure . The temperature exerted on the welded parts according to Reddy Pinninti, (Citation2015) and Perić et al., (Citation2014) was between 550°C to 650°C and for this analysis study a temperature of 625°C was used as the temperature applied on the welded part closer to the weld and the heat distribution within the part was analyzed. The temperature distribution away from the welding path was found to be between 320°C and 16.7°C towards the edges of the part. In addition the results obtained show that the heat distribution around the clamping areas of the parts is very low and not a concern to the clamping fingers and other neighbouring components around the edges of the parts.
Figure 22. (a) BO tube assembly, (b) Tube assembly, (c) Support bracket small, (d) Support bracket big, (e) AO bracket, (f) BO bracke.
6.4. Heat distribution results discussion for tube assembly
The thermal heat distribution on Tube assembly during TIG welding is shown in Figure . The starting welding temperature of 650°C closer to the weld was used in the analysis study and the heat distribution within the part was analyzed. The result shows that the heat was localized and gradually dissipated across the part. A temperature as low as 19.8°C around the edges and on the clamping area of the part was observed. Based on the results presented it can be safely deduced that the clamping fingers used to clamp the part during welding will easily survive the temperatures exposed to it during welding.
6.5. Heat distribution results discussion on support bracket (Small)
The thermal heat distribution on the support bracket during TIG welding is shown in Figure . The starting welding temperature of 610°C closer to the weld was used in the analysis study and the heat distribution within the part was analyzed. The result shows that the heat was localized and gradually dissipated across the part. A temperature as low as 20°C around the edges and on the clamping area of the part was observed. Based on the results presented, it can be safely deduced that the clamping fingers used to clamp the part during welding will easily survive the temperature exposed to it during welding.
6.6. Heat distribution results discussion on support bracket (Big)
The thermal heat distribution on the support bracket during TIG welding is shown in Figure . The starting welding temperature of 615°C closer to the weld was used in the analysis study and the heat distribution within the part was analyzed. The result shows that the heat was localized and gradually dissipated across the part. A temperature as low as 20°C around the edges and on the clamping area of the part was observed. Based on the results presented it can be safely deduced that the clamping fingers used to clamp the part during welding will easily survive the temperatures exposed to it during welding.
6.7. Heat distribution results discussion on AO bracket
The thermal heat distribution on the AO Bracket during TIG welding is shown in Figure . The starting welding temperature of 600°C closer to the weld was used in the analysis study and the heat distribution within the part was analyzed. The result shows that the heat was localized and gradually dissipated across the part. A temperature as low as 9°C around the edges and on the clamping area of the part was observed. Based on the results presented it can be safely deduced that the clamping fingers used to clamp the part during welding will easily survive the temperatures exposed to it during welding.
6.8. Heat distribution results discussion on BO bracket
The thermal heat distribution on the BO Bracket during TIG welding is shown in Figure . The starting welding temperature of 600°C closer to the weld was used in the analysis study and the heat distribution within the part was analyzed. The result shows that the heat was localized and gradually dissipated across the part. A temperature as low as 20°C around the edges and on the clamping area of the part was observed. Based on the results presented it can be safely deduced that the clamping fingers used to clamp the part during welding will easily survive the temperatures exposed to it during welding.
7. Conclusion
The intelligent welding assembly system that enhances the precision and quality of welded parts was developed successfully. The assembly system utilizes a pneumatic cylinder to clamp and hold the parts during welding assembly process. The system was equipped with a cooling system used to cool the parts during welding. Thermocouples embedded in the fixture assembly stations were successfully used to quantify the amount of heat generated on the fixture during welding. The Thermographic camera was also utilized to measure the temperature on welded parts. A heat analysis study conducted on an intelligent reconfigurable fixture using thermocouples yielded very good results. It was successfully proven that very little heat is generated on the fixture and its components during TIG welding operations. Furthermore the effects of using cooling on the fixture during welding were also analysed and the result presented shows a significance reduction in the cooling rate of the fixture, from 4 min with no cooling to 2 min with cooling. The faster cooling rate of the fixture is significant, especially during mass production, since it will not be required to wait for the fixture to cool down to ambient temperature before loading the next part on the station.
The Testo Thermographic camera data presented on the welded parts also proved that the welding heat is localized and dissipates quickly away from the welding path towards the edges. The heat distribution on welded parts was successfully evaluated using both the experimental and FEA analysis.
Acknowledgements
Acknowledgements are expressed to the Manufacturing Engineering and Related Services SETA (MerSETA), the National Research Foundation (NRF), Gibela Rail Transport Consortium (GRTC), the Technology Innovation Agency (TIA), and the Tshwane University of Technology (TUT) for financial assistance to execute the study.
Disclosure statement
No potential conflict of interest was reported by the author(s).
Additional information
Funding
Notes on contributors

Walter Thabo Seloane
Seloane Walter Thabo is a PHhD candidate and Rresearch fellow in Industrial Engineering at Tshwane University of Technology. The authors are members of the Gibela Research Chair in Manufacturing and Skills Development at Tshwane University of Technology, South Africa. The research chair is led by Prof. Khumbulani Mpofu. The team’s research cuts across the following niche areas: Intelligent manufacturing systems, reconfigurable welding fixture design and development, Expert Systems, Artificial Intelligence, Robotics in Manufacturing and Mechatronics. The team is involved in numerous projects: merSETA Localisation Project For Incubation And Skills Development; Virtual Commissioning in Transport Manufacturing Enterprises; manufacturing Research focusing on the locomotive; Smart Mobility Systems; and the Smart Factory Project.
References
- Ahn, K., & Yokota, S. (2005). Intelligent switching control of pneumatic actuator using on/off solenoid valves. Mechatronics, 15(6), 683–21. https://doi.org/10.1016/j.mechatronics.2005.01.001
- Arunkumar, N. (2012). Evaluation of mechanical properties of dissimilar metal tube welded joints using inert gas welding. Evaluation’. ITERA, 2(5), 1709–1717. https://citeseerx.ist.psu.edu/viewdoc/download?doi=10.1.1.445.2258&rep=rep1&type=pdf.
- Avadheshkumar, H. V. R., & Patel, M. (2017). A review paper on TIG welding process parameters. International Journal for Scientific Research & Development, 5(2), 2321–2613. https://www.ijsrd.com/articles/IJSRDV5I21226.pdf.
- Darmawan, T., Priadythama, I., & Herdiman, L., (2018): Conceptual design of modular fixture for frame welding and drilling process integration case study: Student chair in UNS industrial engineering integrated practicum. Conference Proceedings, 030033. https://doi.org/10.1063/1.5024092:34-56.
- Denkena, B., Dahlmann, D., & Kiesner, J. (2014). Sensor integration for a hydraulic clamping system. Processing Technology, 15(2014), 465–473. https://doi.org/10.1016/j.protcy.2014.09.006
- Ebel, F., Idler, S., Prede, G., & Scholz, D. (2010). Pneumatic, electro-pneumatics fundamentals. In FESTO textbook (pp. 1–212). FESTO Diadactic & Co.
- Erdem, I., Lewandoski, C., Berlin, C., Kihlman, H., & Stahre, J. (2017). A novel comparative design procedure for reconfigurable assembly fixtures. CIRP Journal for Manufacturing Science and Technology, 19, 93–105. http://dx.doi.org/10.1016/j-cirpj-2017.06.004
- Ericsson, M. (2003). Simulation of robotic TIG-welding. Department of Technology University of Trollhättan/Uddevalla P.O. Box.
- Gardner, L., & Ng, K. T. (2006). Temperature development in structural stainless steel sections exposed to fire. Fire Safety Journal, 41(3), 185–203. https://doi.org/10.1016/j.firesaf.2005.11.009
- Jeyaprakash, N., Haile, A., & Arunprasath, M. (2015). The parameters and equipments used in TIG welding. the International Journal of Engineering and Science (IJES), 4 (2), 11–20. https://docslib.org/doc/10324726.
- Joshi, J. (2014). Parametric optimization of metal inert gas welding and tungsten inert gas welding by using analysis of variance and grey relational analysis. International Journal of Science and Research, 3(6), 1099–1103. https://www.ijsr.net/archive/v3i6/MDIwMTQ0MDU.
- Kaya, N. (2006). Machining fixture locating and clamping position optimization using genetic algorithms. Computers in Industry, 57(2), 112–120. https://doi.org/10.1016/j.compind.2005.05.001
- Kazi, J. (2015). A review on various welding techniques. International Journal of Modern Engineering Research, 5(2), 22–28. https://www.slideshare.net/IJMER/d0502-02-2228.
- Larry, F. J. (2002). Welding and Metal Fabrication. Welding Principles and Applications Publisher Cengage Learning. https://books.google.com/books/about/Welding_and_Metal_Fabrication.
- Larry, F. J. (2012). Welding and metal fabrication. Publisher Cengage Learning.
- Li, B., & Melkote, S. N. (1999). Improved workpiece location accuracy through fixture layout optimization. International Journal of Machine Tools and Manufacture, 39(6), 871–883. https://doi.org/10.1016/S0890-6955(98)00072-8
- Li, Y., Wang, K., Jin, Y., Xu, M., & Lu, H. (2014). Prediction of welding deformation in stiffened structure by introducing thermo-mechanical interface element. Jurnal for Mateial Process Technology, 216, 440–446. rotec.2014.10.012 https://doi.org/10.1016/j.jmatp
- Maś, K., Woźny, M., Marchewka, M., Płoch, D., & Sheregii, E. M. (2014). The termographic analysis of the welding by TIG. International Sccientific Journal of Machines. Technologies Materials.”. WEB 1314-507X; PRINT 1313-0226.
- Moroni, G., Petro, S., & Polini, W., 2014: Robust design of fixture configuration. 24th CIRP Design Conference, Procedia CIRP 189–194.
- Moslemi, N., Gohari, S., Abdi, B., Sudin, I., Ghandvar, H., Redzuan, N., Hassan, S., Ayob, A., & Rhee, S. (2022). A novel systematic numerical approach on determination of heat source parameters in welding process. Journal of Materials Research and Technology, 18, 4427–4444. https://doi.org/10.1016/j.jmrt.2022.04.039
- Namthakumar, K., & Prabakaran, V. (2014). Design and fabrication testing of combined multipurpose jig and fixture. Journal of Mechanical and Civil Engineering (IOSR-JMCE). https://article.sciencepublishinggroup.com/html/10.11648.j.sr.20150304.19.
- Naveen, A. M., & Girish, V. A. (2014). Design of welding fixture for head end sub-assembly of motor case. International Journal of Science and Technology Research, 3(6). https://www.ijstr.org/final-print/june2014/Design-Of-Welding-Fixture.
- Oladapo, B. I., Balogun, A. V., Afolabi, S. O., Azeez, T. M., & Asanta, S. P. (2015). Simulation model to explore the characteristic pump curve of an injection molding machine: A case study of ABUAD water plant. International Journal of Engineering Business Enterprise Application, 13(1), 63–68. https://www.sciencedirect.com/science/article/pii/S1665642317300639.
- Patanayak, S., & Kumar Sahoo, S. (2021). Gas metal arc welding based on additive manufacturing. Journal of Manufacturing Science and Technology, 33, 398–442. https://doi.org/10.1016/j.cirpj.2021.04.010
- Patel, S. B. C., & Gandhi, J. (2013). Optimizing and analysis of parameter for pipe welding: A literature review. International Journal of Engineering Research & Technology (IJERT), 2(10), 229–234. https://www.ijert.org/research/optimizing-and-analysis-of-parameter%20for%20pipe%20welding
- Pelinescu, D. M., & Wang, M. Y. (2002). Multi-objective optimal fixture layout design. Robotics and Computer Integrated Manuf, 18(5–6), 365–372. https://doi.org/10.1016/S0736-5845(02)00027-3
- Perić, M., Tonković, Z., Rodić, A., Surjak, M., Garašić, I., Boras, I., & Švaić, S. (2014). Numerical analysis and experimental investigation of welding residual stresses and distortions in a T-joint fillet weld. Materials & Design, 53, 1052–1063. https://doi.org/10.1016/j.matdes.2013.08.011
- Raghu, A., & Melkote, S. N. (2004). Analysis of the effects of fixture clamping sequence on part location errors. International Journal of Machine Tools and Manufacture, 44(4), 373–382. https://doi.org/10.1016/j.ijmachtools.2003.10.015
- Reddy Pinninti, R. (2015). Simulation of TIG welding process. https://www.researchgate.net/publication/274952206
- Rong, Y., Zhang, G., & Huang, Y. (2016). Study of welding distortion and residual stress considering nonlinear yield stress curves and multi constraint equations. Journal for Material Engineering Performance, 25(10), 4484 94. https://doi.org/10.1007/s11665-016-2259-1
- Saldanha, S. L., Kalaichelvi, V., & Karthikeyan, R., (2018): Prediction analysis of weld-bead and heat affected zone in TIG welding using orks. IOP Conference Series: Materials Science and Engineering, 46 012038.
- Wang, Y., Chen, X., Liu, Q., & Gindy, N. (2006). Optimization of machining fixture layout under multi-constraints. International Journal of Machine Tools and Manufacture, 46(12–13), 1291–1300. https://doi.org/10.1016/j.ijmachtools.2005.10.014
- Wang, C., Kim, Y. R., & Kim, J. W. (2014). Comparison of FE models to predict the welding distortion in T-joint gas metal arc welding process. International Journal for Advanced Manufacturing Technology, 18(8), 1637–1931. https://doi.org/10.1007/s12541-014-0513-8
- Wang, B. F., & Nee, A. Y. C. (2011). Robust fixture layout with the multi-objective non-dominated ACO/GA approach. CIRP Annals, 60(1), 183–186. https://doi.org/10.1016/j.cirp.2011.03.006
- Wang, H., Rong, Y. K., LI, H., & Shaun, P. (2010). Computer aided fixture design, recent research and trends. Computer-Aided Design, 42(12), 1085–1094. https://doi.org/10.1016/j.cad.2010.07.003