
Abstract
This study is aimed at using geotechnical properties and statistical relationship between geotechnical parameters to evaluate the performance of subsoil derived two different rock types for pre- and post-engineering construction planning and design of roads. Twelve soil samples underlain by two rock types (granite gneiss & grey gneiss) were taken at the depth of 1 m for analysis. The geotechnical properties of these soils were tested. The atterberg limit, grain size analysis, California bearing ratio (CBR) and compaction tests of both soils types met the Nigeria specifications of good subgrade material. Soil derived from grey gneiss has better ratings in linear shrinkage, grain size analysis, specific gravity, compaction and CBR tests. Twelve parameters of the soil samples were correlated against each other and sixty-six values of correlation coefficient were recorded for each rock type. Soil derived from grey gneiss has more positive pairwise Pearson’s (r) correlation (37) than the soil derived from granite gneiss (34). Granite gneiss derived soil has better ratings in thirty-three (33) out of sixty-six (66) Pearson’s correlation (r) values to thirty-two (32) of grey gneiss with one of the variables correlation having the same value. There exist five strong positive and five strong negative correlation variables that are common to the two rock types’ derived soils. The Pearson’s correlation coefficient (r) values that are within the critical (r) value are negligible. For regression analysis, granite gneiss derived soil has better ratings than the grey gneiss derived soil with both rock types derived soils having these two pairwise correlation variables (GRV-SAND and OMC-MDD) for excellent prediction.
1. Introduction
People have been victims of bad roads, damaged buildings and many properties have been lost in the process. Several authors like Agbede et al. (Citation2015), Ogunribido et al. (Citation2015), Oyelami and Alimi (Citation2015), Alo and Oni (Citation2018), Olabode (Citation2019), Olofinyo et al. (Citation2019), Ademila et al. (Citation2020), and Ale (Citation2021) have identified incompetent subsoil material and combination of other factors such as topography, poor drainage system and bad materials used as reasons for many of the buildings and road failures. Other authors (Aginam et al., Citation2015; Amadi et al., Citation2015; Adebisi et al., Citation2016; Ologun et al., Citation2019; Falowo et al., Citation2019; Oluwakuse et al., Citation2020; Adeyemi & Oyeyemi, Citation2000; Ale et al., Citation2022) have found no significant difference in the ratings of soils under failed and stable portions. Adelusi et al. (Citation2013) and Eissa (Citation2021) rated incompetent subsoil as the number one cause of failure in many buildings and roads construction. In some instances, the properties of subsoil in the immediate vicinity of the construction site may not meet the required Nigerian standards while in other instances where the soil material is competent; failure is caused by usage and over-dependence on the constructed project. The geological factors influencing road failures are the nature of soils (for subgrade, sub-base and base materials) and the near surface geological structures such as fractures and faults, (Momoh et al., Citation2008; Adiat et al., Citation2009). The occurrence and distribution of soils in nature vary from place to place and their geotechnical properties influence each other. Poor engineering properties of subsoil (low MDD, poor bearing capacity, high compressibility, high liquid limit, plasticity index, OMC and California bearing ratio (CBR)) have been highlighted as reasons for road failure (Akpan, Citation2005; Ademilua, Citation2018) and are influenced by their mineral composition (Akpan, Citation2005; Amadi et al., Citation2012). Many of these factors have contributed tremendously to pavement failures. Alo and Oni (Citation2018) recommended the removal of the poor subsoil materials and replacing it with good soil material. Akintorinwa and Adelusi (Citation2009) noted that adequate site characterization is needed to prevent needless loss of lives and valuables that always accompany road failure.
The type of soil formed is a function of the parent rock type, mineral constituents and the peculiarity of the region. Akintorinwa and Oluwole (Citation2018) compared the properties of subsoil underlain by different parent rocks and found out that soil derived from Charnockite, Migmatite and granite rock have higher shear strength than the low cohesive nature of quartzite. A Nigerian good soil material must meet and exceed expectation/specification of tropical environment (Ale, Citation2022). Quality attention must be given to combinations of factors responsible for failure of these roads in order to achieve sustainable development in developing countries. The major road that passes through Erusu Akoko is a federal road of about 3.5 kilometers which links the northern part of Nigeria with the southern part. Erusu Akoko road is underlain by two major rock types of granite gneiss and grey gneiss. On this road are visible cracks, potholes, bulges and depression caused majorly by heavy duty trucks plying this road. This study is aimed at using geotechnical properties and statistical relationship between geotechnical parameters to evaluate the performance of subsoil derived two different rock types for pre- and post-engineering construction planning and design of roads. This analysis will also help to establish which of the two rock types’ derived soil has better geotechnical properties. The obtained results will be compared with international and national standards and recommendation of suitable materials (In-situ or Ex-situ).
2. Study area
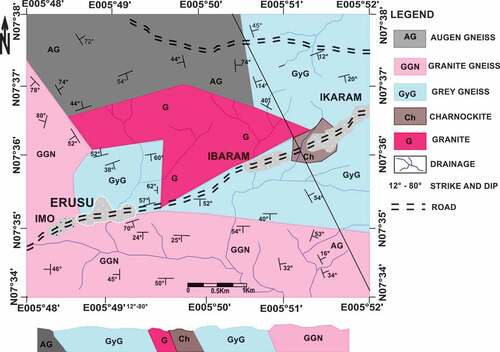
The study area is Erusu-Akoko in Akoko Northwest local government of Ondo State. Erusu-Akoko lies between longitude 005° 48ʹE and 005° 50ʹE and latitude 07° 33’ N and 07° 35ʹN of the Greenwich meridian (Figure ). The area is accessible by a major road, minor roads and footpaths. There are linear settlements along this major road that links the northern part of Nigeria with the southern part. Erusu Akoko is moderately populated and is surrounded by towns such as Imo Arigidi, Ibarram Akoko, ikaram and Auga Akoko. The humid climate conditions of the area are typical rain forest found in southwestern part of Nigeria with wet and dry seasons. The mean annual temperature is between 27°C and 33°C while the mean monthly humidity is less than 70% (Akinseye, Citation2010). This tropical climate condition favours both physical and chemical weathering of the area. The wet season starts in late march/early April and lasts till October while the dry season usually comes between November and March. The mean annual rainfall ranges between 1500 mm and 1800 mm and the temperature in the area varies between 28°C and 38°C with high temperature occurring between February and April (Akinseye, Citation2010). The drainage pattern is generally dendritic and the direction of the flow of the river is topographically control due to the nature of the terrain. Etioro Akoko falls within the Precambrian Basement Complex rocks of south-western Nigeria. Rahaman (Citation1988) noted that an assemblage of migmatite, gneisses, schist and quartzite into which there has been a positioning of granitic and, to a minor extent, more basic materials make up the Precambrian Basement Complex rocks of south-western Nigeria. Granite gneiss and grey gneiss are the major rock types in Erusu Akoko (Figure ) Ademila and Adebanjo (Citation2017) mapped porphyritic granite (which appeared in minor occurrences), augen gneiss and charnockite in the study area. They also noted several quartzite intrusions cutting across the granite.
Figure 1. Location map of the study area (insight is map of Nigeria and Ondo State).
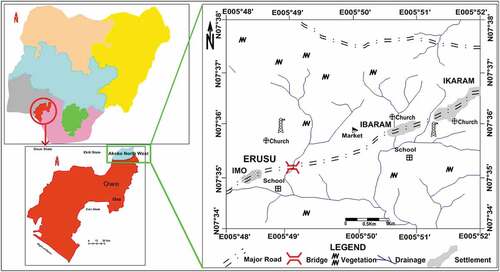
Figure 2. Geological map of Erusu Akoko and the surrounding towns (modified after Ademila & Adebanjo, Citation2017).
3. Materials and method
3.1. Geotechnical method
This field reconnaissance was carried out to assess the local conditions of the study area (previous road construction, drainage conditions and types of soil) and mark the soil sampling locations. Twelve disturbed subsoil samples (bulk samples) were collected from twelve trial pits along the major road in Erusu Akoko, Southwestern Nigeria. Six of the twelve soil samples (SP1-SP6) were taken from trial pits located within the geology of granite gneiss while the other six soil samples (SP7-SP12) were taken from trial pits located within the geology of grey gneiss. Soil samples were taken at a depth of 1 m; labels are attached to the polythene nylon bags to identify the soil samples. The soil for natural moisture content (500 g each) was collected into sealed nylon to prevent moisture loss and was determined immediately in the Engineering Geology Laboratory of the Adekunle Ajasin University Akungba Akoko. Soil samples were air dried for two weeks before conducting other analysis. All the tests were carried out in accordance with British standard code of practice (British Standard Citation1990). Natural Moisture content (NMC) was done in accordance with American Society for Testing and Materials (ASTM) D2216. To carry out Atterberg limits tests (liquid limit, plastic limit and linear shrinkage), the soil samples were passed through a test sieve of No. 40 (425 μm). Afterward, the soil samples were mixed with water to achieve the desired standard and the condition was allowed to stand for 24 hours. Liquid limit test was done in accordance with American Society for Testing and Materials (ASTM) D4318 and American Association of State Highway and Transportation Officials (AASHTO) T 89 while Plastic limit test was done in accordance with ASTM D4318 and AASHTO T 90. Linear Shrinkage test is done in accordance with ASTM D4943. The water pycometer method of specific gravity was used and the procedure was carried out in accordance with ASTM D854 and AASHTO T 100 standard. The particle-size analysis of soil samples was done in accordance with ASTM D422-63 standard. Set of sieves used consist of the following sizes: 4.75 mm, 2.36 mm, 1.18 mm, 850 μm, 425 μm, 300 μm, 150 μm, 75 μm and pan. A standard Proctor test was carried out in accordance with ASTM D 698 specification. The California Bearing Ratio (CBR) tests (penetration resistance) of soil samples were carried out in accordance with ASTM D1883-05. Laboratory soil testing methods were done for the twelve soil samples. All the analyses were carried out at the Engineering Geology laboratory of Adekunle Ajasin University Akungba Akoko.
3.2. Statistical analysis of Pearson’s correlation coefficient and coefficient of determination
Pearson’s Correlation Coefficient (r) is a calculated statistic used to determine whether a relationship exists between two variables. The Pearson correlation coefficient is also an inferential statistic that gives information about the magnitude of the association and the direction of the relationship because it is based on the method of covariance. The statistics were done separately for soils derived from two rock types using values of the analysed parameters. These parameters are Natural moisture content (NMC), liquid limit (LL), plastic limit (PL), plasticity index (PI), linear shrinkage (LS), specific gravity (SG), percentage of gravel (GRV), percentage of sand (SAND), percentage of fines (FINE), California bearing ratio (CBR), optimum moisture content (OMC) and maximum dry density (MDD). Correlation of geotechnical parameters is employed to determine the strength (strong or weak) and direction (negative (−1.0) or positive (+1.0)) of association between these two variables. The degree of freedom (DF) for these statistics (N-2) is 66 (where N is the number of scores). Alpha level of = 0.05 was chosen for a one tailed test i.e. we are willing to accept 5% chance of error. If the critical r value is higher than the correlation coefficient (r) value we accept the null hypothesis; if otherwise, we reject the null hypothesis in favour of the test hypothesis. The coefficient of determination is a statistical measurement that allows researchers to understand how the differences in one variable can be explained by the difference in a second variable, when predicting the outcome of a given event which will help to make better decisions. Coefficient of determination (r2) uses regression analysis to predict the level of dependence of one variable (y) on another variable (x). Researchers use regression analysis to identify which variables (parameters) have more impact (high value) and variables that can be ignored because of low values. The formula for simple linear regression is Y = mX + b, where Y is the response (dependent) variable, X is the predictor (independent) variable, m is the estimated slope, and b is the estimated intercept. The closer the value (x) is to 1 the better x explains y. Surfer and Excel software packages were used for statistical analysis.
4. Discussion
4.1. Index properties
Natural moisture content of a soil is a function of the soil grain size distribution, topography, climate and the period of soil sampling/collection. Excessive moisture content in soil can cause a great deal of problems if poorly managed. The values of the moisture content range from 9.1% to 14.8% for granite derived soil (mean and standard values of 11.8 ± 2.18) and from 6.7% to 20.0% for grey gneiss derived soil (mean and standard values of 14.9 ± 4.97) as presented in Tables . Applying the obtained results with the Underwood (Citation1967) classification of natural moisture content values, all of the soil samples derived from granite gneiss rock type and three soil samples (SP9-SP11) derived from grey gneiss rock type fall under suitable engineering material while soil samples (SP7, SP8 and SP12) derived from grey gneiss rock type fall within marginal and unfavourable materials. The values of natural moisture content in Erusu area followed a consistent pattern for all the sampled soils. The little variation observed in the values of the sub-soils is caused by soil heterogeneity. According to the recommendation of the Federal Ministry of works and Housing (Federal Ministry of Works and Housing (FMWH), Citation2010); any value higher than 15% is not good for engineering construction, Three (3) out of twelve samples are not good for engineering materials.
Table 1. Summary of the geotechnical properties of the twelve sampled soils from granite gneiss and grey gneiss
Table 2. Descriptive statistics of geotechnical properties of soils derived from two rock types
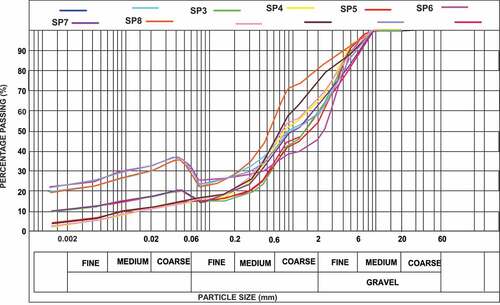
Particle size distribution gives an idea about the gradation of the soil. Shape and size of the soil affect the shear resistance (Dafalla, Citation2013; Roy & Kumar-Bhalla, Citation2017). The gravel, sand and fine contents of the granite gneiss derived soil samples with their mean and standard deviation values range from 21.5% to 49.2% (36.4 ± 8.87), 25.4% to 61.9% (43.5% ± 12.32) and 14.6% to 25.5% (19.8 ± 4.99) respectively as presented in Tables . For grey gneiss, the gravel, sand and fine contents with their mean and standard deviation values range from 17.0% to 45.9% (33.3 ± 9.89), 28.3% to 60.6% (48.4% ± 11.17) and 15.1% to 25.8% (18.3 ± 4.65; Tables ). According to Federal Ministry of Works and Housing general specification requirements for roads and bridges (Federal Ministry of Works and Housing (FMWH), Citation1997), all the soil samples are suitable for sub-grade, sub-base and base materials as the percentage by weight finer than NO 200BS test sieve are far less than 35% and cannot be affected by seasonal variation change. Grey gneiss derived soils have lesser values of percentage of fine and more coarse contents when compared with granite gneiss derived soil. All the soil samples are well graded because of the wide range of particle sizes on the grain size distribution curve from fine to coarse (Figure ).
Figure 3. Grain size analysis of the 12 soil samples from Erusu Akoko.
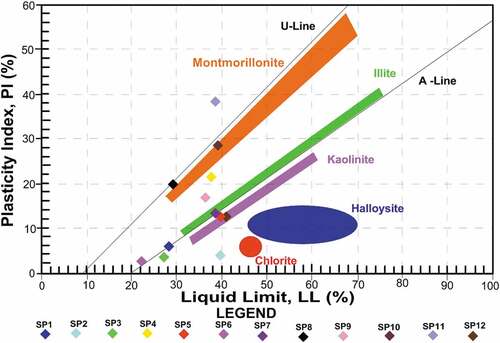
The liquid limit, plastic limit and plasticity index values for granite gneiss derived soil with their mean and standard deviation values range from 22.2% to 39.6% (32.3 ± 7.44), 15.7% to 35.7% (24 ± 6.87) and 2.6% to 21.7% (8.4 ± 7.48) respectively (Tables ). For grey gneiss, the liquid limit, plastic limit and plasticity index values with their mean and standard deviation values range from 29.1% to 40.8% (37.0 ± 4.13), 0% to 28.3% (15.3 ± 10.74) and 12.5% to 38.5% (21.7 ± 10.1) respectively (Tables ). Soils with low liquid limit possess good bearing capacity and should be the target for every engineering construction. The Nigerian specification of good soil as directed by Federal Ministry of Works and Housing (FMWH; Citation2010) recommends liquid limit not greater than 80% and plasticity index not greater than 55% for sub-grade materials while it should not be greater than 35% and 12% respectively for both sub-base and base materials. All the soil samples met the requirement for sub-grade soil while SP9 of grey gneiss derived soil, SP1, SP3 and SP6 of granite derived soil met the requirement of sub-base and base specification. Granite gneiss derived soil performed better than the grey gneiss soil. Casagrande plasticity chart uses atterberg limit to explain what percentage of fine grain soil is clay and by so doing we know the percentage of silt. Based on Casagrande’s plasticity chart classification (Casagrande, Citation1947); six samples (SP4, SP6, SP8, and SP9-SP11) were above the A-line while the other six samples (SP1-SP3, SP5, SP7 and SP12) were below the A-line (Figure ). SP4, SP9, SP10 and SP11 fall within the clay medium compressibility (CI), another four (SP1, SP3, SP6 and SP8) fall within clay low compressibility (CL) while the remaining four (SP2, SP5, SP7 and SP12) fall within the silt category (Table and Figure ). The activity of clay defines the relationship between plasticity index and clay fraction as percentage. The activity values of the soil samples are presented in Table . The activity values range between 0.20 and 2.03. In clay classification, activity less than 1 signify kaolinite, while activity between 1 and 2 corresponds to illite and greater than 2 corresponds to montmorillonite. Similarly, activity values less than 0.75 implies that the mineral is inactive, between 0.75 and 1.25 is regarded as normal, and value greater than 1.25 is active. This implies that five of the six soil samples (SP1-SP3, SP5 and SP6) derived from granite gneiss rock and one of the soil samples (SP7) derived from grey gneiss rock fall into the inactive group, SP7 and SP12 of grey gneiss rock fall into normal cay while others (SP4, SP8, SP10 and SP11) fall into the active clay category based on Skempton (Citation1953) interpretation (Table ). All the soil samples have either kaolinite or illite to be the predominant clay minerals present and posses low to moderate expansion potentials (Figure ).
Figure 4. Plots of the twelve soil samples on the Casagrande Plasticity chart (ASTMD 2487).
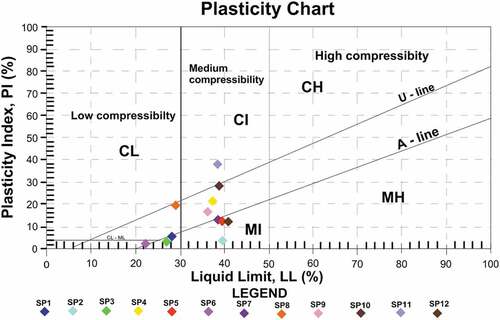
Figure 5. Plots of the twelve sampled soils from Erusu Akoko on the activity chart. The “A-line” separates Kaolinite (purple colour and below) from Illite (green colour and above) while the Orange colour and above implies montmorillonite (Smectite).
The linear shrinkage values of both granite gneiss and grey gneiss derived soils with their mean & standard deviation values range from 2.9% to 7.9% (5.4 ± 1.94 for granite gneiss derived soil and 5.3 ± 1.99 for grey gneiss derived soil; Tables ). All of the soil samples fall within the recommended standard of Ola (1983) and Brink et al. (Citation1982) of 8% and Gidigasu (Citation1974) of 10% for a good soil material. Based on this test, all the soil samples are good as subgrade, subbase and base materials. Lower values are considered best; in this case, the grey gneiss derived soil is better rated than granite derived soil. The specific gravity values with mean and standard deviation values of granite gneiss derived soil range from 2.60 to 2.67 (2.64 ± 0.03) while the specific gravity with mean and standard deviation values of grey gneiss derived soil ranges from 2.59 to 2.63 (2.61 ± 0.02; Tables ). The tested soils have moderately high values that fall within sandy and silty sand in Bowles (Citation1992) classification. Soil samples derived from granite gneiss have higher values than the grey derived soil which is an indication of higher degree of weathering for granite gneiss derived soil. Lower specific gravity value indicates a coarse soil, while higher values indicate a fine grained soil. This implies that granite gneiss has more fine content and less coarse content as seen in Figure .The obtained value of the sampled soils for specific gravity fall within 2.5 and 3.6 that was reported by Maignien (Citation1966) for tropical African lateritic soils. According to American Association of State Highway and Transportation Officials (AASHTO, Citation1993) soil classification, SP1 SP2 and SP3 of granite gneiss derived soil have excellent ratings of A-1-a or A-1-b while the other samples are classified as either A-2-6 or A-2-7 materials (granular material with good rating). All the twelve soil samples are good material for road constructions having satisfied all the conditions for sub-grade and sub-base materials (Table ).
4.2. Strength properties
The California bearing ratio (CBR) is basically used to estimate the strength of highway sub-grade and sub-base materials (Simon et al., Citation1973; Adeyemi & Oyeyemi, Citation2000). CBR has been correlated with pavement performance and has been used to generate design curves for pavement thickness (Wignall et al., Citation1999). The result of the California bearing ratio test ranges from 15% to 31% (mean & standard deviation values of 23% ± 5.51) for granite gneiss derived soil while the CBR values range from 18% to 32% (mean & standard deviation values of 24.8% ± 5.85) for grey gneiss derived soil (Tables ). The Federal Ministry of Works and Housing (FMWH; Citation1997) recommends California bearing ratio values of 5%, 30% and 80% for sub-grade, sub-base and base materials respectively. Only SP6 of the soil samples from granite gneiss met the criteria for sub-base material; the other five samples fall into the category of sub-grade material. Also, SP7 and SP9 of grey gneiss met the criteria for sub-base material while others are good as sub-grade material. Comparing values obtained from the two parent rock types derived soils; the soil from grey gneiss performed better judging by the mean value and standard deviation.
Compaction increases the shear strength of the soil and reduces its compressibility and permeability (Apparao & Rao, Citation1995; Murthy, Citation2002; Prakash & Jain, Citation2002). The maximum dry density (MDD) of granite gneiss derived soil ranges from 1865 Kg/m3 to 1976 Kg/m3 (mean & standard deviation values of 1916 Kg/m3 ± 40.51) while the optimum moisture content (OMC) ranges from 12.1% to 15.6% (mean & standard deviation values of 13.7% ± 1.32). On the other hand, the MDD values of grey gneiss derived soil range from 1783 Kg/m3 to 2027 Kg/m3 (mean & standard deviation values of 1970 Kg/m3 ± 96.22)with the OMC values ranging from 10.7% to 16.6% (mean & standard deviation values of 12.5% ± 2.11; Tables ). All the soil samples from both granite gneiss and grey gneiss soil samples fall within the range of fair (1762.2 Kg/m3 to 1922.4 Kg/m3) to good (1922.4 Kg/m3 to 2082.6 Kg/m3) soil materials when compared with Woods (Citation1937) proposition. In a similar comparison with O’Flaherty (Citation1988) proposition; the ranges of values fall into sandy clay classification of MDD values between 1750 kg/m3 and 2165 kg/m3 and optimum moisture content of between 8% and 15%. Comparing the values of the soil samples derived from the two rock types, grey gneiss derived soil has better ratings than the granite gneiss derived soil.
4.3. Statistical analysis
The geotechnical parameters of the soil samples obtained from the two rock types (granite gneiss and grey gneiss) were pairwise and correlated separately using the Pearson’s correlation coefficient (r). No parameter was pairwise against itself (because it will produce 1) and derived parameters were not considered in this study. The correlation of maximum dry density and percentage of sand gave the same value (of +0.13 and −0.13) but in different directions for the two rock types derived soils. Twelve parameters of the soil samples were correlated against each other and sixty-six pairwise values of correlation coefficient were recorded for each rock type. The obtained values range from −1 to +1. The statistical values were divided into four groups namely; strong positive correlation (>0.5), weak positive correlation (<0.5), weak negative correlation (<-0.5) and strong negative correlation (>-0.5). For granite gneiss derived soil; 13 (19.7%) correlation values fall within the strong positive correlation, 21 (31.8%) Pearson’s (r) values fall within the weak positive correlation, 17 (25.8%) Pearson’s (r) values fall in the weak negative section and 15 (22.7%) Pearson’s (r) values fall within the strong negative correlation (figure 12). For grey gneiss derived soil; 11 (16.7%) correlation values fall within the strong positive correlation, 26 (39.4%) Pearson’s (r) values fall within the weak positive correlation, 15 (22.7%) Pearson’s (r) values fall in the weak negative section and 14 (21.2%) Pearson’s (r) values fall within the strong negative correlation (Table and Figure ). Comparing the statistical values of the soil samples derived from the two rock types, soil derived from grey gneiss has more positive pairwise Pearson’s (r) correlation (37) than the soil derived from granite gneiss (34). Again, granite gneiss derived soil has better ratings in thirty-three (33) out of sixty-six (66) pairwise Pearson’s (r) correlation values to thirty-two (32) of grey gneiss derived soil. The remaining one pairwise correlation coefficient (r) value is the same for the soils derived from the two rock types.
Figure 6. Graph showing strong positive and strong negative pairwise of geotechnical data for soils derived from the two rock types.
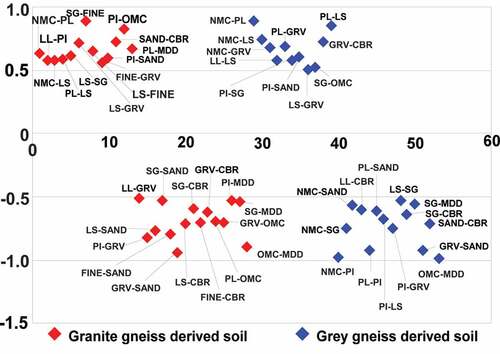
Table 3. Pairwise comparison between the coefficients of the linear correlation of geotechnical properties of soils derived from the two rock types
There exist five strong positive and five negative pairwise Pearson’s correlation coefficients (r) of the same variables common to both rock types derived soils. These variables include five positive correlations of NMC-PL; NMC-LS; PL-LS; LS-GRV & PI-SAND and five negative correlations of PI-GRV; GRV-SAND; SG-CBR; SG-MDD & OMC-MDD (Tables and Figure ). The relationship in terms of correlations for these two variables common to the two rock types derived soils should be considered for other rock types when carrying out analysis.
Figure 7. Graph showing 5 strong positive and 5 strong negative pairwise of geotechnical data common to both rock types.
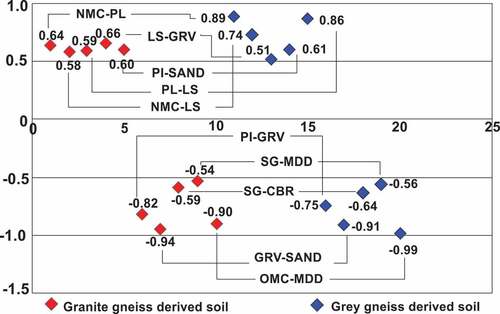
Table 4. Pairwise Pearson’s correlation coefficient of geotechnical parameters for grey gneiss derived soil
Table 5. Pairwise Pearson’s correlation coefficient of geotechnical parameters for granite gneiss derived soil
The Pearson’s correlation coefficient (r) values that are within the critical (r) value of 0.195 are negligible and should not be considered for production or any possible match up in the near future. With the help of mathematical formulas a good statistical relationship can be established for Pearson’s correlation coefficient values outside the critical r value.
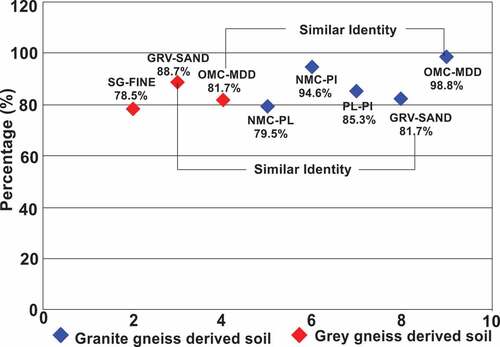
Statistical analysis of coefficient of determination (r2) between geo-technical properties of soils (derived from the two rock types) is employed to show the level of dependence of a variable (y) on another variable (x). The closer the value of the coefficient of determination (r2) is to 1 (for this analysis, it is 100%), the better the prediction. The coefficient of determination (r2) values were divided into four groups namely; Excellent (≥75%), good (<75% to 50%), fair (<50% to 25%) and poor (<25%). For grey gneiss derived soil; the coefficient of determination produced 5 excellent ratings, 6 good ratings, 14 fair ratings and 41 poor ratings while the granite gneiss derived soil produced 3 excellent ratings, 6 good ratings, 19 fair ratings and 38 poor ratings (Tables ). Grey gneiss derived soil has more excellent and good ratings than the granite gneiss derived soil. There is high similarity index in the coefficient of determination (r2) of the two variables relationship (GRV-SAND (82.7% and 88.7%) and OMC-MDD (98.8% and 81.7%)) that are common to the soils derived from the two rock types (grey gneiss derived soil and granite gneiss derived soil) ().
Table 6. Pairwise regression analyses of geotechnical parameters for grey gneiss derived soil
Table 7. Pairwise regression analyses of geotechnical parameters for granite gneiss derived soil
Figure 8. Graph showing pairwise with excellent level (>75%) of dependence of one variable on another variable. GRV-SAND & OMC-MDD are the only two pairwise that are common to soils derived from both rock types.
4.4. Landscape design
Having met the required Nigeria specification of a good soil material and knowing that the subsoil material will not be affected by seasonal changes; soft landscape elements such as trees, shrubs and other ground-covers should be incorporated into Erusu Akoko environment for proper subsoil conservation. The use of landscape on the soil will add to the asthetical value of the area and help to protect the natural environment (soil inclusive). Improving the air quality is one of the ways through which landscape helps to protect the environment by removing pollutant from both the soil and the atmosphere. It also helps to reduce soil erosion, conserve energy through shading and serve as a wind breaker. However, there should be proper selection of soft landscape elements.
5. Conclusion
The index and strength properties of twelve soil samples underlain by two different rock types (granite gneiss and grey gneiss) obtained from Erusu Akoko were examined. The statistics were done separately for the two rock types soils using values of the analysed parameters.
The atterberg limit, grain size analysis, CBR and compaction tests of both soils met the Nigeria specifications of good subgrade material.
Soil derived from granite gneiss has better ratings in natural moisture content and atterberg limit test while soil derived from grey gneiss has better ratings in linear shrinkage, grain size analysis, specific gravity, compaction and California bearing ratio tests.
According to AASHTO classification of the soils; all the soil samples have excellent to good ratings of A-1-a to A-2-7 with half of the soil from granite gneiss rock type having excellence.
Soil derived from grey gneiss has more Pearson’s (r) positive correlation (37) than the soil derived from granite gneiss (34). Again, granite gneiss derived soil has better ratings in thirty-three (33) out of sixty-six (66) pairwise Pearson’s (r) correlation values to thirty-two (32) of grey gneiss derived soil. The remaining one pairwise correlation coefficient (r) value is the same for the soils derived from the two rock types.
There exist five strong positive and five strong negative pairwise variables common to the two rock type’s derived soils. The pairwise Pearson’s correlation coefficient (r) values that are within the critical (r) value are negligible. For regression correlation, granite gneiss derived soil has more excellent and good pairwise ratings than the grey gneiss derived soil.
Recommendations
Engineers should drain water to a safe location for open-graded asphalt.
The quality of materials used for pavement design must be approved before use.
Abbreviations
Availability of data and material
All the analyses were carried out in accordance with the code of investigation and practice.
Code availability (software application or custom code)
Surfer and Excel were used
Disclosure statement
No potential conflict of interest was reported by the author(s).
Additional information
Funding
References
- AASHTO. (1993). Standard specification for transportation materials and methods of sampling and testing 14th ed. American Association of State Highway and Transportation Officials.
- Adebisi, N. O., Ariyo, S. O., & Sotikare, P. B. (2016). Electrical resistivity and geotechnical assessment of subgrade soils in southwestern part of Nigeria. Journal of African Earth Sciences, 119, 256–18. https://doi.org/10.1016/j.jafrearsci.2016.03.019
- Adelusi, A. O., Akinlalu, A. A., & Nwachukwu, A. I. (2013). Integrated geophysical investigation for post construction studies of buildings around School of Science area, Federal University of Technology, Akure, Southwestern, Nigeria. International Journal of Physical Sciences, 8(15), 657–669. https://doi.org/10.5897/IJPS2012.0204
- Ademila, O., & Adebanjo, O. J. (2017). Geotechnical and mineralogical characterization of clay deposits in parts of Southwestern Nigeria. Geosciences Research, 2(2), 127–137. https://dx.doi.org/10.22606/gr.2017.22006
- Ademila, O., Olayinka, A. I., & Oladunjoye, M. A. (2020). Land satellite imagery and integrated geophysical investigations of highway pavement instability in southwestern Nigeria. 46(2), 135–157. https://doi.org/10.7494/geol.2020.46.2.135
- Ademilua, O. (2018). Geotechnical characterization of subgrade soils in Southwestern Part of Nigeria. In: Proceedings of first and second international conferences of the Nigerian Association of Engineering Geology and the Environment, Lagos, Nigeria, vol 1, pp 42–48
- Adeyemi, G. O., & Oyeyemi, F. (2000). Geotechnical basis for failure of section of the lagos- Ibadan express road Southwestern, Nigeria. Bulletin of the Engineering Geology and Environment, 59(1), 39–45. https://doi.org/10.1007/s100649900016
- Adiat, K. A. N., Adelusi, A. O., & Ayuk, M. A. (2009). Relevance of geophysics in road failures investigation in a typical basement complex of South Western Nigeria. Pacific Journal of Science and Technology, 5(1), 528–539.
- Agbede, A. O., Jatau, N. D., Oluokun, G. O., & Akinniyi, B. D. (2015). Geotechnical investigation into the causes of cracks in building: A case study of Dr. Egbogha building, University of Ibadan, Nigeria. International Journal of Engineering Science Invention, 4(2), 18–22.
- Aginam, C. H., Nwakaire, C., & Nwajuaku, A. I. (2015). Engineering properties of lateritic soils from Anambra Central Zone, Nigeria. International Journal of Soft Computing and Engineering (IJSCE), 4(6), 1–6.
- Akinseye, S. T. (2010). Climate variability and effects of weather elements on cocoa and cashew crops in Nigeria, M.Tech Thesis, Unpublished.
- Akintorinwa, O. J., & Adelusi, A. O. (2009). Integration of geophysical and geotechnical investigation for a proposed lecture room complex at the federal university of technology Akure, Southwestern Nigeria. Ozean Journal of Applied Sciences, 2(3), 1943–2429.
- Akintorinwa, O. J., & Oluwole, S. T. (2018). Correlation of geotechnical parameters with geological formations in a basement complex and its implications on civil structure foundation. International Journal of Physical Sciences, 13(9), 147–162. https://doi.org/10.5897/IJPS2017.4681
- Akpan, O. (2005). Relationship between road pavement failures, engineering indices and underlying geology in a tropical environment. Global Journal of Environmental Science and Management, 3(2), 99–108.
- Ale, T. O. (2021). Engineering properties of sub-soils along Akungba-Ikare road, Southwestern Nigeria: Appraising the effect on road construction. Journal of Mining and Geology, 57(2), 513–520.
- Ale, T. O. (2022). Effect of Drying Temperature on the Engineering Properties of Stabilised and Natural Soils For Road Construction. Engineering Heritage Journal, 6(1), 19–26. http://doi.org/10.26480/gwk.01.2022.19.26
- Ale, T. O., Ogunribido, T. H. T., Olatunji, Y. I., Faseki, O. E., Olomo, K. O., Ajidahun, J., Olofinyo, O. O., Johnson, T. D., & Asubiojo, T. M. (2022). Engineering properties of soil samples from stable and failed sections: An example of Akure-Idanre road, Southwestern Nigeria. Journal of Mining and Geology, 58(1), 123–128.
- Alo, B. A., & Oni, O. A. (2018). Geotechnical investigation into the failure of typical road in southwestern Nigeria. American Journal of Engineering Research, 7(10), 51–56.
- Amadi, A. N., Akande, W. G., Okunlola, I. A., Jimoh, M. O., & Francis, D. G. (2015). Assessment of the geotechnical properties of lateritic soils in Minna, North Central Nigeria for Road design and Construction. American Journal of Mining and Metallurgy, 3(1), 15–20.
- Amadi, A. N., Eze, C. J., Igwe, C. O., Okunlola, I. A., & Okoye, N. O. (2012). Architect’s and Geologist’s view on the causes of building failures in Nigeria. Modern Applied Science, 6(6), 31–38.
- Apparao, K. V. S., & Rao, V. C. S. (1995). Soil testing laboratory manual and question bank. Universal Science Press.
- Bell, F. G. (2007). Engineering geology (2nd) ed. Butterworth-Heinemann Publishers.
- Bowles, J. E. (1992). Engineering Properties of soils and their measurements (4th International) ed. McGraw Hill Incorporated.
- Brink, A. B. A., Patridge, J. E., & Williams, A. A. B. (1982). Soil Survey for Engineering. Claredon.
- British Standard, B. S. (1990). Methods of testing soils for civil engineering purposes.
- Casagrande, A. (1947). Classification and identification of soils. American Society of Engineers.
- Dafalla, M. A. (2013). Effects of clay and moisture content on direct shear tests for clay-sand mixtures. Advances in Materials Science and Engineering, 2013, 1–8. https://doi.org/10.1155/2013/562726
- Eissa, R. (2021). Electrical Resistivity Tomography Application for Buried Foundation Investigations: Insights and Review. Iraqi Geological Journal, 54(2E), 122–133. https://doi.org/10.46717/igj.54.2E.8Ms-2021-11-24
- Falowo, O. O., Olaoluwa, G. E., & Farayibi, O. O. (2019). Geo-environmental engineering site evaluation for shallow foundation design in Akoko area of Ondo State, Southwestern Nigeria. Global Journal of Earth and Environmental Science, 4. 26366002. https://doi.org/10.31248/GJEES2019.046.
- Federal Ministry of Works and Housing (FMWH). (1997). General specification for roads and bridges, vol II. Federal Highway Department Lagos.
- Federal Ministry of Works and Housing (FMWH). (2010). General Specification of Roads and Bridges, 2, 137–275.
- Gidigasu, M. D. (1974). The degree of weathering in the identification of laterite materials for engineering purposes. Engineering Geology, 8(3), 213–266. https://doi.org/10.1016/0013-7952(74)90001-5
- Maignien, R. (1966). Review of research on laterites. UNESCO Natural Resources Research IV.
- Momoh, L. O., Akintorinwa, O., & Olorunfemi, M. O. (2008). Geophysical investigation of highway failure- A case study from the Basement complex Terrain of Southwestern Nigeria. Journal of Applied Sciences Research, 4(6), 637–648.
- Murthy, V. N. S. (2002). Principles of soil mechanics and foundation engineering. UBS Publishers’ Distributors Ltd.
- O’Flaherty, C. A. (1988). Highway Engineering (Vol. 2). Edward Amold Publishers.
- Ogunribido, T. H. T., Mohammed, M. Z., & Adesuyi, A. R. (2015). Effect of engineering properties of soil on pavement failures in Ogbagi - Akoko Area, Southwestern, Nigeria. Journal of Environment and Earth Science, 5(4), 39–42.
- Olabode, O. F. (2019). Potential groundwater recharge sites mapping in a typical basement terrain: A GIS methodology approach. Journal of Geovisualization and Spatial Analysis, 3(1), 5. https://doi.org/10.1007/s41651-019-0028-z
- Olofinyo, O. O., Olabode, O. F., & Fatoyinbo, I. O. (2019). Engineering properties of residual soils in part of Southwestern Nigeria: Implication for road foundation. SN Applied Sciences, 1(5), 507. https://doi.org/10.1007/s42452-019-0515-32
- Ologun, S., Okon, J. E., Monde, M. J., & Aboluwarin, O. M. (2019). Investigation of geotechnical properties of lateritic soil from Iwo road located in Ibadan, Oyo State, Southwestern Nigeria. International Journal of Scientific & Engineering Research, 10 (4), 2229–5518. IJSER © 2019http://www.ijser.org
- Oluwakuse, O. A., Oluwakuse, M. M., & Adeyemo, I. A. (2020). Engineering geological investigation of pavement failure along Emure Ekiti-Akungba Akoko Road, Southwestern Nigeria. Asian Journal of Geological Research, 3(2), 34–41.
- Oyelami, A. C., & Alimi, S. A. (2015). Geotechnical investigation of some failed sections along Osogbo-Awo Road, Osun-State, Southwestern Nigeria. Ife Journal of Science, 17(1), 87–95.
- Prakash, S., & Jain, P. K. (2002). Engineering Soil Testing. Nem Chand & Bros, Roorkee.
- Rahaman, M. A. (1988). Recent advances in the Study of the Basement Complex of Nigeria. In Precambrian Geology of Nigeria, Geological Survey of Nigeria (pp. 11–43).
- Roy, S., & Kumar-Bhalla, S. (2017). Role of geotechnical properties of soul on civil engineering structures. Resources and Environment, 7(4), 103–109.
- Simon, A. B., Giesecke, J., & Bidlo, G. (1973). Use of lateritic soils for road construction in North Dahomey. Engineering Geology, Amsterdam, 19, 1–13.
- Skempton, A. W. (1953). The colloidal “activity” of clays. In: Proceedings of 3rd international conference of soil mechanics, Zurich, Pp. 57–61
- Underwood, L. B. (1967). Classification and identification of shales. Journal of the Soil Mechanics and Foundations Division, 93(6), 97–116. https://doi.org/10.1061/JSFEAQ.0001078
- Wignall, A., Kendrick, P. S., Ancil, R., & Capson, M. (1999). Roadwork; theory and practice (4th) ed., Butterworth-Heinemann.
- Woods, K. B. (1937). Compaction of Embankments, 18 (2), 142–181. Proceedings of Highways Resources, Washington