
 ?Mathematical formulae have been encoded as MathML and are displayed in this HTML version using MathJax in order to improve their display. Uncheck the box to turn MathJax off. This feature requires Javascript. Click on a formula to zoom.
Abstract
Cuprous oxide (Cu2O) is a p-type metal oxide semiconducting material with potential in photovoltaic and photocatalysis applications due to its excellent absorption capacity in visible region and tunable energy gap. Experimental synthesis and energy gap characterization of thin film cuprous oxide semiconductor with desired dopants and varying experimental conditions for enhanced photocatalytic as well as photovoltaic activities are laborious and consume appreciable precious resources. This work hybridizes particle swarm optimization method with support vector regression algorithm for computing energy gap of thin film cuprous oxide semiconductor using the thickness of thin film and distorted lattice parameter as descriptors. The predictions of swarm-based support vector regression (S-SVR) model are compared with estimates of stepwise regression (SR) model while S-SVR shows superior performance of 39.47 %, 36.20 % and 114.41 % on testing data samples over SR model using root mean square error (RMSE), mean absolute error (MAE) and correlation coefficient (CC), respectively. The developed S-SVR model is characterized with 0.9559 CC, 0.0586 MAE and 0.028 RMSE on the basis of training samples. The developed S-SVR and SR models were further validated using external data samples while the developed S-SVR demonstrates excellent agreement with the measured values. The convincing precision demonstrated by S-SVR model would be of indispensable significance in determining energy gap of cuprous oxide semiconductor (for photocatalytic applications in pollutant removal, solar cell, gas sensors and thin film transistors) with appreciable quickness and reduced cost coupled with experimental difficulty circumvention.
1. Introduction
Cuprous oxide (Cu2O) is a semiconducting oxide of copper with fascinating applications in thin film transistors, solar cells, catalysis, gas sensors and dilute magnetic semiconductors among others (Abbas & Abass, Citation2022; L. Zhang et al., Citation2013). Ability to maintain chemical and mechanical stability for long term further strengthens the potential of cuprous oxide semiconductor in constructing long-lasting and durable solar cell using the semiconductor as light-absorbing component
(Moharam et al., Citation2016). Solar energy is categorized as the main energy source that can potentially fulfill future energy needs (Alp, Citation2021; Mallik et al., Citation2020). Cuprous oxide semiconductor has been identified as efficient material for fabrication of efficient and low cost solar cells that can meet up the global energy demand (Raza et al., Citation2021). This semiconductor is characterized with numerous features such as non-toxicity, abundance, excellent optical absorption coefficient within visible range, good electrical properties, mechanical stability and low energy gap (2.17 eV) which strengthen their applications in wide range of domains (Ozaslan et al., Citation2018; Srinivasan et al., Citation2021). Photocatalytic activity of copper (I) oxide (cuprous oxide) semiconductor attracted attention lately due to its tunable energy gap and intrinsic characteristic of slow rate of electron-hole recombination (Tian et al., Citation2019; Xu et al., Citation2014). Its ability to adsorb molecular oxygen effectively reduces recombination rate and translates to enhanced photocatalytic activity (Srinivasan et al., Citation2021). In an effort to enhance photocatalytic activity of Cu2O based semiconductor, double-shell mesoporous plasmonic Cu@Cu2O/SiO2 has been reported to demonstrate enhanced photocatalytic activity with rapid separation of electron-hole pairs (Hadis Derikvandi et al., Citation2020). Coupling between Cu2O and CdS nanoparticles was also found to boost photocatalytic activity of Cu2O semiconductor (Omrani & Nezamzadeh-ejhieh, Citation2020a) while further inclusion of additional materials such as WO3 crystals and monoclinic BiVO4 with Cu2O and CdS nanoparticles has been regarded as novel means of photocatalytic enhancement (Omrani & Nezamzadeh-ejhieh, Citation2020b) . Aside from quadripartite, other nano-composites with improved photocatalytic activity include ternary Cu2O-BiVO4-WO3 (Omrani & Nezamzadeh-ejhieh, Citation2020c), hetero-structure α-Fe2O3/Cu2O (Norouzi & Nezamzadeh-ejhieh, Citation2020) and ternary Cu2O/BiVO4/WO3 nano-composite (Omrani & Nezamzadeh-ejhieh, Citation2020d). In order to effectively adapt cuprous oxide semiconductors for specific photocatalysis application, thin film energy gap needs to be tailored and adjusted which requires laborious experimental synthetic conditions that ultimately alter the thickness of the thin film with accompanied crystal lattice distortion (Ozaslan et al., Citation2018). The swarm-based intelligent model presented in this work employs the thickness of the film and the lattice parameter for energy gap computation.
Cuprous oxide is characterized with simple crystal cubic crystallographic structure with p-type conductivity and direct energy gap of 2.17 eV (Hssi et al., Citation2020). It has a cubic structure with super-imposition of two sub-lattices which include copper cations (face centered cubic sub-lattice) and oxygen anions (body centered cubic sub-lattice). The copper atom is co-ordinated linearly by two neighboring oxygen atoms while the tetrahedral interstitial positions are occupied by the oxygen atoms in relation to with the copper sub-lattice (Moharam et al., Citation2016). Although, direct explanation of the nature of it p-type conductivity still remains unclear while oxygen interstitials has been attributed to the observed conduction in the semiconductor (L. Zhang et al., Citation2013). The two most common experimental methods of determining energy gap of semiconductors include measurement of photoluminescence spectra and measurement of spectra dependence of the absorption coefficient (Jafari et al., Citation2020). However, accurate energy gap determination requires advanced approach with utilization of x-ray photoelectron spectroscopy to measure the top of the valence band while the bottom of the conduction band is determined using inverse photoelectron spectroscopy (Chen et al., Citation2016). This advanced approach requires expensive, specialized and sophisticated equipment. Hybridization of particle swarm optimization algorithm and support vector regression is presented in this contribution for effective and precise characterization of cuprous oxide energy gap with appreciable quickness and reduced cost coupled with experimental difficulty circumvention.
Support vector regression (SVR) intelligent algorithm is one of the data-fitting algorithms with excellent capacity to establish linear fitting function from raw data samples using structural risk principle of minimization (Fan et al., Citation2021; Vapnik, Citation1995; Z. Zhang et al., Citation2020). Its future generalization property is strengthened through regularization and attribution of penalties to data-points outside the defined accuracy zone. In case of non-linear problems, SVR maps the raw data samples from low dimension to hyper-space of higher dimension using kernel function (Xue et al., Citation2020). Kernel function implementation for data transformation involves dot product computation on raw data sample which eventually leads to reduced computational speed (Z. Zhang et al., Citation2020). The robustness of SVR-based algorithm is due to the intrinsic quality of the algorithm to utilize hundreds of vector coefficients and support vectors as opposed to conventional fitting methods that employ several fitting coefficients (Gu et al., Citation2017). These interesting features of SVR algorithm coupled with it efficiency and efficacy in handling small data samples have significantly widened application zones of the algorithm in different research and industrial domains (Akomolafe et al., Citation2021; Henrique et al., Citation2018; Olatunji et al., Citation2021; Owolabi & Abd Rahman, Citation2021; Owolabi, Saleh, et al., Citation2021). These features necessitated its choice for determining energy gap of cuprous oxide semiconductor in this research work. The prediction capacity of SVR algorithm is greatly influenced by its user defined parameters known as hyper-parameters such as the epsilon, kernel parameter and penalty factor (Akande et al., Citation2017). Epsilon defines the error tolerance and can be controlled by the introduced slack variables. The kernel parameter controls data transformation to hyper-space while a trade-off between the complexity of the model and maintenance of error threshold is controlled through the penalty factor. These model parameters are carefully and optimally selected using swarm based optimization algorithm.
This research work addresses the challenges of cuprous oxide energy gap determination through development of hybrid swarm-based support vector regression (S-SVR) algorithm and stepwise regression (SR) based model using the thickness of thin film and distorted lattice parameter as descriptors. The developed S-SVR model outperforms SR model during training phase with performance improvement of 58.31 %, 67.54 % and 81.36 % on the basis of correlation coefficient (CC), mean absolute error (MAE) and root mean square error (RMSE), respectively. During the testing phase, the developed S-SVR model outperforms SR model with performance improvement of 114.41 %, 36.20 %, and 39.47 % on the basis of CC, MAE and RMSE, respectively. The developed S-SVR and SR models were further validated with another set of data which was excluded during the training and testing phase while the estimates of the developed models agree well with the measured values.
The rest of the manuscript is arranged and organized as follows: section two describes the principles governing support vector regression and particle swarm optimization algorithm with inclusion of mathematical details and equation of particle motion. Data sample information regarding the acquisition, statistical analysis and computational strategies is presented and detailed in section three. Section four of the manuscript discusses the results of each of the developed model with their comparison. Outputs of external validation and implementation of the developed model for investigating the influence of deposition time, deposition copper salt and neodymium dopants inclusion on energy gap is presented in section four. The last section concludes the manuscript.
2. Background of the implemented hybrid model
The mathematical basis of support vector regression and particle swarm optimization algorithm are presented in this part of the manuscript. Equations governing the navigation of particles for global solution search are also included in this section.
2.1. Support vector regression mathematical details
Consider a set of data samples
of thin film cuprous oxide semiconductor in m-dimensional space in which the distorted lattice parameter and film thickness are encoded in
as descriptors while
is the measured optical band gap of
sample of the set. Through kernel trick,
maps the data samples to feature space
of characteristic high dimension. Support vector regression algorithm assumes the existence of linear function
in infinite dimensional space which relates the descriptors (lattice parameter and film thickness) with optical energy gap. The approximated linear function obtainable with support vector regression algorithm is expressed in Equationequation (1)
(1)
(1) (Akinpelu et al., Citation2020; Owolabi, Citation2019).
Where and
are the parameters to be adjusted through optimization principle embedded in the algorithm. The approximated function obtainable using SVR algorithm through which optical energy gap of cuprous oxide semiconductor is determined and represented as
. The empirical risk presented in Equationequation (2)
(2)
(2) is minimized as contained in the expression.
The insensitive loss function
included in Equationequation (2)
(2)
(2) is mathematically contained in equation (3).
The loss function finds appropriate and suitable hyper-plane which ensures that the deviation between the measured and optical energy gap of cuprous oxide thin film semiconductor does not exceed the error threshold. The distance existing between the edge values of tube training data samples is controlled through slack variables (
,
) in case the strength to maintain the maximum allowable error of epsilon
is compromised. Therefore, the transformed quadratic optimization is minimized as expressed in Equationequation (4)
(4)
(4) with the constraints shown in Equationequation (5)
(5)
(5) (Owolabi & Gondal, Citation2015).
Where expresses the distance between two training subset data,
is the penalty factor which maintains the trade-off between flatness of SVR-based approximated function and the two training subset data samples, epsilon
is the width or dimension of insensitive zone. The outcome of the solution of quadratic optimization problem using Lagrange multipliers (
and
) is expressed in equation (6).
The support vectors which basically represent the models are coined from the data samples with non-zero and positive values of and
. The final SVR based approximated function for optical energy gap estimation is presented in equation (7).
Where represents the kernel function that translates the vector
to feature space
. During this mapping, the difficulty in computation of inner product of
and
kernel function sets in. The conventional approach is to compute the value of kernel function which results into inner product (Z. Zhang et al., Citation2020). Therefore, satisfaction of Mercer’s condition is employed for the selection of kernel function. The Gaussian radial basis function that optimally fitted the copper (i) oxide data samples is expressed in equation (8).
Where is the kernel parameter that demands optimization together with other model parameters such as the epsilon
and the penalty factor
. Appropriate choice of the values of these parameters leads to global solution convergence. Particle swarm optimization algorithm is implemented in this work for appropriate combination of these parameters due to fast convergence of the algorithm coupled with its simplicity.
2.2. Particle swarm method of optimization
Particle swarm optimization (PSO) algorithm is swarm intelligence-based global heuristic optimization method (Kennedy & Eberhart, Citation1995). The unique features of this algorithm which include high robustness, simplicity and low risk of local minimum convergence contribute immensely to its wider application coverage (Aboelkassem & Savic, Citation2021; Beheshti, Citation2020; Pramanik et al., Citation2022). The algorithm adopts information sharing concept among the individual particles while it embarks on stochastic search within particle population space (Qu et al., Citation2020). The general properties of particles within swarm description include the velocity and position. The navigating trajectory of the particle towards global solution is controlled and influenced by the individual best position attained previously and the entire population best position (Li et al., Citation2020; Murillo-escobar et al., Citation2019). Stochastic distribution of particle swarms (which represent the probable solutions) commences the particle swarm optimization technique followed by evaluation of objective function (which is the root mean square error for testing data samples) and subsequent velocity as well as position update. EquationEquation (9)(9)
(9) presents an expression for updating the position and velocity of swarm particles (Song et al., Citation2020).
Where =iteration,
=individual position,
=particle velocity,
,
and
are the exploration coefficients which control the inertial weight and particle accelerations, respectively.
and
are random numbers with a range of values between 0 and 1. The position of particle at which the best objective function is attained is represented as
while
represents the best position of neighborhood particles in accordance to the defined objective function. The objective function evaluation, position and velocity updating are conducted iteratively until termination conditions of the algorithm are satisfied. The position corresponding to objective function optimal results is termed global or best solution of the optimization task. The algorithm stops it iterative procedures if the value of the objective function remains constant for fifty consecutive iterations or the maximum number of iteration is satisfied.
3. Computational method involved in model development
Description and statistical analysis of data sample are presented in this section. The computational method employed for hybridizing particle swarm optimization algorithm with support vector regression algorithm is presented.
3.1. Analysis and description of data samples
The developed S-SVR model which can effectively determine the energy gap of doped as well as experimentally treated thin film cuprous oxide semiconductor was modeled using thirty-three samples of cuprous oxide materials extracted from literature (Altindemir & Gumus, Citation2020; Messaoudi et al., Citation2016; Moharam et al., Citation2016; Ozaslan et al., Citation2018; Ravichandiran, Sakthivelu, Davidprabu, Arun, et al., Citation2019; Xu et al., Citation2014; L. Zhang et al., Citation2013). The thickness of the thin film as well as the lattice parameter which serves as the descriptors were equally extracted from the same sources with their corresponding measured energy gaps. The thickness of thin film significantly alters the optical energy gap of cuprous oxide semiconductor (Majumder et al., Citation2015). Photocatalytic activity of thin film cuprous oxide semiconductor with thicker film thickness can be immensely impeded due to high chance of recombination of photo-generated charges in thicker films (Wu et al., Citation2021). Furthermore, film thickness influences light absorption capacity of the cuprous oxide semiconductor while the absorption peak can be shifted from visible to the near-infrared region (Liu et al., Citation2021). The transmittance of cuprous oxide samples can be influenced through variation in film thickness, grain size, shape and area (Sanjana et al., Citation2022). The lattice structural parameter of the sample captures other influential factors altering the sample energy gap. Lower defect concentration has been attributed to thin film cuprous oxide semiconductor with thicker film size which ultimately influences the sample optical energy gap (Reyes-vallejo et al., Citation2022). The data samples employed for optical energy gap modeling for cuprous oxide semiconductor have been statistically analyzed and presented in Table .
Table 1. Data sample analysis using statistical parameters
Among the optimal goals of the statistical analysis is to infer the possibility of employing linear modeling technique for energy gap prediction. The mean values of each of the descriptors and energy gap encode the information regarding the overall data sample content while data sample range can be inferred from the presented minimum and maximum values. Standard deviation measures the discrepancies as well as consistencies in data samples from measurement to measurement. Figure shows three-dimensional presentation of film thickness, lattice parameter and energy gap. The inter-relationship between the parameters can be inferred from the figure. The coefficients of correlation measure the extent and degree the relationship (linear relation only) between film thickness, energy gap and lattice constant.
Figure 1. Three dimensional correlation cross-plot between descriptions and energy gap for cuprous oxide semiconductor.
Both film thickness and lattice parameter are positively correlated with the measured optical energy gap while the degree of correlation for both descriptors is low. Hence, linear modeling tools will fail to capture the existing relationship between film thickness, lattice parameter and energy gap. Stepwise regression (SR) based model is developed for establishing this fact. Although, SR model is easy to implement as compared with S-SVR model developed while inaccuracy of SR model predictions might hinder its deployment for practical applications. The developed S-SVR model captures the relationship between film thickness, lattice parameter and energy gap excellently due to its implemented convex optimization method and data sample mapping to feature space.
3.2. Computational method of hybrid intelligent model
Optical energy gap of thin film cuprous oxide semiconductor was modeled through hybridization of support vector regression algorithm and particle swarm optimization algorithm for parameter optimal selection using thickness of the thin film and lattice parameter as inputs to the hybrid algorithm. The entire modeling and computation was conducted within MATLAB computing environment. The employed thirty-three data samples were divided into training and testing samples in ratio 4:1 whereby twenty-seven data samples of thin film cuprous oxide semiconductors were employed for pattern acquisition while the acquired patterns and intricacies connecting thin film thickness, lattice parameter and optical energy gap were validated through seven testing set of data samples. Before the beginning of data separation, data randomization was initiated purposely to promote efficient computation by ensuring that the range of data sample through which the training patterns were acquired corresponds with testing samples of data. Procedures for algorithms hybridization are itemized as follows:
Step I: Swarm initialization and definition of algorithm parameters: The space containing the probable solutions as represented by swarm of particles is defined and initiated. The boundaries for upper and lower range for the penalty factor are initiated as 200 and 1, that of epsilon are defined as 0.009 and 0.001 while that of kernel parameter are 30 and 18. The hyper-parameter lambda that controls the choice of hyper-plane was maintained at E-7. Initial assessment of the dependence of number of iteration on convergence shows that the model converges before sixtieth iteration. The maximum number of attainable iteration was set as one hundred (so as to allow convergence to equal value for over forty consecutive iterations) while the number of swarm assessing the search space was varied between twenty to two-hundred. and
parameters controlling the particle acceleration was set at 2 while inertial weight
was set at 0.98. The random numbers employed were guided within MATLAB environment using Mersenne Twister generator which controls the pseudo random number generation.
Step II: Determination of fitness of probable solution: development of SVR-based model (using operational principle of the algorithm through test-set cross-validation method) involves determination of the fitness of each of the particle within the swarm. Root mean square error (RMSE) between the measured optical energy gap of thin film cuprous oxide semiconductor and the estimates of the developed SVR algorithm with the incorporated particle during testing phase of algorithm development controls the particle’s fitness as well as its potential for inclusion for subsequent iteration. Each particle of the swarm represents penalty factor, epsilon and kernel parameter with a known orderliness. The fitness computational procedure is described as follows: (a) from the available functions which include sigmoid, polynomial and Gaussian, choose a function which serves as the kernel for mapping training samples to hyper-space, (b) a particle which encodes the parameter to be optimized combines with the training data samples as well as the selected function in Step (a), (c) the outcomes of Step (b) were employed to train SVR algorithm while RMSE for training data sample (TRDS) was noted with the corresponding support vectors for future implementation, (d) combination of testing data sample (TSDS) with the saved support vectors in Step c validates the trained SVR algorithm using test-set cross validation approach (Owolabi et al., Citation2015) (e) the procedures in Step b to Step d were repeated for other particles within the swarm, (f) the procedures in Step a to Step e were repeated for different kernel functions, (g) the values of RMSE-TSDS were recorded with their corresponding support vectors (h) fitness of each of the particle was determined from the value of RMSE-TSDS with the lowest value corresponds to the most fit particle.
Step III: iteration parameters update: the parameters such as the particle position and velocity which control the iteration of the algorithm are updated in accordance to the expression presented in Equationequation (9)(9)
(9) . Specific equations governing individual and global position update are contained in Equationequation (10)
(10)
(10) and Equationequation (11)
(11)
(11) , respectively.
Step IV: Global best fitness calculation with parameters update: After attainment of global best position, the velocities as well as the position of the particles are updated accordingly.
Step V: Conditions for stopping the iterative processes of the algorithm: The iterative procedures of the algorithm stop when maximum attainable number of iteration are reached; RMSE-TSDS attains zero value or equal value for fifty consecutive iterations. The computational details and flow chart of the methodology are presented in Figure .
Figure 2. Flow chart diagram for S-SVR model developed in this work.
Step VI: Model validation and evaluation: Trained SVR model (with the aid of optimum values of hyper-parameters) was implemented on validation data samples. The performance measuring parameters such as correlation coefficient (CC), root mean square error (RMSE) and mean absolute error (MAE) were computed. The source code for the implementation of S-SVR model is contained in the supplementary material.
4. Results and discussion
The estimated optical energy gaps of thin film cuprous oxide semiconductor using S-SVR and SR models are presented in this section. The convergence of PSO algorithm during parameter optimization is also presented. This section also contains comparison between the developed models using different performance metrics. The results of external validation as well as the investigation of influence of deposition copper salt, deposition time and neodymium dopants on optical energy gap are also presented.
4.1. Convergence of particle swarm optimization algorithm
The convergence of particle swarm optimization algorithm for each of the optimized model’s parameter as well as error convergence is presented in Figure . The error (RMSE) convergence presented in Figure ) shows that the model convergence does not depend on the swarm population size since similar global convergence is attained at different values of swarm particle population size (Owolabi, Saleh, et al., Citation2021).
Figure 3. Particle swarm optimization convergence (a) error convergence at different swarm population size (b) penalty factor convergence at different swarm population size (c) epsilon convergence at different swarm population size (d) Gaussian kernel parameter convergence at different swarm population size.
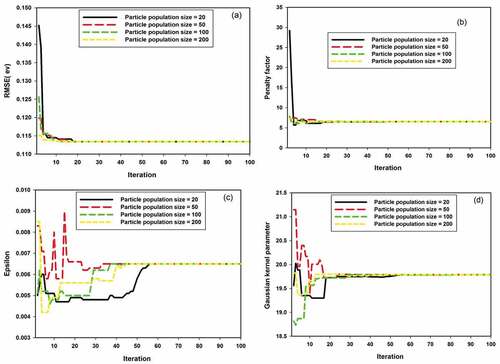
The convergence of regularization or penalty factor for hundred iterations at different values of swarm sizes ranging from twenty to two-hundred is presented in Figure ). Penalty factor controls and maintains a balance between model complexity and setting of model error within the range of epsilon especially when minimizing Euclidean norm. Independence of the convergence of penalty factor on the swarm population size exploring and exploiting the search space further buttresses the robustness of the developed S-SVR intelligent model. The global best and optimum parameters for the optimization algorithm are presented in Table together with their optimum values.
Table 2. Parameters that control the precision of S-SVR model and their optimum values
Epsilon convergence is presented in Figure ). Epsilon measures the dimension of error threshold insensitive zone and controls the training error of the model. Different swarm population sizes show uniform and similar convergence after fifty iterations. Similar convergence pattern is demonstrated by the Gaussian kernel parameter as shown in Figure ). The Gaussian kernel parameter controls hyper-space transformation of data sample from lower dimensional space. After evolutionary selection of SVR parameters as presented in Table , the developed S-SVR model was repeated thirty times on data sample (randomly) to investigate the reliability of the developed model. The results of the repetition are presented in Table for training and testing phase with average values and standard deviations. Small values of deviation after every run confirm the robustness and reliability of the developed model.
Table 3. Random repetition of developed S-SVR model on data-samples at optimum SVR parameters
4.2. Model equation and performance comparison
The governing empirical equation for the developed SR model is presented in Equationequation (12)(12)
(12) where T and a respectively stand for the thickness of the film and lattice parameter.
Although, the presented empirical Equationequation (12)(12)
(12) is easy to implement for calculating optical energy gap of thin film cuprous oxide semiconductor doped with foreign materials or experimentally treated for photocatalytic or photovoltaic activity enhancement. However, the accuracy of the equation is poor as compared with S-SVR based model due to inability of SR model in addressing non-linearity between the film thickness, lattice parameter and optical energy gap. The merits of S-SVR-based model are attributed to its potential in mapping data samples to feature space so as to address non-linearity task. Figure shows the performance comparison during developmental training and testing phases using three performance metrics which include the correlation coefficient (CC), root mean square error (RMSE) and mean absolute error (MAE).
Figure 4. Generalization capacity of S-SVR and SR models (a) correlation coefficient through training data sample (b) mean absolute error through training set of samples (c) root mean square error through training set of samples (d) correlation coefficient through testing data sample (e) mean absolute error through testing set of samples (f) root mean square error through testing set of samples.
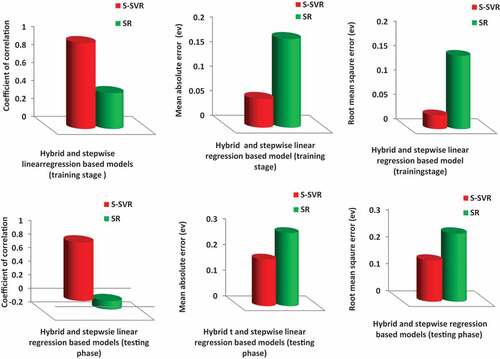
The comparison presented in Figure ) shows that S-SVR model performs better than SR model with percentage superiority of 58.31% while it shows performance improvement of 67.54% and 81.36% on the basis of MAE and RMSE as respectively presented in Figure ). The testing data sample performance is presented in Figure ) using CC, MAE and RMSE basis. The developed S-SVR model outperforms SR model for testing data samples with performance improvement of 114.41 %, 36.20 % and 39.47% using CC, MAE and RMSE performance yardsticks as shown in Figure ) respectively. Table depicts the performance of each of the developed models and superiority of S-SVR over SR model during training and testing stages.
Table 4. Hybrid and stepwise linear regression models with their performances
4.3. Effect of deposition copper salt on optical property of thin film cuprous oxide
The variation in optical energy gap of thin film cuprous oxide semiconductor prepared using different copper salts is presented in . The copper salts employed for thin film deposition include (CH3COO)2Cu⋅H2O (salt A), CuSO4⋅5H2O (salt B), Cu(NO3)2⋅3H2O (salt C) and CuCl2⋅2H2O (salt D) (Altindemir & Gumus, Citation2020).
Figure 5. Influence of copper salt employed for film deposition on energy gap of cuprous oxide semiconductor.
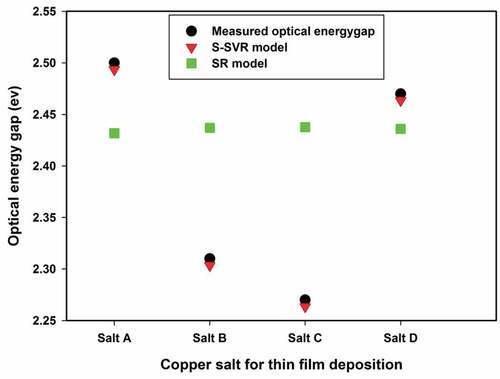
The thickness of the prepared samples also varied from 469 nm to758 nm while the optical energy gap decreases as the film thickness increases. Thickness of the film has been reported to be inversely proportional to the energy gap (Nair et al., Citation1999). The developed S-SVR model captures the measured energy gap (Altindemir & Gumus, Citation2020) excellently while the predictions of SR model are characterized with deviations due to inability of the algorithm to address non-linear prediction.
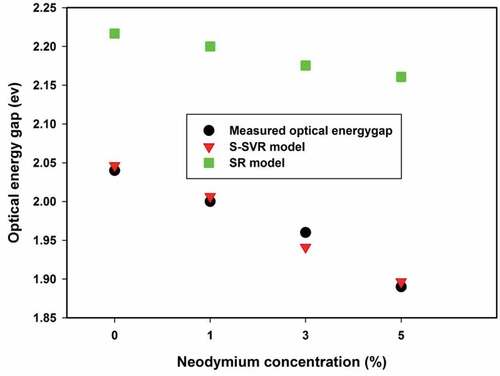
4.4. Doping effect of neodymium on optical energy gap of thin film cuprous oxide semiconductor
The influence of neodymium particles incorporation into lattice structure of thin film cuprous oxide semiconductor is investigated using the developed S-SVR and SR model as presented and compared with the experimental values in . Increase in neodymium concentration shifts the absorption edge towards longer wavelength with increase in film thickness (Ravichandiran, Sakthivelu, Davidprabu, Arun, et al., Citation2019). The lattice parameter decreases as the concentration of neodymium progresses (Ravichandiran, Sakthivelu, Davidprabu, Arun, et al., Citation2019). These facilitate the observed change in optical energy gap of the semiconductor. The estimated optical energy gaps using S-SVR model agree excellently well with the measured values due to the implementation of particle swarm optimization method for parameter global best selection, kernel trick for data mapping and strong mathematical background with inclusion of Langrage multipliers for addressing convex optimization problem.
Figure 6. Effect of neodymium dopant on energy gap of thin film cuprous oxide semiconductor.
4.5. Variation of optical gap of cuprous oxide with deposition time
The influence of deposition time in adjusting and tuning optical energy gap of thin film cuprous oxide semiconductor has been investigated as presented in using developed S-SVR and SR models. The thickness or deposition time of the semiconductor alters optical energy gap due to quantum confinement attributed to the crystallinity improvement as a result of lattice strain, structural disorder and crystallite size enlargement (Messaoudi et al., Citation2016).
Figure 7. Significant of deposition time on energy gap of thin film cuprous oxide semiconductor.
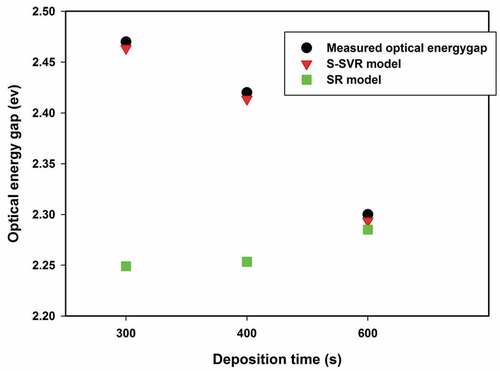
Efficient homogeneity, reduced disorder and defects are potential factors which lower the localized state density within band structure and tailor the optical energy gap of cuprous oxide semiconductor (Messaoudi et al., Citation2016). The results of the developed S-SVR agree excellently with the measured values while the estimates of SR model have characteristic deviations.
4.6. Additional data sample for further validation of the developed models
The prediction and generalization capacity of the developed S-SVR model is further justified and externally validated using separate sources of data samples that were excluded from model training and testing phases. The predictions of each of the developed models as well as the measured optical energy gap are presented in Table .
Table 5. Predicted energy gaps of cuprous oxide semiconductor using external set of data samples
The results of S-SVR model are closer to the measured values as compared with the estimates of SR model. The developed S-SVR model only utilizes the saved support vectors during model training coupled with the thickness as well as lattice parameter of the samples whose optical energy gaps are to be determined. The employed particle swarm optimization method contributes immensely to the improved performance demonstrated by S-SVR model while SR model has associated deviations attributed to its prediction due to the inability of the algorithm to address non-linear problem.
5. Conclusion
Optical energy gap of thin film cuprous oxide semiconductor is modeled through stepwise regression (SR) based algorithm and hybridization of particle swarm optimization algorithm with support vector regression (SVR). The descriptors to swarm-based SVR (S-SVR) model and SR model include the thickness of the film and distorted lattice parameter due to the incorporated dopants or experimental synthetic conditions. The developed S-SVR model outperforms SR model during training phase with performance improvement of 58.31 %, 67.54 % and 81.36 % on the basis of correlation coefficient (CC), mean absolute error (MAE) and root mean square error (RMSE), respectively. The developed S-SVR and SR models investigate the influence of deposition copper salt, neodymium dopants and deposition time on optical energy gap of thin film cuprous oxide semiconductor while the predictions of S-SVR model agree excellently with the measured values. The superiority of S-SVR model over SR model can be attributed to its ability to address non-linear problems through hyper-space mapping coupled with optimal selection of its parameters using particle swarm optimization method. The developed S-SVR and SR models were further validated using external sources of data samples and the predictions of S-SVR model agree excellently well with the measured optical energy gap as revealed from the obtained low value of MAE. Consistency in the closeness of the estimates of S-SVR model with measured optical gap would be highly meritorious in providing quick and precise computational method of characterizing optical energy gap of cuprous oxide semiconductor for desired photocatalytic and photovoltaic applications with circumvention of experimental difficulties and stress. Other intelligent algorithms could be developed for addressing energy gap challenges in future research works.
Data availability statement
The sources of data employed in building the presented models are as cited in section 3.1 of the manuscript.
Disclosure statement
No potential conflict of interest was reported by the author(s).
Additional information
Funding
Notes on contributors

Taoreed O. Owolabi
Taoreed O. Owolabi is a lecturer in the Department of Physics and Electronics, Adekunle Ajasin University, Akungba Akoko, Nigeria. He holds BSc degree in physics and Electronics from Adekunle Ajasin University. He obtained his M.Sc. and PhD degrees in Physics from King Fahd University of Petroleum and Minerals (KFUPM), Saudi Arabia. He is holding a faculty position in the Department of Physics and Electronics, Adekunle Ajasin University, Akungba Akoko, Nigeria. He is serving as a guest editor for a special issue in the Journal of Nanomaterials published by Hindawi. He is presently an editor of Journal of the Nigerian Society of Physical Sciences as well as the Journal of Mathematical Problems in Engineering.
References
- Abbas, A., & Abass, K. H. Materials today : Proceedings Nano-layers of Cu 2 O prepared by thermal evaporation technique : Morphology and optical properties. Mater. Today Proc. 2022.
- Aboelkassem, Y., & Savic, D. (2021). Particle swarm optimizer for arterial blood flow models. Computer Methods and Programs in Biomedicine, 201, 105933. https://doi.org/10.1016/j.cmpb.2021.105933
- Akande, K. O., Owolabi, T. O., Olatunji, S. O., & AbdulRaheem, A. (2017). A hybrid particle swarm optimization and support vector regression model for modelling permeability prediction of hydrocarbon reservoir. journal of Petroleum Science and Engineering, 150(October 2016), 43–18. https://doi.org/10.1016/j.petrol.2016.11.033
- Akinpelu, A. A., Ali, M. E., Owolabi, T. O., Johan, M. R., Saidur, R., Olatunji, S. O., & Chowdbury, Z. (2020). A support vector regression model for the prediction of total polyaromatic hydrocarbons in soil: An artificial intelligent system for mapping environmental pollution. Neural Computing and Applications, 3. https://link.springer.com/article/10.1007/s00521-020-04845-3
- Akomolafe, O., Owolabi, T. O., Rahman, M. A. A., Kechik, M. M. A., Yasin, M. N. M., & Souiyah, M. (2021). Modeling superconducting critical temperature of 122-iron-based pnictide intermetallic superconductor using a hybrid intelligent computational method. Materials (Basel), 14(16), 4604. https://doi.org/10.3390/ma14164604
- Alp, E. (2021). The Facile Synthesis of Cu 2 O-Cu hybrid cubes as ef fi cient visible-light-driven photocatalysts for water remediation processes. Powder Technol, 394, 1111–1120. https://doi.org/10.1016/j.powtec.2021.09.031
- Altindemir, G., & Gumus, C. (2020). Materials science in semiconductor processing Cu 2 O thin films prepared by using four different copper salts at a low temperature : An investigation of their physical properties. materials Science in Semiconductor Processing, 107((November 2019), 104805. https://doi.org/10.1016/j.mssp.2019.104805
- Beheshti, Z. (2020). A time-varying mirrore d S-shape d transfer function for binary particle swarm optimization. Information Sciences, 512, 1503–1542. https://doi.org/10.1016/j.ins.2019.10.029
- Chen, S., Pan, X., Xu, C., Huang, J., & Ye, Z. (2016). X-ray photoelectron spectroscopy study of energy-band alignments of ZnO on buffer layer Lu 2 O 3. Physics Letters, 380(7–8), 970–972. https://doi.org/10.1016/j.physleta.2015.12.038
- Fan, G., Yu, M., Dong, S., Yeh, Y., & Hong, W. (2021). Forecasting short-term electricity load using hybrid support vector regression with grey catastrophe and random forest modeling. Utilities Policy, 73(September), 101294. https://doi.org/10.1016/j.jup.2021.101294
- Gu, Y., Bao, Z., Lin, Y., Qin, Z., Lu, J., & Wang, H. (2017). Journal of natural gas science and engineering the porosity and permeability prediction methods for carbonate reservoirs with extremely limited logging data : Stepwise regression vs . N-way analysis of variance. Journal of Natural Gas science and Engineering, 42, 99–119. https://doi.org/10.1016/j.jngse.2017.03.010
- Hadis Derikvandi, M. V. A. N.-E., Vosough, M., & Nezamzadeh-Ejhieh, A. (2020). A comprehensive study on the enhanced photocatlytic activity of a double-shell mesoporous plasmonic Cu@Cu2O/SiO2 as a visible-light driven nanophotocatalyst. Environmental Science and Pollution Research, 27(22), 27582–27597. https://doi.org/10.1007/s11356-020-08817-x
- Henrique, B. M., Sobreiro, V. A., & Kimura, H. (2018). ScienceDirect stock price prediction using support vector regression on daily and up to the minute prices *. The Journal of Finance and Data science, 4(3), 183–201. https://doi.org/10.1016/j.jfds.2018.04.003
- Hssi, A. A., Atourki, L., Labchir, N., Abouabassi, K., Ouafi, M., Mouhib, H., Ihlal, A., Elfanaoui, A., Benmokhtar, S., & Bouabid, K. Materials today : Proceedings structural and optical properties of electrodeposited Cu 2 O thin films. Mater. Today Proc. 2020, 22, 89–92.
- Jafari, A., Tahani, K., Dastan, D., Asgary, S., Shi, Z., Yin, X., Zhou, W., Garmestani, H., & Ţă, Ş. (2020). Ion implantation of copper oxide thin fi lms ; statistical and experimental results. Surfaces and Interfaces, 18(January). https://www.sciencedirect.com/science/article/abs/pii/S2468023019306194
- Kennedy, J., & Eberhart, R. Particle swarm optimization. IEEE International Conference on Particle swarm optimization, 4, 1942–1948. 1995. Perth, WA, Australia.
- Li, K., Ma, Z., Robinson, D., Lin, W., & Li, Z. (2020). A data-driven strategy to forecast next-day electricity usage and peak electricity demand of a building portfolio using cluster analysis, Cubist regression models and particle swarm optimization. journal of Cleaner Production, 273, 123115. https://doi.org/10.1016/j.jclepro.2020.123115
- Liu, T., Liu, Q., Hong, R., Tao, C., Wang, Q., Lin, H., Han, Z., & Zhang, D. (2021). Cuprous oxide induced the surface enhanced Raman scattering of silver thin films. Chemical Physics Letters, 783(September), 139071. https://doi.org/10.1016/j.cplett.2021.139071
- Majumder, M., Biswas, I., Pujaru, S., & Chakraborty, A. K. (2015). Cuprous oxide thin fi lms grown by hydrothermal electrochemical deposition technique. Thin Solid Films, 589, 741–749. https://doi.org/10.1016/j.tsf.2015.07.002
- Mallik, M., Monia, S., Gupta, M., Ghosh, A., Prakash, M., & Roy, H. (2020). Synthesis and characterization of Cu 2 O nanoparticles. Journal of Alloys and Compounds, 829, 154623. https://doi.org/10.1016/j.jallcom.2020.154623
- Messaoudi, O., Ben, I., Gannouni, M., Souissi, A., Makhlouf, H., Bardaoui, A., & Chtourou, R. (2016). Applied Surface Science Structural, morphological and electrical characteristics of electrodeposited Cu 2 O : Effect of deposition time. applied Surface Science, 366, 383–388. https://doi.org/10.1016/j.apsusc.2016.01.035
- Moharam, M. M., Elsayed, E. M., Nino, J. C., Abou-shahba, R. M., & Rashad, M. M. (2016). Potentiostatic deposition of Cu 2 O fi lms as p-type transparent conductors at room temperature. Thin Solid Films, 616, 760–766. https://doi.org/10.1016/j.tsf.2016.10.005
- Murillo-escobar, J., Sepulveda-suescun, J. P., Correa, M. A., & Orrego-metaute, D. (2019). Urban Climate Forecasting concentrations of air pollutants using support vector regression improved with particle swarm optimization : Case study in aburrá valley, Colombia. Urban climate, 29(August 2018), 100473. https://doi.org/10.1016/j.uclim.2019.100473
- Nair, M. T. S., Guerrero, L., Arenas, O. L., & Nair, P. K. (1999). Chemically deposited copper oxide thin films : Structural, optical and electrical characteristics. Applied Surface Science, 143–151. https://www.sciencedirect.com/science/article/abs/pii/S0169433299002391
- Norouzi, A., & Nezamzadeh-ejhieh, A. (2020). α -Fe 2 O 3/Cu 2 O heterostructure : Brief characterization and kinetic aspect of degradation of methylene blue. Physica B: Condensed Matter, 599(August), 412422. https://doi.org/10.1016/j.physb.2020.412422
- Olatunji, S. O., Owolabi, T. O., & Houssein, E. (2021). Barium titanate semiconductor band gap characterization through gravitationally optimized support vector regression and extreme learning machine computational methods. Mathematical Problems in Engineering, 2021, 1–12. https://doi.org/10.1155/2021/9978384
- Omrani, N., & Nezamzadeh-ejhieh, A. (2020a). Focus on scavengers ’ effects and GC-MASS analysis of photodegradation intermediates of sulfasalazine by Cu 2 O/CdS nanocomposite. separation and Purification Technology, 235(October 2019), 116228. https://doi.org/10.1016/j.seppur.2019.116228
- Omrani, N., & Nezamzadeh-ejhieh, A. (2020b). A novel quadripartite Cu2O-CdS-BiVO4-WO3 visible-light driven photocatalyst: Brief characterization and study the kinetic of the photodegradation and mineralization of sulfasalazine. Journal of Photochemistry and Photobiology A: Chemistry, 400(June), 112726. https://doi.org/10.1016/j.jphotochem.2020.112726
- Omrani, N., & Nezamzadeh-ejhieh, A. (2020c). Photodegradation of sulfasalazine over Cu2O-BiVO4-WO3 nano-composite: Characterization and experimental design. International Journal of Hydrogen Energy, 5. https://www.sciencedirect.com/science/article/abs/pii/S036031992031747X
- Omrani, N., & Nezamzadeh-ejhieh, A. (2020d). A ternary Cu 2 O/BiVO 4/WO 3 nano-composite : Scavenging agents and the mechanism pathways in the photodegradation of sulfasalazine. journal of Molecular Liquids, 315, 113701. https://doi.org/10.1016/j.molliq.2020.113701
- Owolabi, T. O. (2019). Modeling the magnetocaloric effect of manganite using hybrid genetic and support vector regression algorithms. Physics Letters, 383(15), 1782–1790. https://doi.org/10.1016/j.physleta.2019.02.036
- Owolabi, T. O., & Abd Rahman, M. A. (2021). Modeling the optical properties of a polyvinyl alcohol-based composite using a particle swarm optimized support vector regression algorithm. Polymers (Basel), 13(16), 1–17. https://doi.org/10.3390/polym13162697
- Owolabi, T. O., Akande, K. O., & Olatunji, S. O. (2015). Development and validation of surface energies estimator (SEE) using computational intelligence technique. Computational Materials Science, 101. https://www.sciencedirect.com/science/article/abs/pii/S0927025615000270
- Owolabi, T. O., Amiruddin, M., & Rahman, A. (2021b). Energy band gap modeling of doped bismuth ferrite multifunctional material using gravitational search algorithm optimized support vector regression. Crystals, 1–15. https://www.mdpi.com/2073-4352/11/3/246
- Owolabi, T. O., & Gondal, M. A. (2015). Estimation of surface tension of methyl esters biodiesels using computational intelligence technique. Applied Soft computing, 37, 227–233. https://doi.org/10.1016/j.asoc.2015.08.028
- Owolabi, T. O., Saleh, T. A., Olusayo, O., Souiyah, M., & Oyeneyin, O. E. (2021). Modeling the specific surface area of doped spinel ferrite nanomaterials using hybrid intelligent computational method. Journal of Nanomaterials, 2021. https://www.hindawi.com/journals/jnm/2021/9677423/
- Ozaslan, D., Ozkendir, O. M., Gunes, M., Ufuktepe, Y., & Gumus, C. (2018). Optik Study of the electronic properties of Cu 2 O thin films by X-ray absorption spectroscopy. Optik, 157, 1325–1330. https://doi.org/10.1016/j.ijleo.2017.12.119
- Prabu, R. D., Valanarasu, S., Ganesh, V., Shkir, M., Kathalingam, A., & Alfaify, S. S. (2018). Coatings technology E ff ect of spray pressure on optical, electrical and solar cell e ffi ciency of novel Cu 2 O thin fi lms. Surface and Coatings Technology, 347((September 2017), 164–172. https://www.sciencedirect.com/science/article/abs/pii/S0257897218304602
- Pramanik, D., Roy, N., Kuar, A. S., Sarkar, S., & Mitra, S. (2022). Experimental investigation of sawing approach of low power fiber laser cutting of titanium alloy using particle swarm optimization technique. Optics & Laser technology, 147(August 2021), 107613. https://doi.org/10.1016/j.optlastec.2021.107613
- Qu, F., Jiang, Q., Jin, G., Wei, Y., & Zhang, Z. (2020). Journal of petroleum science and engineering Mud pulse signal demodulation based on support vector machines and particle swarm optimization. journal of Petroleum Science and Engineering, 193(December 2019), 107432. https://doi.org/10.1016/j.petrol.2020.107432
- Ravichandiran, C., Sakthivelu, A., Davidprabu, R., Arun, K. D., Valanarasu, S., Kathalingam, A., Ganesh, V., Shkir, M., & AlFaify, S. (2019). The e ff ect of rare earth Nd 3 + doping on physical characteristics of Cu 2 O thin fi lms derived by electrodeposition technique. Thin Solid Films, 683(May), 82–89. https://doi.org/10.1016/j.tsf.2019.05.008
- Ravichandiran, C., Sakthivelu, A., Davidprabu, R., Valanarasu, S., Kathalingam, A., Ganesh, V., Shkir, M., Algarni, H., & AlFaify, S. (2019). Microelectronic engineering In-depth study on structural, optical, photoluminescence and electrical properties of electrodeposited Cu 2 O thin films for optoelectronics : An effect of solution pH. microelectronic Engineering, 210(March), 27–34. https://doi.org/10.1016/j.mee.2019.03.013
- Raza, M., Tasmia, S., Jilani, A., Raza, K., Zajif, S., Bilal, M., Iqbal, J., Abdel-wahab, M. S., & Darwesh, R. (2021). Synthesis and characterization of a novel single-phase sputtered Cu 2 O thin films : Structural, antibacterial activity and photocatalytic degradation of methylene blue. Inorganic Chemistry Communications, 128(April), 108606. https://doi.org/10.1016/j.inoche.2021.108606
- Reyes-Vallejo, O., Escorcia-garcía, J., & Sebastian, P. J. (2022). Materials science in semiconductor processing effect of complexing agent and deposition time on structural, morphological, optical and electrical properties of cuprous oxide thin films prepared by chemical bath deposition. materials Science in Semiconductor Processing, 138(September 2021), 106242. https://doi.org/10.1016/j.mssp.2021.106242
- Sanjana, T., Sunil, M. A., Shaik, H., & Kumar, K. N. (2022). Studies on DC sputtered cuprous oxide thin films for solar cell absorber layers. Materials Chemistry and Physics, 281(February), 125922. https://doi.org/10.1016/j.matchemphys.2022.125922
- Song, W., Cattani, C., & Chi, C. (2020). Multifractional Brownian motion and quantum-behaved particle swarm optimization for short term power load forecasting : An integrated approach. Energy, 194, 116847. https://doi.org/10.1016/j.energy.2019.116847
- Srinivasan, S. S. G., Govardhanan, B., Ashok, M., & Kumar, M. C. S. (2021). Influence of deposition time on the visible-light-driven photocatalytic activity of Cu 2 O thin films by reactive sputtering at room temperature. materials Letters, 284, 128980. https://doi.org/10.1016/j.matlet.2020.128980
- Tian, X., Wen, J., Chen, Z., Liu, X., Peng, H., Ji, C., Li, J., Peng, Y., & He, H. (2019). One-pot green hydrothermal synthesis and visible-light photocatalytic properties of Cu 2 O/Cu hybrid composites using egg albumin as structure modi fi er. Solid State sciences, 93(March), 70–78. https://doi.org/10.1016/j.solidstatesciences.2019.04.013
- Vapnik, V. N. (1995). The nature of statistical learning theory (pp. 70–92). Springer-Verlag New York, Inc.
- Wu, Y., Li, Y., Zhao, Y., Zhou, W., & Zhong, F. (2021). Preparation and photoelectric properties of F-doped cuprous oxide thin films. Optical Materials, 111(3), 110167. https://doi.org/10.1016/j.optmat.2020.110167
- Xu, H., Dong, J., & Chen, C. (2014). One-step chemical bath deposition and photocatalytic activity of Cu 2 O thin fi lms with orientation and size controlled by a chelating agent. materials Chemistry and Physics, 143(2), 713–719. https://doi.org/10.1016/j.matchemphys.2013.10.004
- Xue, Z., Zhang, Y., Cheng, C., & Ma, G. (2020). Neurocomputing remaining useful life prediction of lithium-ion batteries with adaptive unscented kalman filter and optimized support vector regression. Neurocomputing, 376, 95–102. https://www.sciencedirect.com/science/article/abs/pii/S0925231219313426
- Zhang, Z., Ding, S., & Sun, Y. (2020). A support vector regression model hybridized with chaotic krill herd algorithm and empirical mode decomposition for regression task. Neurocomputing, 410, 185–201. https://doi.org/10.1016/j.neucom.2020.05.075
- Zhang, L., Mcmillon, L., & Mcnatt, J. (2013). Solar energy materials & solar cells gas-dependent bandgap and electrical conductivity of Cu 2 O thin films. Solar Energy Materials and Solar Cells, 108, 230–234. https://doi.org/10.1016/j.solmat.2012.05.010