
 ?Mathematical formulae have been encoded as MathML and are displayed in this HTML version using MathJax in order to improve their display. Uncheck the box to turn MathJax off. This feature requires Javascript. Click on a formula to zoom.
Abstract
This paper reports the results of a research project aimed at designing heuristically oriented exploitation plans based on simple parameters of static modeling rather than complex ones of dynamic modeling for conventional gas reservoirs. The combined use of heuristic rules relying on the Maximum Efficient Rate (MER) criteria and the Maximum Depletion Rate Model (MDRM, Global Energy Research, Uppsala University) was investigated to model a systemic approach for these reservoirs. Integration of these principles and their comparative evaluation led to findings about their mutual relationships, notably the MER to be regarded as a particular case of the MDRM. The rules rely on a combined use of the exponential version of the Fundamental Equation of Mineral Production (EFE) with the exponential decline (ED) curve analysis. A bridge between the physics of flow in porous media and the Law of Conservation of Matter was found by demonstrating the conditions of equivalence between the ED and the EFE. Production data built upon reservoir characterization of the gas reservoirs supported the comparative analysis. A systematic approach enabled the replication of the material balance-based production profiles by applying a MER-based P/R of 0.08 and a MDRM based of 6 for the plateaus of the wet and dry gas reservoirs, respectively. Production models rested on broadly accurate rules relying on mutual relationships between contemporary volumes of reserves and output yields. The production models reviewed appear useful for a discrete application of the Ockham razor criterion to make relatively effortless modeling of conventional gas reservoir production.
PUBLIC INTEREST STATEMENT
Natural gas is arguably the most environmentally friendly fossil fuel among all kinds of hydrocarbons. It is undisputed that greenhouse gas emissions are lower than those of oil and coal. Its abundance, versatility and suitability to partner with renewable energy sources makes it an optimal candidate to meet the growing demand for energy at a global scale. The production stage of the upstream phase of the gas industry is always in the need of accounting with reliable methods for the early assessment of the exploitation plans of this resource. To that end has it been devised a heuristic scheme based on a novel combination of a general exponential function handling the exponential decline, with the well-established concepts of the Maximum Efficient Rate (MER) and the Maximum Depletion Rate Model (MDRM, Global Energy Research, Uppsala University). The methodology advocated in the present document addresses vital factors for the assessment of the extraction of natural gas: the timely and reliable modelling of reservoir gas production.
1. Introduction
A variety of resourceful methods are available in the field of petroleum engineering to design production and development plans for oil and gas fields and reservoirs. Oil and gas reservoir production, one of the primary objectives of the material balance method (Baker et al., Citation2015) is highly reliable. However, it requires the input of a whole set of variables (Sanni, Citation2018; Temizel et al., Citation2019) whose complete availability is not always warranted at early stages of reservoir characterization and testing (Zhuang et al., Citation2020). In a challenge of such shortcomings, heuristic modeling stands out for its practicality and relative ease of implementation as compared to other technologies. This is specially noticed when to achieve a timely design of production and development plans is the goal (Murtha, Citation2006; Omer, Citation2009; Pukite et al., Citation2019). Recent and past studies have been conducted in the field of heuristic modeling of the exploitation of fossil fuel resources. These have been usually focused on the validation of the notion of global peak oil, on the relationships between production profiles, and on the evolution in time of hydrocarbon reserves (Deffeyes, Citation2005). Gross statistical data at global or country scales cascade down to the number of resources available at the moment of the peak of production of smaller oil and gas assets that are at the base of the hydrocarbon production chain (reservoirs, wells, and fields). Results of the analysis of global statistical data related to these assets, conducted by researchers of the Global Energy System research group of the Uppsala University during the past decade, have provided useful insights for the concoction of a frame of reference to model and forecast their hydrocarbon production. These studies consider mutual relationships between the production and the reserves these assets develop. Their notion of the MDRM relies on the existence of a minimum reserve-to-production ratio ((R/P)min) as a constraining factor regulating the possibilities of the yields of production with regard to the remaining reserves. In this instance, there is an opportunity to investigate the notion of a (R/P)min in connection with the one of the MER, which works from the viewpoint of the ratio of the production to reserves (P/R). The MER embodies practices looking to ensure the rational exploitation of the resources by the achievement of a fair trade-off between allowable production rates (at affordable production costs) and optimal recovery factors (D’Orazio, Citation2007). Conservative exploitation of hydrocarbon accumulations has been a subject of intense attention, research, and controversy since the early days of the oil and gas industry. The early oilmen’s irrational methods of production still practiced as late as the 1930s, often led to rapid and bulky initial recoveries followed by considerable shares remaining in the ground after their initial recoveries (Lang Weaver, Citation2011; Mommer, Citation2010; Yergin, Citation2012).
A large amount of evidence from the historic records of fields on a global scale indicated that in order to achieve a MER, it is necessary to keep the annual production rates in the range of 3% to 8% of the remaining reserves (Hyne, Citation2014; Levorsen, Citation2001). Current knowledge of hydrocarbon reservoirs indicates, however, that the MER criteria have some limitations, despite their broad scope. One such key condition is the sensitivity of the reservoirs to the rate of productions (Terry & Rogers, Citation2015). Conventional wet gas reservoirs producing under a water drive mechanism are regarded as rate sensitive. Dry gas conventional reservoirs subject to depletion drive have been identified as rate insensitive (Raza et al., Citation2019). A key aspect to consider during the analysis of conventional gas reservoir production trends is the fact that exponential decline is one of the most commonly used decline curves to model conventional reservoir gas production, from wells to fields (Söderberg, Citation2010; Thakur, Citation2017).
The exponential version of the fundamental equation of mineral production (EFE), constructed upon a temporal functional relationship between the P/R and the initial mineral reserves (Pérez Rodriguez, Citation2013a), is both fit to model exponential decline and reservoir production under MER and MDRM conditions. These features make the EFE suitable to investigate the rational production of dry and wet gas conventional reservoirs under the viewpoint of reference of the MER and the MDRM. They also open the door to explore options for the application of the EFE to build a systemic approach for conventional reservoir gas production through the combined use of heuristic rules relying on the MER criteria and the MDRM.
The project documented in this article aims to develop a methodology for applying EFE to the heuristic modeling of reservoir gas production. Thus, the engineers responsible for designing the production and development plans for gas reservoirs will have access to new resources that will enable the timely execution of these plans. A case of production of a wet gas well from the North Dome field (Miller, Citation2009), and another of a dry gas reservoir subject to depletion drive (Dake, Citation2010), are used to study the objectives of the present research.
2. Case study
2.1. Dry gas reservoir under depletion drive
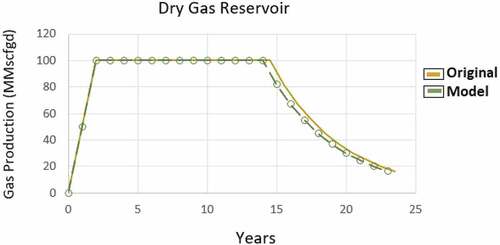
According to Dake (Citation2010), the production profile of a dry gas reservoir with an Estimated Ultimate Recovery (EUR) of 636.73 Bcf presents the next features (orange curve, Figure ).
Figure 1. Production profiles of the gas reservoirs studied. Modified after .Miller (Citation2009) and Dake (Citation2010)
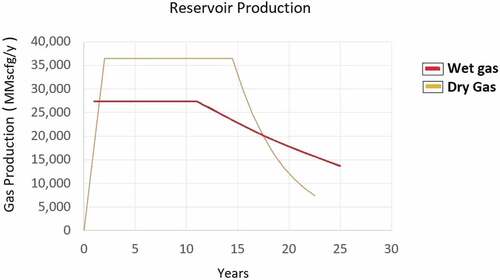
Two years from start-up to reach a plateau rate of 36,500 MMscfg (equivalent to a daily rate of 100 MMscfd).
A minimum reservoir pressure threshold of 1,200 psi allows the plateau rate to be sustainable for 12.5 years. This is a critical aspect of the original model, as the reservoir characterization analysis determined the duration of the plateau based on a variable not directly involved in the heuristic models hereby proposed.
A decline rate of 20% per year goes on for 8 years until an annual abandonment rate of 7,300 MMscf is reached (equivalent to a daily rate of 20 MMscfd).
The aquifer is small, so the driving mechanism of this reservoir is volumetric depletion. Dake (Citation2010) does not provide further information about features of the reservoir and of its operational settings. However, it is known that for reservoirs featuring a pressure in the range of 1,200 psi, the temperature conditions are in excess of 225 degrees Fahrenheit. Also, that a 2.375 inch completion tube is a sound operational setting for a dry gas reservoir yielding in the order of 100 MMscfd (Marangoni, Citation2005).
2.2. Wet gas reservoir under water drive
According to Miller (Citation2009), wet gas yields from a horizontal well produced at the North Dome field in Qatar are expected to display the following trend (red curve, Figure ).
The well stays in a plateau rate of 27,375 MMscfd for 11.5 years.
A nominal decay rate of 5% is presented at the onset of decline, and continues during the next dozen years.
Both water and expanding gas cap are major reservoir drive mechanisms of the wet gas pool present in the Khuff Formation, North Dome field.
The average of EUR of gas for individual wells in this field is in the order of 1.13 Tcf (Whitson & Kuntadi, Citation2005). This figure will be used as a reference with the result of a volumetric estimation of the EUR based on the production profile of the well in question.
The depth of the top of the reservoir (Khuff Formation) is reported to be 2,492 m. The initial reservoir pressure and temperature are 5,300 psi, and 220 degrees Fahrenheit, respectively.
The operational settings of the well model fit a design of either a 5 in. by 5 and 1/2 inch completion tubing or the 7-inch monobore which handle flow rates up to 125 MMSCF/D. Intelligent well valves and chokes were not considered in the horizontal well models.
3. Methodology
Background: The exponential version of the fundamental equation of mineral production (EFE) is a general exponential function constructed using the Law of Conservation of Matter (LCM) upon the arithmetic complement of C, and the production-reserves ratio (P/R) as a base (Pérez Rodriguez, Citation2013a, Citation2013b).
Where,
Ro is the initial reserve (or EUR).
q(t) is the production rate at time t
C is the production-to-reserves ratio (P/R, or the inverse of R:P, the reserves-to-production ratio ω, also referred as the Production-Life-Index (years). Cf., (Feygin & Satkin, Citation2004). The values come as proper fractions for calculation but can be referred to as correspondent percentages (e.g. 0.1 referred as 10%).
In order to gain details of the physics behind the setup of the equation, we recommend that readers consult the demonstration of the connection between the EFE and the LCM presented in Pérez Rodriguez (Citation2021).
The EFE was first developed and applied to model and forecast the decline of a production district in the Maracaibo Basin (Pérez Rodríguez, Citation2006). The method can be easily adapted so as to model the exponential decline of mineral production at scales as diverse as individual wells (Pérez Rodríguez, Citation2019) to countries (Pérez Rodriguez, Citation2013a).
The exponential decline (ED), one of the three classic cases of decline curve analysis of hydrocarbon reservoirs derived from the Arps equation, adopts the following expression (Okotie & Ikporo, Citation2018; Poston & Poe, Citation2008; Sanni, Citation2018)
Where,
qi is the initial production rate
d is the nominal decline rate or nominal decline factor
q(t) is the production rate at time t
The ED is a solution for the next equation, which is found studying the relationship between production (as flow rate) and time. According to such a functional plot, the nominal decline rate d is equal to the slope at a point in time of the tangent to the production curve divided by the rate at that point.
where β is a constant named the β-exponent. The ED is the solution of EquationEquation (3)(3)
(3) when β = 0.
This can be deduced by noticing that since d(lnq) = 1/q, then EquationEquation (3)(3)
(3) can be expressed in the next differential form of (Poston & Poe, Citation2008; Sanni, Citation2018):
Which leads to define the β-exponent in EquationEquation (3)(3)
(3) as:
Where the β exponent term is to stay constant when the producing rate declines from an initial to a posterior value. The integration of EquationEquation (3.2)(3)
(3) from ti = 0 to tf = t, with di being the initial rate at t = 0 results in:
Substitution of EquationEquation (3.3)(3)
(3) into EquationEquation (3.1)
(3)
(3) brings:
When β = 0, EquationEquation (3.4)(3)
(3) reduces to the next (Höök et al., Citation2014; Poston & Poe, Citation2008):
Finally, integration of EquationEquation (3.5)(3)
(3) results in EquationEquation (2)
(2)
(2) , and from which, therefore, is the solution of EquationEquation (3)
(3)
(3) when β = 0.
Both the ED and the EFE describe the same process, but one uses the Euler number as the base of the exponent, while the other uses fractions as the base of general exponential functions.
During the modeling of the declining stage of a case study of shale gas well production from an unconventional reservoir, Raza et al. (Citation2019) presented a first glance about the possibilities for linking C, the P/R in EquationEquation (1)(1)
(1) , with the nominal decline rate d in EquationEquation (2)
(2)
(2) . As the present paper describes the results of a project about modeling gas production from conventional reservoirs, readers who would like to investigate the modeling of gas production from unconventional reservoirs can refer to a review by (H. Liu et al., Citation2020) for more information. In the present case, where the modeling of dry and wet gas production from conventional reservoirs is considered, the functional connection between these two parameters is given as follows.
The left and right members in the identity given in EquationEquation (1)(1)
(1) can be divided into the multiplication of two components,
One is CRo (or CQ∞), which equals qi in the ED.
The other is (1-C)t, which equals e—dt in the ED.
These equalities demonstrate the equivalence between the terms at both sides of the identity that results from equaling EquationEquations (1)(1)
(1) and (Equation2
(2)
(2) ).
As a consequence of the aforementioned identity, the next expressions are deduced for the decline rate as a function of the constant P/R and vice versa.
Out of all the classic Arps decline curves, ED is the only one that is supported by the physics of flow in porous media (Satter & Iqbal, Citation2016). Considering the equivalence between the ED and the EFE (EquationEquations (4(4)
(4) –Equation6
(6)
(6) )), this property of the ED relates to the support received by the EFE from the LCM since both the physics of flow in porous media and the LCM are among the three basic laws regulating the production of underground fluids and gases (Zimmerman, Citation2018). Furthermore, the results of EquationEquations (5)
(5)
(5) and (Equation6
(6)
(6) ) indicate that C is equivalent to the effective decay factor D of the ED, which maintains an identical relationship as C with the nominal decay factor d (Okotie & Ikporo, Citation2018).
Once the original production outputs of the reservoir or well (as seen in Figure ) are digitized, the exponential fit for the exponential decay segments of their production profiles is found. EquationEquation (6)(6)
(6) is then applied to get the respective values of C to implement the model of the EFE as given by EquationEquation (1)
(1)
(1) , using the values of d provided by each fitting equation. This is a key step to proceed with a subsequent ED analysis based on the evaluation of the P/R that operates in the exponential decline curves under analysis.
One key requisite for the use of the EFE is the knowledge of the EUR. A linear relationship between the production and the cumulative production can be of help to figure out the EUR for reservoirs/wells producing under exponential decline (Satter & Iqbal, Citation2016). Furthermore, an expression of the kind q = aQ+b, where q and Q are coeval production and cumulative production, respectively, can be used to assess EUR. This can be done either analytically (Q at q = 0 comes as -b/a) or graphically. In the latter case, the EUR is obtained by inspecting the value of Q at the intersection of the straight line and the horizontal axis. The linear relationship of the kind q = a Q + b, between coeval values of q and Q associated with production under exponential decline trends can be established as follows
Which is of the form
Where,
For mineral assets producing under exponential decline with a known P/R, if XD is the ratio of the remaining reserves over the initial ones at a given time n, then n is the number of years to achieve a given depletion FD as a fraction 1-XD of the initial reserves. It can be estimated with the next formula (Pérez Rodriguez, Citation2013a)
Where, C is the P/R corresponding to the exponential decline trend. An expression such as the one above will be useful to determine the temporal occurrence of significant events of the production cycle of assets under consideration. The usefulness of the said expression is further realized when the next specs of production under the MER criteria (Levorsen, Citation2001), the MDRM and other guidelines from the researchers of the Uppsala University (Cf. Jakobsson et al., Citation2009) are implemented.
In the following order of ideas, the design of the theoretical history of production to be compared with the actual production record of the cases under study follows the following principles.:
In principle, a minimum default (R/P)min is set to 6 and a maximum default (R/P)max is set to 10. The former is the smallest value in the record of cases reported by Jakobson et al., , found with reference to Oseberg field in the North Sea, while the inverse of the latter is just 10% in excess of the highest P/R allowable (0.08) according to the MER criteria (Cf., Archer & Wall, Citation2012).
A default production curve is set up to define the production profile. In this study, it will be based on the options mentioned below.
a) Option A: The range of allowable P/R is set according to the MER criteria (P/RMER). The temporal extent of the plateau is calculated with the aid of EquationEquation (8)(8)
(8) , using an average P/RMER based on the record of production until about 40% of the initial reserves are depleted. The reference for the production rate qMAX at the plateau of production of fields is calculated as the maximum value between the ratio of the cumulative production and the number of years of duration of the plateau. The volume of cumulative production resulting from a continuous exponential decay based on P/RMER since the beginning of production can be found by solving the following equation (Pérez Rodriguez, Citation2013a), while the duration of the plateau is found with the aid of EquationEquation (8)
(8)
(8) .
A MER-based P/R is used when the initial reserves have been depleted by about 40% (Cf., Höök et al., Citation2009).
The qMAX is then set as C (0.6 Ro), since this hallmark implies a reserve balance at the end of the plateau of 60% of the EUR. The decay curve during the declining stage is set up using the EFE with the P/RMER, the resource base and parameters for the defining equation. As the MER criteria have been established upon for rate sensitive conventional reservoirs, this option is set aside for the experimental modeling of the wet gas.
b) Option B: An initial default P/R was set as needed to achieve a goal output at the plateau rate. The P/R will be allowed to increase annually up to the first year where 0.17, the inverse of the (R/P)min of 6 is achieved, or just overpassed. Therefore, the temporal extent of the plateau is limited to a record of production until this (R/P)min is reached. The decay curve during the declining stage is set up using the EFE. To that end, the definition of the equation is based on the inverse of the minimum (R/P)min, which is achieved at the end of the plateau stage, while the resource base available at that time is set up as the initial reserves.
The original model provides that production at plateau rates continues throughout the years that the reservoir characterization has already been determined to be feasible according to the physics laws which underlie its analysis. This might or might not coincide with the year when (R/P)min is achieved. Among the options, yearly estimations of the current resource base (remaining reserves) are to be made.
The R/P for each year is to be computed either directly as the (R/P)min or as the inverse of the default or MER-based P/R, which is equivalent to the ratio between yields from yearly production outputs and the coeval volume of the resource base.
The results of the calculations made based on the equations applied in this study and the plots relating to them in the next section were figured using Microsoft Excel.
4. Results
4.1. Model option A: well in a wet gas reservoir
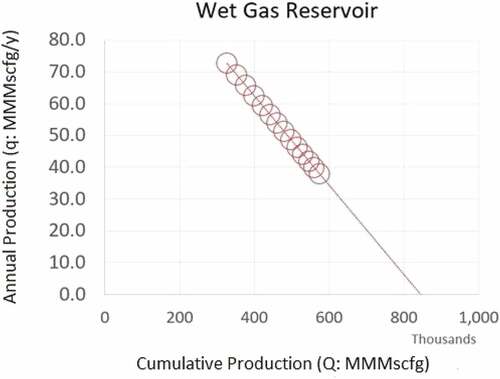
The calculation of the EUR applying the respective method described in the methodological section in relation with EquationEquation (7)(7)
(7) indicates a volume of 847.43 MMMscfg (Figure ). The straight line reaching the final cumulative production Q when there are no more resources left to support annual production (q = 0), results from the extrapolation of the trend given by last 14 known annual production records (open circles)
Figure 2. Production versus cumulative production plot.
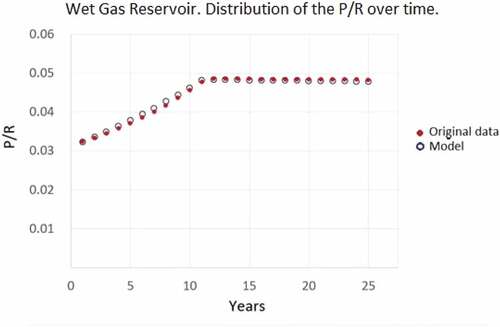
The depletion rate at the final year of the plateau for the well producing from the wet gas reservoir is 36%, for which the XD to be used in EquationEquation (8)(8)
(8) is 0.64. The (weighted) average value of the P/RMER during the years of the plateau is 0.04 (Figure , midpoint of the hollow blue points aligned to a linear trend of positive slope). With these input parameters, EquationEquation (8)
(8)
(8) gives 11 years as the duration of the plateau. The P/R is constant and close to 0.05 during the declining stage of production (Figure , hollow blue points distributed horizontally). The general match between the distribution of points of the model (blue hollow points in Figure , found via EquationEquation (1)
(1)
(1) ) and the distribution of points of the original data (red points) is strikingly close.
Figure 3. Wet gas reservoir production. Evolution in time of the P/R.
EquationEquation (9)(9)
(9) gives a figure of 300.91 MMMscfg for the cumulative production for 11 years following a basic decline model with a P/RMER de 0.04 and initial reserves of 847.43 MMMscfg. Option A model then indicates an average production rate of 27,355 MMscfg at the plateau (Figure , hollow blue points).
Figure 4. Production profile of a wet gas well in the North Field, Qatar. Modified after Miller. (Citation2009)
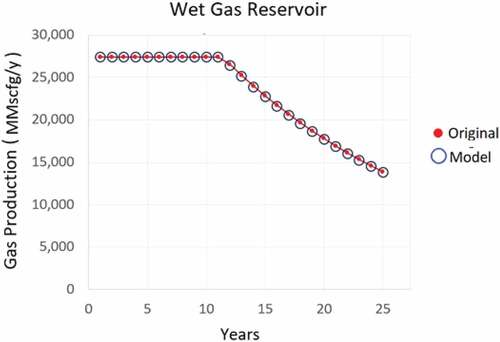
The P/RMER during the declining stage is 0.05, while the remaining reserves at the initial year of the decline stand at 542.36 MMMscfg (= 0.64 × 847.43 MMMscfg). Figure displays both the inferred outputs at plateau rate and the subsequent decline trend found by applying EquationEquation (1)(1)
(1) with the aforementioned parameters (blue hollow circles), compared to the original dataset (red points and curve).
4.2. Model option B: dry gas reservoir
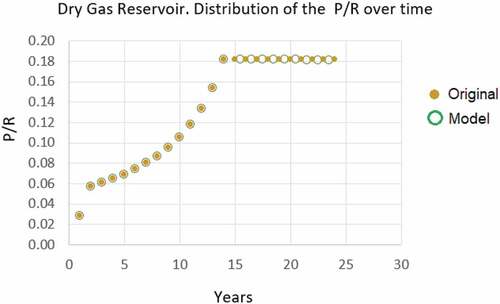
By the second year, the initial default P/R needed to achieve a goal output of 100 MMscfd at the plateau rate is 0.06 (= 36.6/636.73 MMscfg, dark gold point for second year in Figure ). This is smaller than 0.17, the inverse of the (R/P)min of 6, and also within the boundaries of an allowable MER. The theoretical onset of declining yields is triggered by the rise of the P/R from 0.06 to 0.18. By then, 0.17, which is the inverse of minimum (R/P)min of 6, has been exceeded. The first year when the inverse of the (R/P)min is achieved is 14 years. This falls short for just half a year respective to the 14.5 years of duration of the plateau, according to the reservoir characterization model.
Figure 5. Production profile of a dry gas reservoir. Modified after. Dake (Citation2010)
It can be noticed that the weighted average of P/R from the start date until the final year of the plateau is 0.094 (approximate midpoint of the dark gold dataset segment of the half parabolic curve in Figure ). The same P/R is used to calculate qMAX. Since the XD by the final year of the plateau is 0.25, and the weighted average of the set of P/R during that interval is 0.094, EquationEquation (8)(8)
(8) correctly points out that this final year of the plateau corresponds to the 14th year after the start of production (= ln(0.25)/ln(0.907)).
It was observed that model Option B (dark green dashed line in Figure ) has a shorter plateau than the original data (horizontal dark gold continuous segment). Also, its production decay begins before the original model but at the same rate (dark gold points and green hollow horizontal points distributed at 0.18 in Figure ). Figure illustrates a parallel between the model of Option B and the original (dark green dashed segments, obtained with EquationEquation (1)(1)
(1) , and dark gold exponential continuous segments, respectively).
Figure 6. Dry gas reservoir production. Evolution in time of the P/R.
5. Discussion
The production profiles of the cases under study, though ideal, adhere to the usual approach to analyzing these phenomena. Accordingly, gas production profiles recorded from wells and reservoirs, although generally following exponential decay patterns, may be quite irregular (Cf., Ahmad & Chaudhry, Citation2002; Fahes, Citation2013). This has promoted the use of exponential average trend fittings as a common practice (Azeez, Citation2014; Fanchi & Christiansen, Citation2016; Mireault & Dean, Citation2008).
EquationEquation (1)(1)
(1) expresses the EFE as a general exponential equation, expressing the P/R (or C) in the coefficient and not only in the exponent, as the Arp’s ED does. This makes evident and easier to explain to the reader the relationship between the initial reserves Ro and the P/R with the initial output of production. Also, the structure of this equation presents an expression ((1-C)t), containing the P/R in the base of the equation rather than only a part of the exponent, as the Arp’s ED does. Therefore, we can grasp the nature of the numerical relationship between P/R and the evolution of reserves over time as production depletes them.
Although the instruments of modeling used in this study are backed by physical laws, their suitability to model some types of gas reservoirs (e.g., high-pressure ones) remains in question. Accordingly, for some of these gas reservoirs, the value of the decline exponent b (Cf., EquationEquation (3)(3)
(3) ) varies with production time for which modeling and prediction of their current and future performance yields deviate from a reliable use of the ED to avoid erroneous findings (Jongkittinarukorn et al., Citation2021).
Using the rules of Option B, a fair replication of the production profile of the dry gas reservoir was achieved (Figure ). Option B not only managed to match the goal output of the plateau rate as required by the conditions of the case but also replicated its duration as calculated upon the pressure data supplied to the reservoir characterization model (only a failing short by 3%). Option B exactly reproduced the effective decay factor of 18% present in the ED (or the P/R in the EFE) during the decline of production of the reservoir according to reservoir characterization. The matching of the plateau length as indicated by reservoir characterization and that indicated by EquationEquation (8)(8)
(8) using a P/R of 0.091 and a XD of 0.25 was another striking demonstration that the heuristic method presented was able to achieve results similar to those of reservoir characterization.
The proximity to the P/R of 0.18 given by the original model, and 0.17, the inverse of the (R/P)min of 6, has been provided, as it was mentioned earlier, by the analysis of the production of the Oseberg field (Jakobsson et al., Citation2009). This factual (R/P)min of the declining stage, conducive to an “off the chart” P/R of 0.17 in the MER criterion but suitable for a rate insensitive reservoir, is originated from an oil field producing with a combination of gas cap and water drive (Fleming et al., Citation2007) and not from a dry gas field producing through depletion drive.
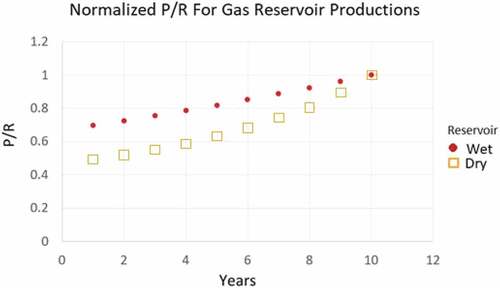
A significant difference between the P/R of each of the cases analyzed is noticed during the respective years producing plateau rates. For the wet gas reservoir, the distribution of the P/R followed a near linear trend of positive slope, while for the dry gas reservoir the equivalent distribution of points followed a parabolic curve (Figures and 6, Cf., Pérez Rodriguez, Citation2020). The plot of Figure displays the respective distributions of P/R normalized using the highest P/R at the final year of their plateaus, with the red points corresponding to the wet gas reservoir and the orange hollow squares to the dry reservoir. The comparative analysis of the normalized distributions of P/R during the respective plateau years indicates that the distribution of the P/R for a wet gas reservoir is consistently above the same distribution of the dry gas reservoir. This result seems to reflect the dynamics of the physics behind the process of production. Dry gas reservoirs are producing under depletion drive, because it is assumed that hydrocarbons occupying the reservoir volume will not decrease during depletion. This is acknowledged as a less efficient recovery mechanism than that of a wet gas reservoir under water drive. The latter produces efficiently due to the input of an aquifer doing the driving job (Dake, Citation2010).
Figure 7. Dry and wet gas reservoir productions. Evolution in time of their respective normalized P/R.
The reasonable success in the intended reproduction of reservoir characterization-based production outputs of a rate insensitive dry gas reservoir shows that MDRM based, and in less extent, a combination of MER/MDRM “rules of thumb” devised and applied are suitable to grasp or represent an interplay between production and reserves featuring a systemic behavior that could be present in such reservoir. However, even if such systemic behavior is successfully featured, there are issues to be considered in the modeling of the production of dry gas reservoirs, especially present if the onset of boundary-dominated flow occurs. Effectively, for such circumstances some technical handling is necessary, not only to match a decline exponent, especially at an early stage of well/reservoir depletion, but also to tackle changes occurring in such an exponent during the decline of production (Okoro et al., Citation2019).
The replication of the production profile of the well-draining the wet gas reservoir using the rules of Option A was satisfactory. The MER criteria worked fine when applied to reproduce production results based on reservoir characterization. The outcomes succeeded in showing a practical working case where the use of the EFE and the decline curve analysis operating under the MER criterion confirmed expectations based on the historic record of the oil and gas industry for rate sensitive conventional reservoirs (D’Orazio, Citation2007; Terry & Rogers, Citation2015).
Nevertheless, there are some considerations to make about the validity of this result. In wet gas reservoirs, especially those considered liquid rich, the onset of multiphase flow and condensate blockade could deviate production yields from the model of a steady exponential decline pattern or halt maximum production yields during the plateau (cf., Ghorashi & Monghad, Citation2015; Khanal et al., Citation2016). Due to the fact that there is quite a range of condensate gas ratios (CGR) of the reservoirs at the North Field/South Pars fields, consideration of limitations in the intended production modeling is necessary (Kuntadi, Citation2004). In this instance, the results provided in this research attain to ideal conditions where such inconveniences are readily solved and under operational control, which are best presented whenever reservoir pressure has not declined below the dew point pressure or constant-volume depletion. The model could also work where results for the North Field and others indicate that retrograde gas condensate volumes in specific reservoirs of these fields can be so small as to place these reservoirs in the transition between wet and dry gas wells (Kuntadi, Citation2004; J. Liu et al., Citation2003; Masoud & Surja, Citation2007).
In this regards, a significant feature of the horizontal well presented by Miller (Citation2009) displayed a drawdown pressure smaller than vertical wells producing from the same wet gas reservoir, leading to a delayed dew point pressure being reached as compared to vertical wells. When the dew point pressure is reached and oil saturation forms in the reservoir, the accumulation of oil saturation around the horizontal wellbore is more than a half order of magnitude (6.5 times) lower than around the vertical wellbore. The ratio of horizontal well PI to vertical well is more than half order of magnitude (5.8) after the dew point. There is a twofold increase in the ratio of the PI after the dew point is reached, which Miller (Citation2009) attributed to the ability of the horizontal well to reduce condensate blockage in the near wellbore.
In depletion drive reservoirs, the gas-water contact remains substantially stable during the production and injection periods allowing high performances and minor problems during the production (Sagnaliyeva, Citation2016). The absence of a water drive means there will be little or no water production with the oil during the entire producing life of the reservoir.
One aspect of bringing together the MER and the MDRM criteria in the heuristic modeling of mineral production is the exploration of their connection in the sense of considering one as being the generalization of the other, or one being a particular case of the other. If the MER is to be bounded by the acknowledged range of P/R between 0.03 and 0.08 (as seen in the model presented in Figure ), then the MDRM can be seen as a generalization of the MER (or the MER a particular case of the MDRM), as the MDRM offers a broader spectrum of P/R through the inverse values of its allowable (P/R)min. Research communities are likely to accept this judgment in the future since the MER gained its validity based on vast amounts of records of rate-sensitive reservoirs, whereas the MDRM can be adapted to model production from rate sensitive or insensitive reservoirs. The method devised through the two options presented, allowed for a replication of production profiles based on rules that rely on a systemic response of the reservoirs to the interplay between its production and the remaining volumes of reserves in the entity. This approach considers that the systemic response implicitly contemplates or responds to the effects of variables not explicitly present in rule-based models as they are in comprehensive reservoir characterization models. In this sense, the method presented can get support from the Ockham razor (Cf., Carmichael, Citation2013; Deffeyes, Citation2005) for the purpose of deciding between either making a laborious (and may be conditioned to a long waiting time for pending data) or a relatively effortless modeling of conventional gas reservoir production. This is particularly notorious when there are not enough data to perform a formal reservoir characterization analysis of newly discovered or poorly tested conventional gas reservoirs, but financial evaluations and decisions are required as soon as possible. Figure also supports this idea, as it demonstrates that it is possible to grasp a relatively profound, yet accurate understanding of the natural phenomena studied by applying less variables and simpler techniques than those habitually used in reservoir characterization models. The linear to parabolic trends presented by the distributions of points for both reservoirs evidence how the features of this parameter are able to grasp their characterization as whole entities. This can be interpreted as systemic responses synthetizing the particular reservoir dynamics of the production mechanism of each reservoir.
However, when there is plenty of availability of time and data, it is acknowledged that much more sophisticated and complex models than the ones presented here should be devised.
6. Conclusions
The conditions of equivalence between the ED and the EFE as evidenced through the functional relationships between the nominal decline rate d of the ED and the constant P/R C of the EFE (EquationEquations (4(4)
(4) –Equation6
(6)
(6) )). These equations provided a bridge between the physics of flow in porous media and the LCM. It is stressed that both principles are among the three fundamental physical laws that regulate the production behavior of underground fluid and gases.
Replication of production trends from gas reservoirs was based on the combined use of the EFE with the acumen of classic ED. The method presented allowed to implement broadly accurate rules relying on mutual relationships between contemporary volumes of gas reserves and output yields. These instruments of investigation proved to be suitable for the accomplishment of the objectives of the intended research in heuristic modeling.
The “rules of thumb” based on the MDRM and/or the MER criteria permitted a fair replication of well production data built upon reservoir characterization from a rate-sensitive wet gas reservoir.
Since the upper threshold of the MER criterion is defined by a P/R of 0.08, replication of production behavior in rate-insensitive reservoirs, as the dry gas one in the case study Option B, is not feasible based on this principle alone.
An upgrade of the MER criterion was devised to obtain a corresponding match with the production profile based on reservoir characterization for the rate-insensitive dry gas reservoir reviewed. The upgrade relies on an unusually low (R/P)min that is used under MDRM standards, and beyond those of the MER criterion. However, its application is valid, as the underlying principles of the MDRM criterion are held.
Depending on the approach taken for the comparative evaluation of the MER and the MDRM criteria, there is a good chance that that research community could eventually realize the MDRM as a generalization of the MER, or else, the MER as a particular case of the MDRM.
The results also show how far the systemic rules for production models replicating profiles of a rate insensitive conventional dry gas reservoir under depletion drive could depart from the ones that are applicable to duplicate the outputs of a rate sensitive wet gas reservoir. In either case, the attempts to identify a systemic pattern providing reliable output yields based on a mutual relationship between coeval production and reserves succeeded to match results of production profiles supported by reservoir characterization.
The comparative analysis of the normalized distributions of P/R during the respective plateau years of the reservoirs studied pointed to two significant findings. One is that the distribution of the P/R for a wet gas reservoir is consistently above the same distribution of the dry gas reservoir. Another is that these distributions also display trends fittable by simple algebraic functions. This probably reflects systemic responses synthetizing the particular reservoir dynamics of the production mechanism of the reservoirs. In some circumstances, this last finding provides grounds to apply the Ockham razor criterion to model conventional gas reservoir production via the proposed method. The resulting benefit is an informed decision to make an effortless heuristic modeling of conventional gas reservoir production, so often needed prior to a laborious reservoir characterization.
Acknowledgements
To my granddaughter Mary Margaret and my grandson Rocco Marquiste, the joys of my life.
The author would like to thank the help in proofreading provided by writer Deane Gremmel (a.k.a. pen names Chris Pike and Blake O’Connor).
The author gives thanks to Dr Emilio Pérez Pacheco for the tutorial assistance provided during the doctoral project.
Disclosure statement
No potential conflict of interest was reported by the author(s).
Additional information
Funding
Notes on contributors

Sergio Pérez Rodríguez
Sergio Pérez Rodríguez works as an oil & Gas Field Researcher in the Energy & Natural Resources division of a London-based data and analytics firm. Prior to that he was a Basin Researcher for the same company, committed for a half-decade to do intelligence analysis for exploration of sedimentary basins in Latin America. Among other projects in geoscience, it has been dedicated to innovation in the modeling and forecast of mineral production through the conception and development of the Equations of Mineral Production, whose results have been divulged in several journals and conferences. Sergio has a degree in Engineering Geology by the Universidad Central de Venezuela, and a Postgraduate Diploma in Geology and a Master in Science, both granted by Royal Holloway, University of London.
References
- Ahmad, N., & Chaudhry, S. (2002). Kadanwari Gas Field, Pakistan: A disappointment turns into an attractive development opportunity. Petroleum Geoscience, 8(4), 307. https://doi.org/10.1144/petgeo.8.4.307
- Archer, J. S., & Wall, C. G. (2012). Petroleum engineering. Principles and practice. Springer.
- Azeez, L. O. (2014). Statistical Data-Driven Models for Forecasting Production Performance with Uncertainty Analysis, M. Sc. Thesis, The African University of Science and Technology.
- Baker, R. O., Yarranton, H. W., & Jensen, J. (2015). Practical reservoir engineering and characterization. Elsevier.
- Carmichael, L. E. (2013). Scientific method in the real world. ABDO Publishing.
- Dake, L. P. (2010). Fundamentals of reservoir engineering. Elsevier.
- Deffeyes, K. S. (2005). Beyond Oil: The view from Hubbert’s Peak. Hill and Wang.
- D’Orazio, F. (2007). Análisis económico aplicado a la industria petrolera. Del Ureca al Dorado: Una visión completa de la historia petrolera venezolana (Tomo I). Libros en Red.
- Fahes, M. (2013). A review of latest research in condensate blocking. In M. Weichold, K. Hall, & E. Masad (Eds.), Excellence and impact of research at texas A&M University of Qatar (pp. 97-114). Texas A&M University.
- Fanchi, J. R., & Christiansen, R. L. (2016). Introduction to petroleum engineering. Wiley.
- Feygin, M., & Satkin, R. (2004). The oil reserves-to-production ratio and its proper interpretation. Natural Resources Research, 13(1), 57–17. https://doi.org/10.1023/B:NARR.0000023308.84994.7f
- Fleming, N., Ramstad, K., Eriksen, S. H., Moldrheim, E., & Johansen, T. R. (2007). Development and implementation of a scale-management strategy for Oseberg Sør, SPE-100371-PA. SPE Production & Operations, 22(3), 307–317. https://doi.org/10.2118/100371-MS
- Ghorashi, S., & Monghad, L. (2015). Condensate banking effect on productivity in the wet gas reservoir and finding an optimum method to mitigate this effect- case study. Petroleum and Coal, 57(4), 396–402.
- Höök, M. (2009). Depletion and Decline Curve Analysis in Crude Oil Production [ Licentiate thesis, Uppsala University]. Department for Physics and Astronomy, Uppsala University.
- Höök, M., Davidsson, S., Johansson, S., & Tang, X. (2014). Decline and depletion rates of oil production: A comprehensive investigation. Philosophical Transactions of the Royal Society A, 372(2006), 20120448. http://dx.doi.org/10.1098/rsta.2012.0448
- Höök, M., Söderbergh, B., Jakobsson, K., & Aleklett, K. (2009). The evolution of giant oilfield production behavior. Natural Resources Research, 18(1), 39–56. https://doi.org/10.1007/s11053-009-9087-z
- Hyne, N. H. (2014). Dictionary of petroleum exploration, drilling & production (2nd) ed.). PennWell.
- Jakobsson, K., Söderbergh, B., Höök, M. & Aleklett, K. (2009). How reasonable are oil production scenarios from public agencies?. Energy Policy, 37(11), 4809–4818. http://dx.doi.org/10.1016/j.enpol.2009.06.042
- Jongkittinarukorn, K., Last, N., Escobar, F. H., & Srisuriyachai, F. A. (2021). A straight-line DCA for a gas reservoir. Journal of Petroleum Science and Engineering, 201, 108452. https://doi.org/10.1016/j.petrol.2021.108452
- Khanal, A., Khoshghadam, M., & Lee, W. J. (2016). Accurate forecasting of liquid rich gas condensate reservoirs with multiphase flow, URTeC 2426222, Unconventional Resources Technology Conference, San Antonio, 1-3 August. SPE.
- Kuntadi, A. (2004). North Field, Qatar: A Study of Condensate Blockage and Petroleum Streams Management. M. Sc. Thesis, Norwegian University of Science and Technology.
- Lang Weaver, J. (2011). Unitization of oil and gas fields in texas. In V. Authors (Ed.), A study of legislative, administrative, and judicial policies. Resources for the future library collection. energy policy (Vol. 9). RFF Press.
- Levorsen, A. I. (2001). Geology of Petroleum (2nd) ed.). AAPG Foundation.
- Liu, H., Cui, Y., Liu, L., Jiang, Q., & Yang, H. (2020). Production decline analysis method for fractured gas well in sunlige tight gas reservoir based on arps decline model. In: J. Lin (Ed.), Proceedings of the International Field Exploration and Development Conference 2019 SSGG pp. 337–349. Springer, Singapore
- Liu, J., Tang, H., Guo, P., Shilun, L., & Jianfen, D. (2003). Experimental research for discriminating the type of gas reservoir in surlige field. In Natural gas industry. Elsevier (on behalf of Sichuan Petroleum Administration).
- Marangoni, M. (2005). Completion engineering. In G. Altieri (Ed.), Encyclopaedia of hydrocarbons (Vol. I, pp. 425–449). Marchesi Grafiche Editoriali S.p.A.
- Masoud, R. M., & Surja, D. O. (2007). Detection of oil/condensate droplets in a gas reservoir. GeoArabia, 12(1). https://doi.org/10.2113/geoarabia1201135
- Miller, N. (2009). Increasing Well Productivity in Gas Condensate Wells in Qatar’s North Field, M.Sc. thesis, Texas A&M University.
- Mireault, R., & Dean, L. (2008). Reservoir engineering for geologists. Canadian Society of Petroleum Geologists, Fekete Associates Inc.
- Mommer, B. (2010). La Cuestión Petrolera (3rd) ed.). Fondo Editorial Darío Ramírez PDVSA.
- Murtha, J. (2006). Some challenges for monte carlo simulation. The Way Ahead, 02(2), 13–18. https://doi.org/10.2118/0206-013-TWA
- Okoro, L., Okoh, A., Bose Ekeinde, E., & Dosunmu, A. (2019). Reserve estimation using decline curve analysis for boundary-dominated flow dry gas wells. Arabian Journal for Science and Engineering, 44(6), 6195–6204. https://doi.org/10.1007/s13369-019-03749-2
- Okotie, S., & Ikporo, B. (2018). Reservoir engineering. Fundamentals and applications. Springer.
- Omer, A. I. E. (2009). An integrated framework for optimisation of oil field production area [ PhD thesis], Sheffield Hallam University. Sheffield Hallam University.
- Pérez Rodriguez, S. (2006). Field production forecast based on monte carlo simulation. memoirs of the SPE ATW (advanced technical workshop) key technologies to create more value from mature fields (pp. 1–21). Society of Petroleum Engineers.
- Pérez Rodriguez, S. (2013a). Methodology and equations of mineral production forecast —Part I. Crude Oil in the UK and Gold in Nevada, USA. Prediction of late stages of production. Open Journal of Geology, 3(5), 352–360. https://doi.org/10.4236/ojg.2013.35040
- Pérez Rodriguez, S. (2013b). Methodology and equations of mineral production forecast. Part II. The fundamental equation. Crude oil production in USA. Open Journal of Geology, 3(6), 384–395. https://doi.org/10.4236/ojg.2013.36044
- Pérez Rodriguez, S. (2019). Lessons learned from a shale gas hallmark well in the eagle ford formation: The case of the well emergente-1, the First shale gas well in Mexico. GCAGS Transactions, 69(1), 685–707.
- Pérez Rodriguez, S. (2020). Modeling and forecasting complex patterns of mineral production. Gold mining in Canada. Cogent Engineering, 7(1), 1–16. https://doi.org/10.1080/23311916.2020.1724849
- Pérez Rodriguez, S. (2021). Numerical modelling of artisanal and small-scale mining production. International Journal on Emerging Technologies, 12(2), 213–220.
- Poston, S. W., & Poe, B. D., Jr. (2008). Analysis of production decline curves. Society of Petroleum Engineers.
- Pukite, P., Coyne, D., & Challou, D. (2019). Mathematical geoenergy. Discovery, depletion, and renewal.
- Raza, A., Gholami, R., Wheaton, R., Rabiei, M., Rasouli, V., & Rezaee, R. (2019). Primary recovery factor as a function of production rate: Implications for conventional reservoirs with different drive mechanisms, energy sources Part A recovery. Utilization, and Environmental Effects, 41(22), 2778–2785. https://doi.org/10.1080/15567036.2019.1576073
- Sagnaliyeva, G. (2016). Modeling of the Degirmenkoy Underground Gas Storage Field. M.Sc. thesis, Istanbul Technical University, Graduate School of Science Engineering and Technology.
- Sanni, M. (2018). Petroleum engineering: Principles, calculations, and workflows. Wiley.
- Satter, A., & Iqbal, G. M. (2016). Reservoir engineering, the fundamentals, simulation, and management of conventional and unconventional recoveries. Gulf Professional Publishing.
- Söderberg, B. (2010). Production from Giant Gas Fields in Norway and Russia and Subsequent Implications for European Energy Security. PhD thesis, Uppsala University.
- Temizel, C., Tuna, T., Oskay, M. M., & Saputelli, L. A. (2019). Formulas and calculations for petroleum engineering. Elsevier.
- Terry, R. E., & Rogers, J. B. (2015). applied petroleum reservoir engineering (3rd) ed.). Prentice hall.
- Thakur, P. (2017). Advanced reservoir and production engineering for coal bed methane. Gulf Professional Publishing.
- Whitson, C. H., & Kuntadi, A. (2005). Khuff gas condensate development. IPTC 10692. International Petroleum Technology Conference, Doha, 21-23 November. AAPG.
- Yergin, D. (2012). The prize. The epic quest for oil, money & power. Simon & Schuster.
- Zhuang, H., Sun, H., & Liu, X. (2020). Dynamic well testing in petroleum exploration and development. Elsevier.
- Zimmerman, R. W. (2018). The Imperial College lectures in petroleum engineering Volume 5: fluid flow in porous media. World Scientific Publishing.