
 ?Mathematical formulae have been encoded as MathML and are displayed in this HTML version using MathJax in order to improve their display. Uncheck the box to turn MathJax off. This feature requires Javascript. Click on a formula to zoom.
Abstract
The COVID19 pandemic has significantly affected the performance of the transport sector and its overall intensity. Reduced mobility has a large impact on the number of road accidents. The aim of this study is to forecast the number of road accidents in Poland and to assess the impact of the COVID19 pandemic on the variation in road crashes. For this purpose, day-wise historical crash data from 2011 onwards have been collected and analysed. Based on real historical field data, the future has been forecasted for both pandemic and nonpandemic variants. Forecasting of the number of accidents has been carried out using selected time series models and exponential models. Based on obtained data, it can be stated that pandemic resulted in a decrease in number of road accidents in Poland with ranges of reduction varying from 11% to 30% based on different days of week. Most visible decrease is observed on 3 days viz. Monday, Wednesday, and Saturday. Further, the projections show that in view of the current situation one may expect further decrease in the number of road accidents in Poland.
1. Introduction
Road accidents are incidents that cause not only injury or death to road users, but also material damage. According to World Health Organization (WHO) data, about 1.3 million people die every year as a result of road accidents. In most countries, road accidents take up an average of 3% of their gross domestic product (GDP). Road accidents are the leading cause of death for minors and young people aged between 5–29 years (WHO. The Global status on road safety, Citation2018). The UN General Assembly has set an ambitious target of halving the number of deaths and injuries from road accidents by 2030 with respect to the numbers in 2018.
The extent of a road accident is an attribute to determine the severity of the accident. Predicting accident severity is crucial for relevant authorities while developing transport safety policies to eliminate accidents, reduce injuries, fatalities and property damage (Tambouratzis et al., Citation2014; Zhu et al., Citation2019). Identification of critical factors affecting accident severity is a prerequisite for developing countermeasures to eliminate and mitigate accident severity (Arteaga et al., Citation2020). Yang et al. (Citation2022) proposed a multi-node Deep Neutral Network (DNN) to predict different levels of severity of injury, death and property loss. According to the authors, DNN technique allows for a comprehensive and accurate analysis of the severity of road accidents.
There are several sources of accident data. Most commonly, they are collected and analysed by government authorities through relevant government agencies. Data are collected through police reports, insurance databases or hospital records. Partial information on road accidents is then processed for the transport sector on a larger scale (Gorzelanczyk et al., Citation2020).
Intelligent transport systems are currently the most important source of data related to road accident analysis and forecasting. This data can be processed through the use of GPS devices in vehicles (Chen, Citation2017). Roadside vehicle detection microsystems can continuously record vehicle data (speed, traffic volume, vehicle type, etc.; Khaliq et al., Citation2019). A vehicle number plate recognition system also enables the collection of large amounts of traffic data over a monitored period of time (Rajput et al., Citation2015). Social media can be another source of traffic and accident data, but its accuracy may be insufficient due to the incompetence of reporters (Zheng et al., Citation2018).
To ensure the relevance of accident data, it is necessary to work with several data sources, which are needed to be confronted appropriately. Combining different data sources by consolidating heterogeneous road accident data helps in increasing the accuracy of analysis results (Abdullah & Emam, Citation2016).
A statistical study to assess the severity, finding the relationship between road accidents and road users was conducted by Vilaça et al. (Citation2017). The result of the study is a suggestion to improve road safety standards and adopt other policies related to transport safety.
Bąk et al. (Citation2019) conducted a statistical study of road safety in a selected region of Poland based on the number of road accidents, and attempted to learn various causes for the causes of road accidents. Their study used multivariate statistical analysis to examine safety data on those responsible for missing.
The choice of accident data source for analysis depends on the type of traffic problem being addressed. The combination of statistical models with other natural driving data or other data obtained through intelligent transport systems contributes to the accuracy of accident forecasts and contributes to the elimination of accidents (Chand et al., Citation2021).
Different methods for forecasting the number of accidents can be found in the literature. Most commonly, time series methods are used to forecast the number of road accidents (Helgason, Citation2016; Lavrenz et al., Citation2018), the disadvantages of which are the inability to assess the quality of the forecast based on expired forecasts and the often-occurring autocorrelation of the residual component (Forecasting based on time series, Citation2022). Procházka et al. (Citation2017) utilized the multiple seasonality model for forecasting and Sunny et al. (Citation2018) used the Holt-Winters exponential smoothing method (Sunny et al., Citation2018). The drawbacks of these methods include the inability to introduce exogenous variables into the model (Dudek, Citation2013; Szmuksta-Zawadzka & Zawadzki, Citation2009).
A vector autoregression model is used to forecast the number of road accidents, whose limitation is the requirement of a large number of observations of the variables in order to correctly estimate their parameters (Wójcik, Citation2014). While forecasting the number of road accidents in the vector autoregression model, the major limitation faced is the requirement of a large number of points in order to correctly conduct the estimation of the parameters (Wójcik, Citation2014). Monederoa et al. (Citation2021) have also successfully used the autoregression models to predict the number of fatalities. Similarly, Boom’s regression models have been used by Al-Madani (Citation2018). These models require one single-line connection (Mamczur Citation2022, Piłatowska, Citation2012).
Biswas et al. (Citation2019) used Random Forest regression to predict the number of road accidents. In another study, the data contain groups of correlated features with similar significance to the original data, where smaller groups are favoured over larger groups (Random forest, Citation2022), and there is instability in the method and spike prediction (Fijorek et al., Citation2010). Chudy-Laskowska and Pisula (Citation2014) used the following in the prediction problem under discussion: an autoregressive model with quadratic trend, a model with univariate periodic trend and an exponential equalization model. A moving average model can be used for the prediction of the discussed issue; however, the disadvantages of the technique are low prediction accuracy, loss of data in the sequence, lack of consideration of trends and seasonal effects (Kaszpruk, Citation2010). Prochozka and Camej used the GARMA method. In this method, some restrictions are imposed in the parameter space to guarantee the stationarity of the process (Prochazka & Camaj, Citation2017). Very often, the ARMA model for a stationary process or ARIMA or SARIMA for a non-stationary process is used for forecasting (Dutta et al., Citation2020; Karlaftis & Vlahogianni, Citation2009; Procházka et al., Citation2017; Sunny et al., Citation2018). This results in very high flexibility of the discussed models, but it is also their disadvantage, as good model identification requires more experience from the researcher than, for example, regression analysis (Łobejko, Citation2015). Another disadvantage is the linear nature of the ARIMA model (Dudek, Citation2013).
Chudy-Laskowska and Pisula (Citation2015) used the ANOVA method to forecast the discussed issue. The disadvantage of this method is the adoption of additional assumptions, in particular the assumption of sphericity, the violation of which may lead to erroneous conclusions (CitationRoad safety assessment handbook). Neural network models are also used to predict the number of road accidents. The disadvantages of the model used are the need for experience in this field (Chudy-Laskowska & Pisula, Citation2014; Wrobel, Citation2017) and the dependence of the final solution on the initial conditions of the network, as well as the lack of interpretability in the traditional way (CitationData mining techniques StatSoft).
A new prediction method is the use of Hadoop model by Kumar et al. (Citation2019). The disadvantage of this method is its inability to work with small data files (Top Advantages and Disadvantages of Hadoop, Citation2022). Karlaftis and Vlahogianni (Citation2009) used the Garch model for prediction. The disadvantages of this method are its complex form and complicated model (Fiszeder, Citation2009; Perczak & Fiszeder, Citation2014). On the other hand, McIlroy and his team used the ADF test (McIlroy et al., Citation2019), which has the drawback of poor power in the case of autocorrelation of the random component (Muck, Citation2022).
Various researchers (Li et al., Citation2017; Shetty et al., Citation2017) have also used Data-Mining techniques for forecasting, which usually have the disadvantage of huge sets of general descriptions (Marcinkowska, Citation2015). One also encounters the combination of models proposed by Sebego et al. (Citation2008) as a combination of different models. Parametric models were also proposed in the work of Bloomfield (Citation1973).
Given the above analysis, the purpose of this study is to forecast the number of road accidents in Poland and to assess the impact of the COVID-19 pandemic on the variability of road accidents. For this purpose, daily historical accident data since 2011 were collected and analyzed. Based on actual historical field data, forward-looking forecasts were made for both the pandemic and non-pandemic variants. Selected time series models and exponential models were used to forecast the number of accidents.
2. Materials and methods
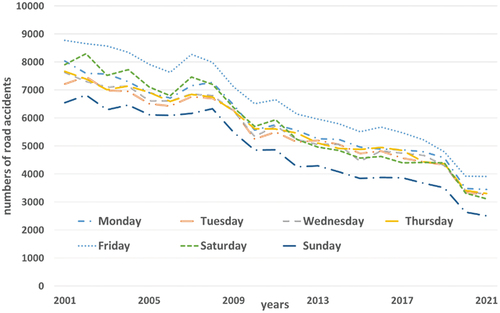
The number of road accidents on Polish roads is decreasing year by year. Based on the day of crash occurrence, it is observed that the drop in accidents is more than 60% on Saturdays and Sundays. Further, day-wise fluctuations and variations in the number of crashes are also recorded with a decreasing trend. However, when compared with the European Union, the number of accidents is still very high in Poland. Next, when the accidents happened during pandemic are observed, a drop in the number of road crashes is observed. As compared to 2019, 23% less road crashes have been recorded in 2020. Figure graphically represents the trend in road crashes in Poland over the years across 7 days of a week.
Figure 1. Comparison of the number of accidents in Poland from 2001–2021.
Selected exponential alignment models were used to forecast the number of road accidents by day of the week. The essence of these methods is that the time series of the forecast variable is pronounced with a weighted moving average and the weights are determined according to the exponential function. These weights were optimally selected by the Statistica software in which the analysis was conducted. The forecast in this case is based on a weighted average of the current and historical series. The result of the forecast using this method depends on the choice of the model and its parameters. Forecasting the number of accidents in Poland was carried out using selected time series models.
The following errors of expired forecasts determined from Equationequations (1(1)
(1) –Equation5
(5)
(5) ) were used to calculate measures of analytical forecasting perfection:
ME—mean error
MAE—mean average error
MPE—mean percentage error
MAPE—mean absolute percentage error
SSE—Error Sum of Squares
where:
n—the length of the forecast horizon,
Y—observed value of road accidents,
Yp—forecasted value of road accidents.
In order to compare the number of accidents during a pandemic and if it did not exist, the mean percentage error was minimized.
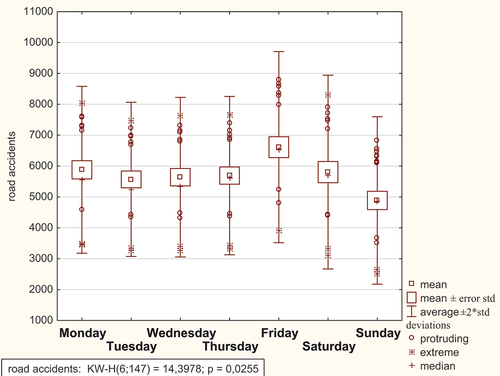
The day-wise variation in the number of road accidents was tested by conducting a Kruskal-Wallis test. The value of the test statistic is 14.4 with test probability p < 0.05. The value states that according to the hypothesis, equality of the average level of road accidents should be rejected. This means that the number of accidents we are dealing with, is exhibiting a systematic decrease in the average level of accidents over the years. Further, day-wise there is a marked variation among the crashes as is presented in Figure . Figure clearly reveals that the highest number of road accidents takes place during the weekend, on Friday and Saturday. This is due to increased traffic on weekends which propels a high number of road accidents. Sundays exhibit least number of road crashes as the workplaces are closed on that day leading to less traffic flow on roads.
Figure 2. Comparison of the average number of road accidents in Poland by days of the week in 2001–2021.
Selected time series models were used for further analysis to forecast the number of road accidents.
3. Forecasting the road accidents
Data from the Polish Police from 2001 to 2021 were used to forecast the weekly number of accidents. To examine the role of pandemic on the number of road accidents in Poland, the study was divided into two timelines:
From the end of 2011 to 2021 (with pandemic), and
From the end of 2011 till the end of 2019 (without pandemic)
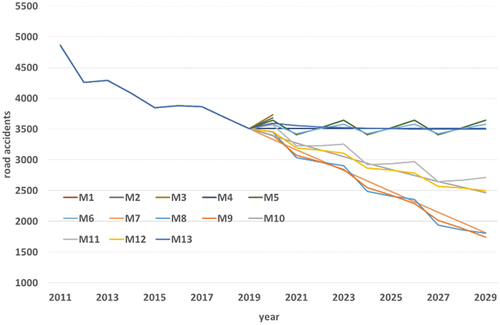
The study assumes that the beginning of the pandemic is 2020, due to the lack of statistics from the police on the number of road accidents by days of the week and breakdown by months. The day-wise forecasting results of the study where the effect of pandemic is included (upto 2021) are shown in Figures . Similarly, the day-wise crash forecasting without considering the data from pandemic (upto 2019) is shown in Figures . The various forecasting methods used in the study are coded as M1, M2, …, Mn. The various forecasting techniques used for the study are as follows.
Figure 3. Forecasting the number of road accidents on Monday from 2022–2031.
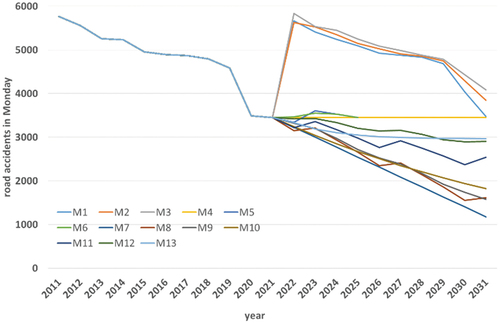
Figure 4. Forecasting the number of road accidents on Tuesday from 2022–2031.
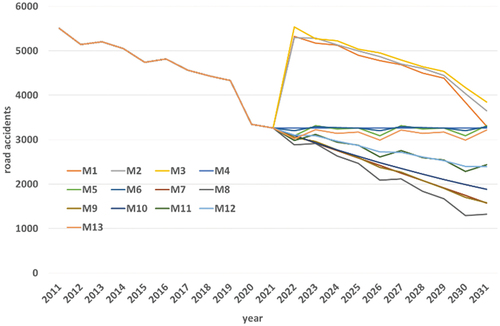
Figure 5. Forecasting the number of road accidents on Wednesday from 2022–2031.
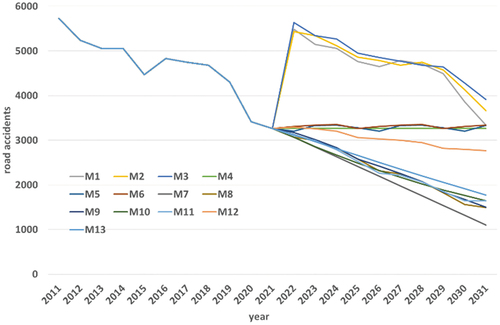
Figure 6. Forecasting the number of road accidents on Thursday from 2022–2031.
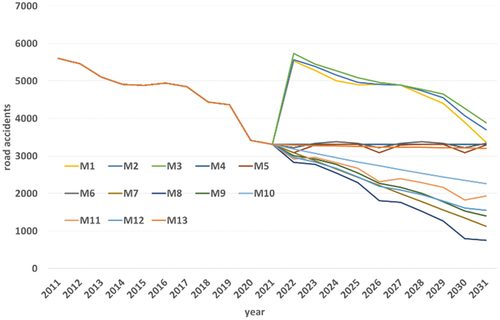
Figure 7. Forecasting the number of road accidents on Friday from 2022–2031.
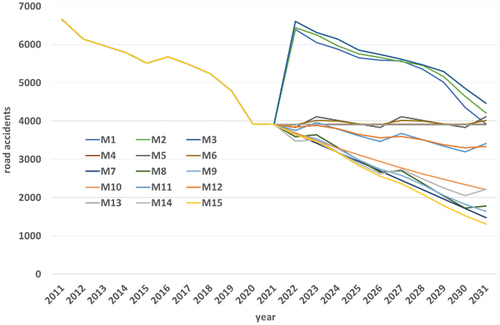
Figure 8. Forecasting the number of road accidents on Saturday in 2022–2031.
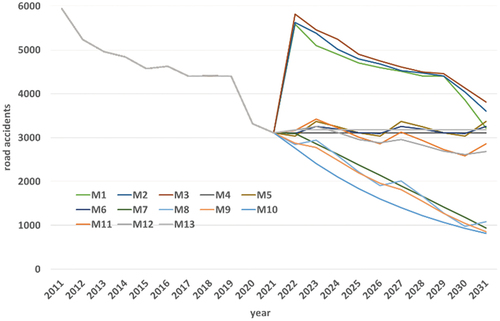
Figure 9. Forecasting the number of road accidents on Sunday from 2022–2031.
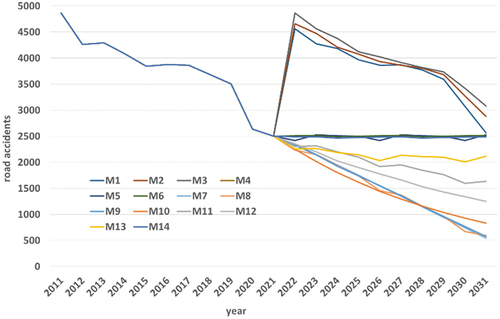
Figure 10. Forecasting the number of road accidents on Monday from 2020–2029 if there was no pandemic.
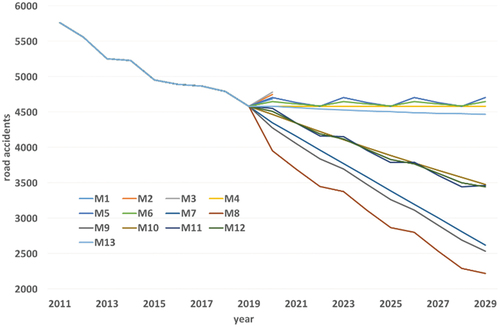
Figure 11. Forecasting the number of road accidents on Tuesday from 2020–2029 if there was no pandemic.
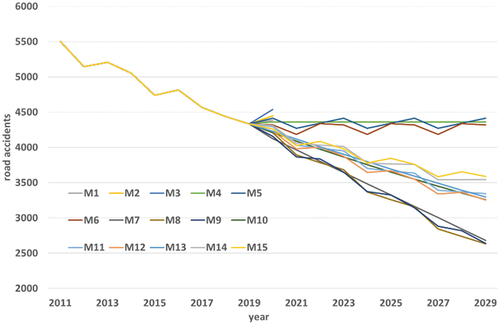
Figure 12. Forecasting the number of road accidents on Wednesday from 2020–2029 if there was no pandemic.

Figure 13. Forecasting the number of road accidents on Thursday from 2020–2029 if there was no pandemic.
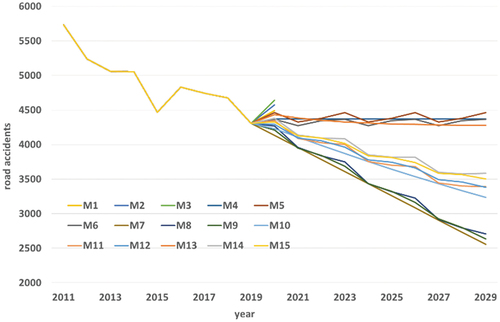
Figure 14. Forecasting the number of road accidents on Friday from 2020–2029 if there was no pandemic.
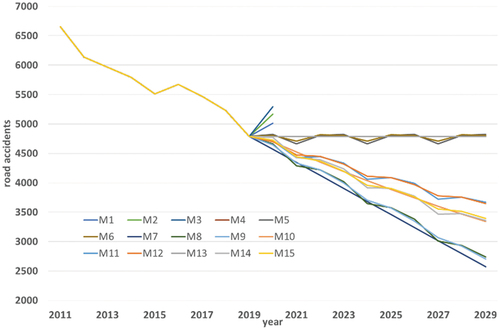
Figure 15. Forecasting the number of road accidents on Saturday from 2020–2029 if there was no pandemic.
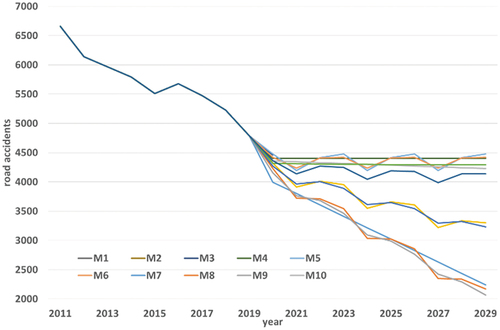
Figure 16. Forecasting the number of road accidents on Sunday from 2020–2029 if there was no pandemic.
M1—moving average method 2-points,
M2—moving average method 3-points,
M3—moving average method 4-points,
M4—exponential smoothing no trend seasonal component: none,
M5—exponential smoothing no trend seasonal component: additive,
M6—exponential smoothing no trend seasonal component: multiplicative,
M7—exponential smoothing linear trend seasonal component: none Holt,
M8—exponential smoothing linear trend seasonal component: additive,
M9—exponential smoothing linear trend seasonal component: multiplicative Winters,
M10—exponential smoothing exponential seasonal component: none,
M11—exponential smoothing exponential seasonal component: additive,
M12—exponential smoothing exponential seasonal component: multiplicative,
M13—exponential smoothing fading trend seasonal component: none,
M14—exponential smoothing fading trend seasonal component: additive,
M15—exponential smoothing fading trend seasonal component: multiplicative)
4. Results
The charts below show the results of forecasting the number of road accidents in Poland by pandemic and day of the week (Table ). For Monday, the projected number of traffic accidents from 2022 to 2031, changes for 2022 from 3148 for M8 to 5839—M3. For the last analyzed period, 2031, the value of the number of traffic accidents changes from 1175—M7 to 4080—M3. As can be seen in this case, moving average methods should not be used. The difference between the minimum and maximum results is more than 350%. For the weekday studied, the smallest MAPE error value was observed for the M7 method (Figure ).
Table 1. Forecasting results
On the next analyzed date, the projected number of traffic accidents from 2022 to 2031, changes for 2022 from 2880 for M8 to 5539—M3. For the last analyzed period, 2031, the value of the number of traffic accidents changes from 1319—M8 to 3844—M3. As can be seen in this case, moving average methods should not be used. The difference between the minimum and maximum results is more than 291%. For the studied day of the week, the smallest MAPE error value was observed for the M9 method (Figure ).
For Wednesday, the projected number of traffic accidents from 2022 to 2031, changes for 2022 from 3064 for M8 to 5638—M3. For the last analyzed period, 2031, the value of the number of traffic accidents changes from 1102—M7 to 3914—M3. As can be seen in this case, moving average methods should not be used. The difference between the minimum and maximum results is more than 355%. For the weekday studied, the smallest MAPE error value was observed for the M7 method (Figure ).
On Thursday, the projected number of traffic accidents from 2022 to 2031, changes for 2022 from 2827 for M8 to 5735—M3. For the last analyzed period, 2031, the value of the number of traffic accidents changes from 749—M8 to 3885—M3. As can be seen in this case, moving average methods should not be used. The difference between the minimum and maximum results is more than 518%. For the day of the week studied, the smallest MAPE error value was observed for the M7 method (Figure ).
On Friday, the projected number of traffic accidents from 2022 to 2031, changes for 2022 from 3471 for M14 to 6604—M3. For the last analyzed period, 2031, the value of the number of traffic accidents changes from 1312—M15 to 4463—M3. As can be seen in this case, moving average methods should not be used. The difference between the minimum and maximum results is more than 340%. For the weekday studied, the smallest MAPE error value was observed for the M7 method (Figure ).
On Saturday, the projected number of traffic accidents from 2022 to 2031, changes for 2022 from 2762 for M10 to 5813—M3. For the last analyzed period, 2031, the value of the number of traffic accidents changes from 813—M10 to 3809—M3. As can be seen in this case, moving average methods should not be used. The difference between the minimum and maximum results is more than 340%. For the weekday studied, the smallest MAPE error value was observed for the M7 method (Figure ).
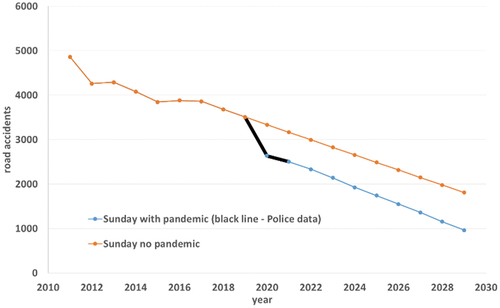
On Sunday, the projected number of traffic accidents from 2022 to 2031, changes for 2022 from 2231 for M8 to 4866—M3. For the last analyzed period, 2031, the value of the number of traffic accidents changes from 542—M7 to 3081—M3. As can be seen in this case, moving average methods should not be used. The difference between the minimum and maximum results is more than 568%. For the studied day of the week, the smallest MAPE error value was observed for the M9 method (Figure ).
On Monday, not including the pandemic, the projected number of road accidents from 2022 to 2029 changes for 2020 from 3956 for M8 to 4786—M3. For the last period analyzed, 2029, the value of the number of traffic accidents changes from 2225—M7 to 4825—M3. As can be seen in this case, moving average methods should not be used. The difference between the minimum and maximum results is more than 216%. For the weekday studied, the smallest MAPE error value was observed for the M12 method (Figure ).
On Tuesday, not including the pandemic, the projected number of road accidents from 2022 to 2029 changes for 2020 from 4123 for M7 to 4537—M3. For the last period analyzed, 2029, the value of the number of traffic accidents changes from 2634—M8 to 4758—M3. As can be seen in this case, moving average methods should not be used. The difference between the minimum and maximum results is more than 181%. For the weekday studied, the smallest MAPE error value was observed for the M11 method (Figure ).
On Wednesday, not including the pandemic, the projected number of traffic accidents from 2022 to 2029 changes for 2020 from 4130 for M7 to 4639—M3. For the last period analyzed, 2029, the value of the number of traffic accidents changes from 2558—M7 to 4875—M3. As can be seen in this case, moving average methods should not be used. The difference between the minimum and maximum results is more than 190%. For the weekday studied, the smallest MAPE error value was observed for the M10 method (Figure ).
On Thursday, not including the pandemic, the projected number of road accidents from 2022 to 2029 changes for 2020 from 4178 for M7 to 4651—M3. For the last period analyzed, 2029, the value of the number of traffic accidents changes from 2589—M7 to 4862—M3. As can be seen in this case, moving average methods should not be used. The difference between the minimum and maximum results is more than 187%. For the weekday studied, the smallest MAPE error value was observed for the M14 method (Figure ).
On Friday, not including the pandemic, the projected number of road accidents from 2022 to 2029 changes for 2020 from 4568 for M7 to 5292—M3. For the last period analyzed, 2029, the value of the number of traffic accidents changes from 2573—M7 to 5190—M3. As can be seen in this case, moving average methods should not be used. The difference between the minimum and maximum results is more than 201%. For the weekday studied, the smallest MAPE error value was observed for the M9 method (Figure ).
On Saturday, not including the pandemic, the projected number of road accidents from 2022 to 2029 changes for 2020 from 3995 for M7 to 4477—M5. For the last period analyzed, 2029, the value of the number of traffic accidents changes from 2066—M9 to 4477—M5. The difference between the minimum and maximum results is more than 217%. For the studied day of the week, the smallest MAPE error value was observed for the M12 method (Figure ).
On Sunday, not including the pandemic, the projected number of road accidents from 2022 to 2029 changes for 2020 from 3333 for M7 to 3732—M3. For the last period analyzed, 2029, the value of the number of traffic accidents changes from 1740—M9 to 3645—M3. As can be seen in this case, moving average methods should not be used. The difference between the minimum and maximum results is more than 210%. For the weekday studied, the smallest MAPE error value was observed for the M7 method (Figure ).
Based on the results of the conducted research by the inclusion of pandemic, it can be concluded that the number of forecasted road accidents at the end of analysis period of 2031 varies between 542 to 4117 across all days which depends on the usage of specific forecasting technique. Further, results are evident that the number of road accidents in Poland will decrease over years.
To compare the number of road accidents depending on the day of the week during pandemic and had there been no pandemic, the number of road accidents was forecasted based on various forecasting techniques, for which the average percentage error is the smallest. The following methods were selected as the best forecasting methods for various days.
Presence of pandemic: Monday—M7, Tuesday—M9, Wednesday—M7, Thursday—M7, Friday—M7, Saturday—M7, Sunday—M9.
Absence of pandemic: Monday—M12, Tuesday—M11, Wednesday—M10, Thursday—M14, Friday—M9, Saturday—M12, Sunday—M7.
Based on the research, it can be concluded that the estimated number of road accidents in Poland for the year 2029 varies from 740.30 to 4824.00, depending on the method and day of the week. Based on the presented research results, it can be concluded that the number of road accidents in Poland will decrease year over year on each day of the week.
5. Discussion
The forecasted number of road accidents in 2020 on each day of the week was compared with the actual number of road accidents reported by the police (Statistic Road Accident, Citation2022). These data are presented in Figures . Based on the obtained data, it can be concluded that the pandemic caused a decrease in the number of road accidents in Poland by 11% to 30% depending on the days of the week. This reduction is most evident on Monday, Wednesday, and Saturday. For individual days it is as follows:
Figure 17. Comparison of number of road accidents in Monday with and without pandemic (presence of pandemic—M7, absence of pandemic—M12).
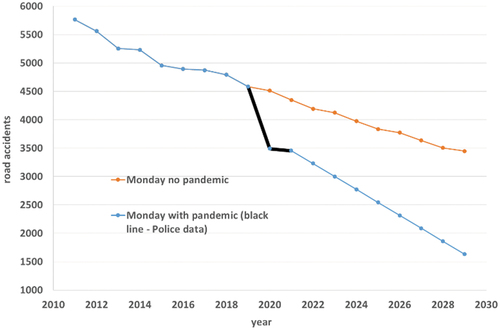
Figure 18. Comparison of number of road accidents in Tuesday with and without pandemic (presence of pandemic—M9, absence of pandemic—M11).
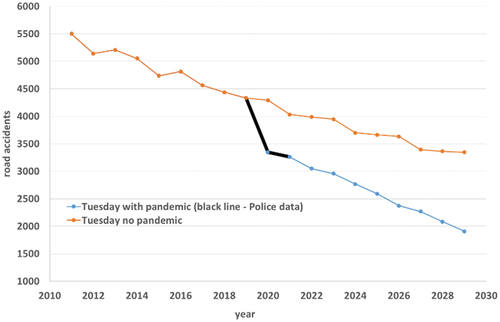
Figure 19. Comparison of number of road accidents in Wednesday with and without pandemic (presence of pandemic—M7, absence of pandemic—M10).
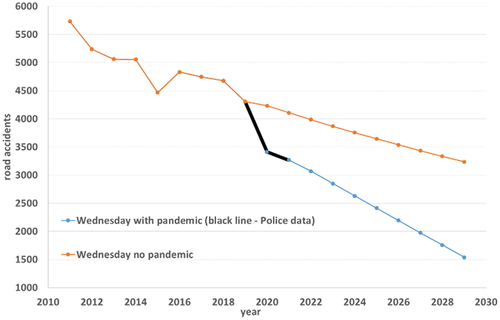
Figure 20. Comparison of number of road accidents in Thursday with and without pandemic (presence of pandemic—M7, absence of pandemic—M15).
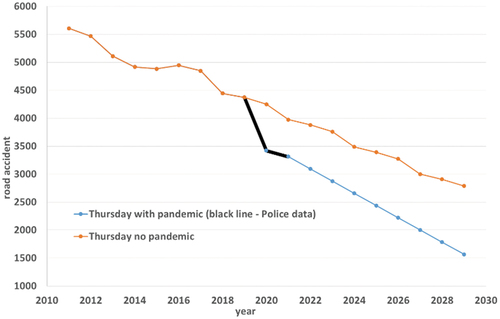
Figure 21. Comparison of number of road accidents in Friday with and without pandemic (presence of pandemic—M7, absence of pandemic—M9).
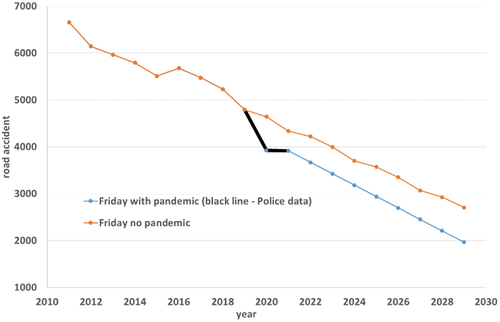
Figure 22. Comparison of number of road accidents in Saturday with and without pandemic (presence of pandemic—M7, absence of pandemic—M12).
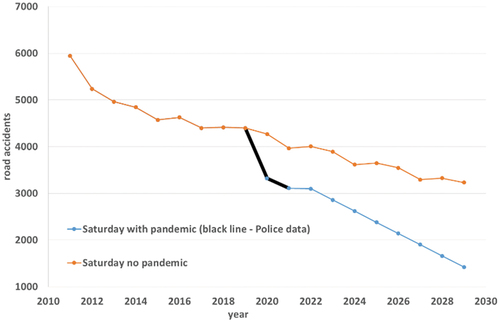
Figure 23. Comparison of number of road accidents in Sunday with and without pandemic (presence of pandemic—M9, absence of pandemic—M7).
Monday—29%,
Tuesday—23%,
Wednesday—29%,
Thursday—22%,
Friday—11%,
Saturday—30%,
Sunday—24%.
As we can see, the smallest difference is on the day when the highest number of traffic accidents occur.
In the next step, taking into account formulas 1–5, measurement errors were determined for the projected number of traffic accidents (Table ). Due to the popularity of the MAPE error, its value was used for further analysis. The study assumed the following criteria for MAPE error (Lewis, Citation1982):
<10%—Highly accurate forecasting,
10%-20%—Good forecasting,
20%-50%—Reasonable forecasting,
> 50%—Inaccurate forecasting.
Table 2. Summary of errors
Based on this, the above assumptions, it can be concluded that in most cases the measurement error is at a high level. In contrast, only in two cases it is reasonable. The value of the error varied in the range: 1.64%-38.74%. Its average value with pandemic was 14.51%, while without pandemic it was 8.47%. Based on this, it can be concluded that the received values of forecasts are at a high level.
6. Conclusion
The day-wise forecasting of the number of accidents in Poland was determined using the exponential equalization method with Statistica software. The applied weights were estimated by the program in such a way as to minimize the mean absolute error and the mean absolute percentage error.
Based on the obtained results, it can be concluded that the pandemic caused a reduction in the number of road accidents in Poland. The range of reduction varies between 11% to 30% depending on the day for which forecasting is conducted. Based on the current situation, further reduction in the number of road accidents in Poland can be expected which might be comparable with number of accidents in EU.
Moreover, based on analysis of the obtained results it can be stated that the forecasts of the number of road accidents in Poland for the coming years show a decreasing trend, especially due to the arrival of COVID-19 virus pandemic. The calculated forecast errors prove the accuracy of the used models. Another remarkable finding from the analysis is that variation of crashes is observed for different days of a week. Moreover, based on the day for which forecasting is conducted, specific types of forecasting technique prove to be more accurate.
The forecasts of the number of road accidents obtained in the article may be used in the future to formulate further actions aimed at minimizing the number of accidents in the countries under study. These actions may consist, for example, in introducing higher penalties for traffic offences on Polish roads from beginning of 2022. In further research, the authors plan to consider more factors affecting the level of accidents in Poland. These may include traffic density, weather conditions or the age of the accident perpetrator.
Acknowledgements
This publication was created thanks to support under the Operational Program Integrated Infrastructure for the project: Identification and possibilities of implementation of new technological measures in transport to achieve safe mobility during a pandemic caused by COVID-19 (ITMS code: 313011AUX5), co-financed by the European Regional Development Fund.
Disclosure statement
No potential conflict of interest was reported by the author(s).
Additional information
Funding
References
- Abdullah, E., & Emam, A., Traffic accidents analyzer using big data, in: Proc. - 2015 int. conf. comput. sci. comput. intell. CSCI 2015, institute of electrical and electronics engineers Inc, 2016: pp. 392–22. https://doi.org/10.1109/CSCI.2015.187.
- Al-Madani, H. (2018). Global road fatality trends’estimations based on country-wise microlevel data, accid. Accident Analysis & Prevention, 111(2018), 297–310. https://doi.org/10.1016/j.aap.2017.11.035
- Arteaga, C., Paz, A., & Park, J. (2020). Injury severity on traffic crashes: A text mining with an interpretable machine-learning approach saf. Science, 132. https://doi.org/10.1016/j.ssci.2020.104988
- Bąk, I., Cheba, K., & Szczecińska, B. (2019). The statistical analysis of road traffic in cities of Poland. Transportation Research Procedia, 39, 14–23. https://doi.org/10.1016/j.trpro.2019.06.003
- Biswas, A. A., Mia, J., & Majumder, A. (2019) Forecasting the Number of Road Accidents and Casualties using Random Forest Regression in the Context of Bangladesh July 2019 Economics 10th International Conference on Computing, Communication and Networking Technologies (ICCCNT)
- Bloomfield, P. (1973). An exponential model in the spectrum of a scalar time series. Biometrika 60 217–226 https://www.jstor.org/stable/2334533.
- Chand, A., Jayesh, S., & Bhasi, A. B. Road traffic accidents: An overview of data sources, analysis techniques and contributing factors, Materials today: Proceedings. Volume 47, Part 15, 2021. 5135–5141. 2214-7853, https://doi.org/10.1016/j.matpr.2021.05.415.
- Chen, C. Analysis and forecast of traffic accident big data ITM web conference, 12 (2017), p. 04029, https://doi.org/10.1051/itmconf/20171204029
- Chudy-Laskowska, K., & Pisula, T. (2014). Forecast of the number of road accidents in Poland. Logistics, 6. http://yadda.icm.edu.pl/yadda/element/bwmeta1.element.baztech-5f2d4da1-bd53-4662-be23-4eea5c08aa96
- Chudy-Laskowska, K., & Pisula, T. (2015). Prognozowanie liczby wypadków drogowych na Podkarpaciu. Logistics, 4. https://www.researchgate.net/publication/316596821_Prognozowanie_liczby_wypadkow_drogowych_na_Podkarpaciu
- Data mining techniques StatSoft. https://www.statsoft.pl/textbook/stathome_stat.html?https%3A%2F%2Fwww.statsoft.pl%2Ftextbook%2Fstdatmin.html
- Dudek, G. (2013). Exponential smoothing models for short-term power system load forecasting. Energy Market, 3(106). http://yadda.icm.edu.pl/yadda/element/bwmeta1.element.baztech-d5fe006d-c182-451c-ac79-a5f4f908ce79
- Dudek, G. (2013). Forecasting time series with multiple seasonal cycles using neural networks with local learning. In L. Rutkowski, M. Korytkowski, R. Scherer, R. Tadeusiewicz, L. A. Zadeh, & J. M. Zurada, (Eds.), Artificial intelligence and soft computing, ICAISC 2013. Lecture Notes in Computer Science (Vol. 7894). Springer, Berlin, Heidelberg. https://doi.org/10.1007/978-3-642-38658-9_5
- Dutta, B., Barman, M. P., & Patowary, A. N. (2020). Application of arima model for forecasting road accident deaths in India. International Journal of Agricultural and Statistical Sciences, 16(2), 607–615. https://www.researchgate.net/publication/348349751_APPLICATION_OF_ARIMA_MODEL_FOR_FORECASTING_ROAD_ACCIDENT_DEATHS_IN_INDIA
- Fijorek, K., Mróz, K., Niedziela, K., & Fijorek, D. (2010). Forecasting electricity prices on the day-ahead market using data mining methods energy market 12. https://www.cire.pl/pliki/2/prognozowanie_cen_rdn.pdf
- Fiszeder, P. (2009). GARCH class models in empirical financial research. scientific publishers of the nicolaus copernicus university.
- Forecasting based on time series. (2022) http://pis.rezolwenta.eu.org/Materialy/PiS-W-5.pdf
- Gorzelanczyk, P., Pyszewska, D., Kalina, T., & Jurkovic, M. (2020). Analysis of road traffic safety in the Pila poviat. Scientific Journal of Silesian University of Technology. Series Transport, 107(33), 52. 0209-3324. https://doi.org/10.20858/sjsutst.2020.107.3
- Helgason, A. (2016). Fractional integration methods and short time series: Evidence from a simulation study. Political Analysis, 24(1), 59–68. https://doi.org/10.1093/pan/mpv026
- Karlaftis, M., & Vlahogianni, E. (2009). Memory properties and fractional integration in trans-portation time-series. Transportation Research Part C: Emerging Technologies, 17(4), 444–453. https://doi.org/10.1016/j.trc.2009.03.001
- Kashpruk, N. (2010). Comparative research of statistical models and soft computing for identification of time series and forecasting. Opole University of Technology. https://dbc.wroc.pl/Content/108023/Praca%20Doktorska_%20Nataliia%20Kashpruk_popr.pdf
- Khaliq, K. A., Chughtai, O., Shahwani, A., Qayyum, A., & Pannek, J. (2019). Road accidents detection, data collection and data analysis using V2X communication and edge/cloud computing. Electronics, 8(8), 896. https://doi.org/10.3390/electronics8080896
- Kumar, S., Viswanadham, V., & Bharathi, B. (2019). Analysis of road accident. IOP Conference Series: Materials Science and Engineering, 590(1), 012029. https://doi.org/10.1088/1757-899X/590/1/012029
- Lavrenz, S., Vlahogianni, E., Gkritza, K., & Ke, Y. (2018). Time series modeling in traffic safetyresearch. Accident Analysis & Prevention, 117, 368–380. https://doi.org/10.1016/j.aap.2017.11.030
- Lewis, C. (1982). Industrial and business forecasting methods: A practical guide to exponential smoothing and curve fitting. Butterworth Scientific
- Li, L., Shrestha, S., & Hu, G. (2017). Analysis of road traffic fatal accidents using data mining techniques. IEEE 15th international conference on software engineering research, management and applications (SERA), pp. 363–370, https://doi.org/10.1109/SERA.2017.7965753.
- Łobejko, S. (2015). Time series analysis and forecasting with SAS. Main business school in Warsaw. https://docplayer.pl/21098378-Analiza-i-prognozowanie-szeregow-czasowych-z-programem-sas.html
- Mamczur, M. Machine learning How does linear regression work? And is it worth using? https://miroslawmamczur.pl/jak-dziala-regresja-liniowa-i-czy-warto-ja-stosowac/
- Marcinkowska, J. (2015). Statistical methods and data mining in assessing the occurrence of syncope in the group of narrow-QRS tachycardia (AVNRT and AVRT). Medical University of Karol Marcinkowski in Poznań. http://www.wbc.poznan.pl/Content/373785/index.pdf
- McIlroy, R. C., Plant, K. A., Hoque, M. S., Wu, J., Kokwaro, G. O., Nam, V. H., & Stanton, N. A. (2019). Who is responsible for global road safety? A cross-cultural comparison ofactor maps. Accident Analysis & Prevention, 122, 8–18. https://doi.org/10.1016/j.aap.2018.09.011
- Monederoa, B. D., Gil-Alanaa, L. A., & Martínezaa, M. C. V. (2021, October). Road accidents in Spain: Are they persistent? IATSS Research, 45(3), 317–325. https://doi.org/10.1016/j.iatssr.2021.01.002
- Muck, J. Econometrics. Modeling of time series. Stationary. Unit root tests. ARDL models. Co-integration. http://web.sgh.waw.pl/~jmuck/Ekonometria/EkonometriaPrezentacja5.pdf
- Perczak, G., & Fiszeder, P. (2014). GARCH model - using additional information on minimum and maximum prices. Bank and Credit, 2.
- Piłatowska, M. (2012). The choice of the order of autoregression depending on the parameters of the generating model. Econometrics, 4(38). https://dbc.wroc.pl/Content/22753/Pilatowska_Wybor_Rzedu_Autoregresji_w_Zale%C5%BCnosci_Od_Parametrow.pdf
- Prochazka, J., & Camaj, M. Modelling the number of road accidents of uninsured drivers and their severity. Proceedings of International Academic Conferences 5408040, International Institute of Social and Economic Sciences. 2017
- Procházka, J., Flimmel, S., Čamaj, M., & Bašta, M. (2017). Modelling the Number of Road Accidents. Publishing house of the University of Economics in Wrocław. https://doi.org/10.15611/amse.2017.20.29
- Rajput, H., Som, T., & Kar, S. (2015). An automated vehicle license plate recognition system Computer. Long Beach California, 48, 56–61. https://doi.org/10.1109/MC.2015.244
- Random forest. (2022) https://pl.wikipedia.org/wiki/Las_losowy
- Road safety assessment handbook. https://www.iung.pl/PJA/wydane/11/PJA11_3.pdf
- Sebego, M., Naumann, R. B., Rudd, R. A., Voetsch, K., Dellinger, A. M., & Ndlovu, C. (2008). The impact of alcohol and road traffic policies on crash rates in Botswana, 2004–2011: A time-seriesanalysis. Accident Analysis & Prevention, 70(2008), 33–39. https://doi.org/10.1016/j.aap.2014.02.017
- Shetty, P., Sachin, P. C., Kashyap, V. K., & Madi, V. (2017). Analysis of road accidents using data mining techniques. International Research Journal of Engineering and Technology, 04. https://www.sciencepubco.com/index.php/ijet/article/download/15626/6532
- Statistic Road Accident. (2022). https://statystyka.policja.pl/
- Sunny, C. M., Nithya, S., Sinshi, K. S., Vinodini, V. M. D., Lakshmi, A. K. G., Anjana, S., & Manojkumar, T. K. Forecasting of Road Accident in Kerala: A Case Study. Environmental Science, Computer Science. 2018 International Conference on Data Science and Engineering (ICDSE). https://doi.org/10.1109/ICDSE.2018.8527825
- Szmuksta-Zawadzka, M., & Zawadzki, J. (2009). Forecasting on the basis of Holt-Winters models for complete and incomplete data. Research papers of the Wrocław University of Economics, No. 38. https://www.dbc.wroc.pl/Content/15648/Szmuksta-Zawadzka_Zawadzka_O_prognozowaniu_na_podstawie_modeli.pdf
- Tambouratzis, T., Souliou, D., Chalikias, M., & Gregoriades, A. (2014). Maximising accuracy and efficiency of traffic accident prediction combining information mining with computational intelligence approaches and decision trees. Journal of Artificial Intelligence and Soft Computing Research, 4(1), 31–42. https://doi.org/10.2478/jaiscr-2014-0023
- Top Advantages and Disadvantages of Hadoop 3 DataFlair. (2022). https://data-flair.training/blogs/advantages-and-disadvantages-of-hadoop/
- Vilaça, M., Silva, N., & Coelho, M. C. (2017). Statistical analysis of the occurrence and severity of crashes involving vulnerable road users. Transportation Research Procedia, 27, 1113–1120. https://doi.org/10.1016/j.trpro.2017.12.113
- WHO. The Global status on road safety. (2018). 403. https://www.who.int/publications/i/item/9789241565684
- Wójcik, A. (2014). Autoregressive vector models as a response to the critique of multi-equation structural econometric models (Vol. 193). Publishing house of the University of Economics in Katowice.
- Wrobel, M. S. Application of neural fuzzy systems in chemistry. PhD thesis. University of Silesia. 2017.
- Yang, Z., Zhang, W., & Feng, J. (2022). Predicting multiple types of traffic accident severity with explanations: A multi-task deep learning framework. Safety Science, 146(2022), 105522. 0925-7535. https://doi.org/10.1016/j.ssci.2021.105522
- Zheng, Z., Wang, C., Wang, P., Xiong, Y., Zhang, F., Lv, Y., & Chen, P. (2018). Framework for fusing traffic information from social and physical transportation data. PLoS One, 13, e0201531. https://doi.org/10.1371/journal.pone.02015318
- Zhu, L., Lu, L., Zhang, W., Zhao, Y., & Song, M. (2019). Analysis of accident severity for curved roadways based on Bayesian networks. Sustainability. 11(8), 2223. https://doi.org/10.3390/su11082223