
 ?Mathematical formulae have been encoded as MathML and are displayed in this HTML version using MathJax in order to improve their display. Uncheck the box to turn MathJax off. This feature requires Javascript. Click on a formula to zoom.
Abstract
Road authorities are committed to improving community infrastructure through Bus Rapid Transit (BRT) projects. Yet, these initiatives often disrupt traffic, as seen in the Amman BRT project. A study assessed traffic conditions during various stages to address these disruptions, including simulated BRT operations. The research collected data on traffic volume, travel time, delays, and transit ridership before, during, and after construction and after BRT operations began. As a case study, the study focused on the impact of Amman’s first mass transit system at the Yajouz intersection. Traffic volumes decreased by 28% during construction, reducing delays significantly from 118.03 to 91.04 seconds. Although average speeds increased slightly (one km/h, on average), travel time doubled, negatively impacting 84% of businesses due to considering alternative routes for traveller destinations. However, delays significantly reduced after construction to 58 seconds per vehicle despite the higher traffic volume. Traffic simulations during construction underestimated observed delays (53.5 seconds per vehicle vs. 73.7 seconds per vehicle), still indicating a Level of Service (LOS) E. In BRT operation, modelled delays (55.8 seconds per vehicle) were lower than observed (63.8 seconds per vehicle), maintaining same LOS level. BRT minimally impacted ridership, an expected outcome given its trial phase. Environmental assessments revealed emissions peaking during construction, with a 25% modal shift to BRT yielding the lowest emissions. The study stresses sustainable urban mobility, advocating for meticulous planning, adaptable policies, and public awareness, emphasizing the need for detailed pedestrian research in this context.
1. Introduction
Congestion in cities is a serious problem in developing and developed countries. Urbanization dominates the world and exacerbates this problem. Meeting the needs and activities of ever-growing communities, cities, and other urban areas requires more travel. Developing the economy and human resources relies heavily on transport, but that should not come at the expense of the environment. Sustainable mobility concepts should be integrated into urban planning schemes to achieve sustainable development goals (SDG) 11 that address making cities and human settlements inclusive, safe, resilient, and sustainable. Governments worldwide focus on safe, affordable, and accessible public transportation systems to improve them. Jordan has imported most of its energy needs over the years, making energy bills challenging for governments. According to the Jordanian Ministry of Transportation, 49% of energy was used in the transportation sector in 2018. As a result of the absence of a well-organized public transportation system in Jordan and Amman, the capital city with 4.5 million people residing in an area of 800 km2 and an estimated five million trips per day, automobile dependency contributes to the seriousness of the problem. A Transport and Mobility Master Plan (TMMP) was developed by the Greater Amman Municipality (Greater Amman Municipality [GAM], Citation2010) to improve mobility within the city. Currently, only 14% of journeys are transit-based. The target is to increase that to 40% by 2025.
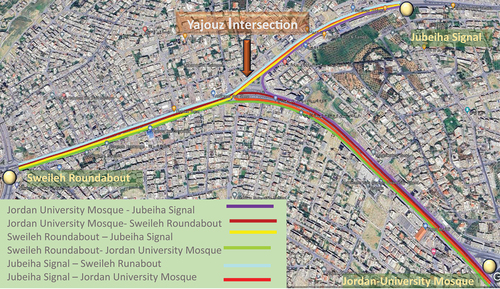
The municipality launched a consultancy service to provide a design for Amman BRT; the plan includes designing, constructing, and operating 33 km of Bus Rapid Transit (BRT). The project’s first stage will be 25 km long, with a capacity of 6,600 passengers per direction per hour, divided into two corridors. The construction work of the 184 million US$ project was split into five implementation packages based on the implementation year. In 2011, a pilot project was completed along Queen Rania Street (QRS), one of the city’s major arterials. After political and administrative issues halted work for a couple of years, it was restarted in 2014 and took seven more years to complete. A lengthy construction period was perceived negatively. There was a lot of media coverage about the project because of public concerns about its viability and impact on business and interests. As illustrated in Figure , the proposed system consists of dedicated bus lanes separated from general traffic by 25 km and divided into two lines (16 km for line 1 and 9 km for line 2).
Figure 1. Amman BRT routes (GAM, Citation2021).
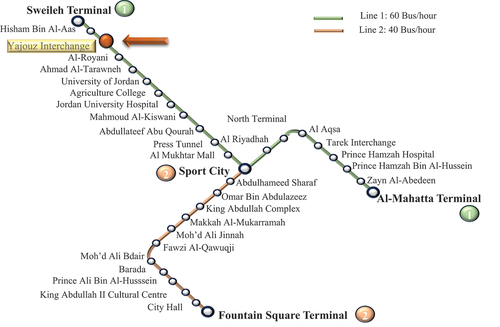
The system is expected to carry 300,000 passengers daily upon completion and operation. According to the plans, the fleet will have 150 buses (Imam et al., Citation2020). Yajouz intersection is studied as a case study, one of the intersections along line 1, which serves BRT and feeder buses (Figure ).
The study focuses on the Yajouz intersection as a case study. This intersection was converted from an at-grade to a grade-separated intersection to accommodate two dedicated BRT lanes. BRT operations are expected to increase transit ridership, reduce private car use, and reduce the negative environmental impact of transport. Traffic studies are often conducted to evaluate the impact of work zones. This study examines the facility’s performance from pre-construction to post-completion, including short- and long-term operations, and it is not intended to be a macro-simulation. The study aims to be inclusive in evaluating the impact of the project. Among the indicators are traffic flow mix, turning movements, travel time, speed, and delay. Assessing the early BRT operation will involve analyzing short-term effects and long-term changes in user travel behaviour. It examines the transit ridership, environmental impact, traffic flow, mix, speed, and delay across various construction and operation stages, comparing pre-construction conditions to assess the impact of construction on intersection performance indicators during construction, completion, and operation. The public transport ridership will be explored for all tested scenarios starting from before construction until the full-service operation and materializing of the city modal split target. The analysis also aims at evaluating and quantifying the environmental effects of the work zone and improvement schemes on vehicles’ emission of greenhouse gas (CO2), such as Hydrocarbon (HC), nitrogen oxides (NOx), and fuel consumption for all stages of operation. The study also considers the impact on travellers and business owners interviewed about the construction work. By understanding how the facility operates, highway agencies can plan similar projects more effectively.
2. Literature review
Sustainable approaches are imperative during project planning and implementation. BRT systems play a crucial role in sustainable transportation. The construction work may cause traffic disruptions with serious economic and environmental consequences, even if it only lasts for a short period. However, this could be offset by the long-term benefits provided by a BRT system, such as an increase in ridership, a reduction in emissions, and a mode shift. Let alone the intersection improvement schemes expected to enhance traffic conditions and the environment. The study objectives were addressed by reviewing some studies, including traffic simulations.
2.1. Sustainability BRT system and ridership
BRT, characterized by modern vehicles, exclusive lanes, and intelligent transportation systems (ITS) technologies applications, is considered a cost-effective approach to providing a high‐quality, sustainable transport service. A review of BRT development across the globe up to 2010 showed that appropriately designed and operated BRT systems offer an innovative approach to providing a high‐quality transport service comparable to a rail service but at a relatively low cost and short implementation time and offer significant effects on land development (Deng & Nelson, Citation2011). The impact of ITS technology on the first fully functional BRT system in Beijing was examined in terms of technical performance, operational efficiency, and cost concerns. Particular attention is given to the consequential impacts of BRT on travel behavior change, the traffic environment, and property development. The early performance of BRT suggested that it is one of the most effective ways of promoting sustainable mobility, while some challenges remain (Deng & Nelson, Citation2013). Several strategies to support BRT implementation in developing Asian cities, such as integrating paratransit into BRT systems as feeders along a BRT corridor to provide demand, have been evaluated by applying demand forecasting and emission modeling to the Bangkok Metropolitan Administration’s BRT project plan. It was revealed that the paratransit system feeder and other strategies proposed could enhance BRT system performance. This would improve traffic network conditions and air pollution emissions (Satiennam et al., Citation2006).
A comparative analysis of ridership changes in King County, Washington, reveals that implementing BRT routes led to significant increases in ridership compared to the routes that continued conventional bus services, either planned or operational BRT. Ridership on BRT routes increased by 35% from 2010 to 2013, surpassing traditional bus routes and 29% in 2014 (Stewart et al., Citation2017). A study on 13 Chinese cities covered physical characteristics, technical performance, and operational issues. The study found that Chinese BRT systems had moderate performance, with a peak hour ridership of 5,874 passengers and a speed of 20.2 km/h. Compared to BRT systems in Latin American cities, Chinese BRT systems operate at similar speeds but carry fewer passengers (Deng et al., Citation2013). In 2007, Istanbul’s first BRT system was introduced, and the line has been extended several times. Upon completion of the fourth phase in 2012, the BRT line stretched over 51.3 km, carrying 600,000 passengers daily. Positive public reception resulted in a noticeable surge in user numbers (Yazici et al., Citation2013). The literature review considers ridership and the challenges associated with full corridor implementation instead of gradual BRT development in U.S. and Canadian cities. High-productivity bus corridors in different contexts using general transit feed specification data were compared by developing longitudinal and cross-sectional sketch models, offering insights into the relative impact of BRT features and external factors. Transit ridership was positively correlated with frequent service, improved reliability, signal priority, and dedicated lanes. The review concluded that building political momentum for sustained improvements in bus networks is a challenge. Using emerging data sources to compare incremental BRT projects allows for a better understanding of incremental BRT development projects (Stewart et al., Citation2015).
2.2. Construction work: traffic and safety impact
A literature search was conducted to identify best practices for improving worker and road user safety in work zones. The review included regulatory and management issues and technical issues such as establishing work zones, informing and warning road users, guiding traffic flow, managing speed, and protecting workers and users (Varhelyi, Citation2018). Mashhadi et al. (Citation2021) critically reviewed different approaches to estimating work zone capacities in construction. The review examined geometric, traffic, and environmental impacts from the perspective of safety and mobility. A study of 179 papers on work zone crashes, data analysis, and modelling over five decades (1962–2015) was reviewed, with 81 most relevant studies thoroughly examined. The study showed that work zone is likely to increase crash rates and distribution, with rear-end crashes being the most common. There is no consensus regarding their relationship with other factors, such as weather, victim severity, traffic control devices, and facility type. The most common modelling techniques and approaches are simple, and data limitations challenge researchers (Yang et al., Citation2015). A study of two freeway segments in Houston, Texas, found that heavy vehicles, particularly trucks, affected traffic performance in work zones (capacity). As the percentage of trucks in a given headway increases, the headway lengthens, and capacity decreases (Cunagin & Chang, Citation1982). Saleh et al. (Citation2017) found that increasing traffic loading by 3% in the Banda Aceh of Indonesia flyover construction zone would drop the level of service (LOS) from B to C. Suleiman et al. (Citation2020) found that limiting heavy vehicles and managing lane traffic improved performance in terms of speed and delays.
Driver behavior, infrastructure, and traffic variables were assessed as risk factors associated with critical incidents in the work zone. In a matched case-control study, crash risks in work zones were quantified with odds ratios and binary logistic regression models were developed based on the findings. The results indicate that being involved in a non-driving related secondary task for more than 6 seconds increases the crash and near-crash risk by 5.46 times. In work zones, traffic conditions with LOS “D” have the highest risk of collisions or near-miss crashes (Bharadwaj et al., Citation2019). Other factors influencing the capacity of rural freeway work zones include rainfall and police presence (Venugopal & Andrze, Citation2001). An attempt to assess the safety of freeway work zones using 72 schemes of cellular automata simulations found that traffic conflict count and vehicle operating speed standard deviation reach their maximums when heavy vehicles comprise 40% of the traffic mix under a constant saturation rate. Traffic conflict depends, and vehicle speed standard deviation reaches its maximum when the traffic saturation rate comes to 0.75, after which it declines (Liang et al., Citation2014).
Based on a study methodology applied to 5,006 work zones in Pennsylvania from 2015 to 2017, night-time work zone crashes are much lower than daytime work zone crashes. However, if the annual average daily traffic is less than 10,000 vehicles daily, there is no statistical difference between night and daytime crashes (Zhang et al., Citation2022).
2.3. Intersection improvement: operational conditions
An evaluation of the traffic conditions at signalized intersections on Tudan Road of Miri City, Malaysia, was conducted to determine the effectiveness of upgrading the road from an R3 secondary road to a U5 dual carriageway. To determine the intersections’ LOS, morning and afternoon peak hours were observed and evaluated during construction and after the upgrade. During the weekday morning peak hour operation stage, the LOS improved from F to Level E. During the weekend morning and afternoon peak hours of the construction stage, the LOS improved to C and D. During the weekend peak hours, the LOS further improved to B during the operation stage (Tay & Lee, Citation2018).
As part of redesigning a flyover along the Eastern Expressway in Mumbai, islands were constructed that channel traffic and eliminate one phase of the traffic signal, thus reducing cycle time by 40%. As a result of a microsimulation-based traffic model, the average delay, the average number of stops per vehicle, the average queue length, and the maximum queue length have been calculated, showing significant improvements and demonstrating the effectiveness of the proposed layout (Maji et al., Citation2015). The entropy method determined the best work zone location at a seven-lane main road at a non-aligned T-intersection in Xi’an, China. VISSIM Software was used to evaluate two improvement schemes under different conditions; the best scheme was associated with reducing driving time, delay, and the number of stops by 44%, 66%, and 92%, respectively (Shao et al., Citation2020).
SIDRA Software evaluated a road underpass structure at the Wellosefer intersection in Addis Ababa City. The three improvement alternatives were signalized T-intersections, roundabouts, and road underpasses with roundabouts at the upper level. Before the study, vehicles were delayed on average by 535.7 seconds, and cars were delayed by 574.7 seconds. As a result of the signalized T-intersection, the average delay was reduced by 15.4% (191.4 seconds), and the travel time was reduced by 36.4% (209.7 seconds). In the roundabout alternative, the average delay was reduced by 33.5% (179.9 seconds), while travel time decreased by 32.1% (184.7 seconds). Compared to the Unsignalized T-Intersection, the third alternative showed a significant reduction in the average delay of vehicles of about 42% (Leleisa et al., Citation2018). An Al-Ameer signalized intersection in Samawa city was assessed using a Traffic Synchro-based simulation, which was found to operate to low LOS (F). Various strategies were modeled and tested, with the best solution being an overpass in one direction, improving the LOS by two levels (F to C) (Joni & Hikmatt, Citation2018).
2.4. Intersection improvement: environment impact
Using three scenarios, a study calculated what CO2 emissions would be generated in a medium-sized city in response to the growth in working trips. The scenarios include no-build “relying upon private automobiles,” light rail, and bus rapid transit (BRT) using 40-foot or 60-foot buses. BRT has the most potential for cutting greenhouse gas emissions, as it has fewer per passenger mile. Cities could build more BRT than LRT if capital costs were lower, increasing public transportation use (Vincent & C, Citation2006).
As part of a study investigating the impact of providing a BRT facility in India, the effect of the very limited right-of-way on traffic capacity was mitigated by ending the bus paths at an at-grade signalized intersection at a reasonable distance before the stop line; beyond this, dedicated bus lanes are available to all the motorized vehicular traffic at the intersection. A wide range of operational and environmental indicators was assessed using the micro-simulation tool VISSIM. There was a substantial reduction in average queue length, maximum queue length, average delay time per vehicle, and emissions per vehicle. Meanwhile, the average speed and throughput of all vehicles in the network increased (Sharma et al., Citation2012). A signalized unconventional roundabout on the N6 highway of Ghana, with a signal phase assigned for the major road through traffic, was simulated using VISSIM. This was done to assess capacity, delay, and queue length. The results showed an increase in roundabout capacity by up to 50% in some cases. The delay and queue length were significantly reduced while maintaining safety (Osei et al., Citation2021).
For the Amman Bus Rapid Transit Project (Amman BRT), using electric buses instead of diesel ones and installing photovoltaic systems were evaluated as environmentally friendly measures. Amman BRT’s proposed measures are feasible, with an investment payback of 7.1 years. Capital expenditures (CAPEX) are higher, but operational expenses (OPEX) are lower, resulting in a 32% reduction in total costs. Dalala et al. (Citation2020) reported a reduction in greenhouse gas emissions of 27,203.68 metric tons in 2020. A comparison of diesel buses, hybrids, plug-in hybrids, trolleybuses, and battery-electric buses was conducted for the Amman BRT system. Based on the study, charging the bus is feasible for the trunk route, but hybrids and batteries are not feasible for bus feeder routes. Battery electricity, however, has an advantage over hybrid buses (Imam et al., Citation2020). VISSIM and MOVES were used to evaluate the environmental impact of converting four three-lane roundabouts along a heavily congested urban corridor in Qatar to signalized intersections. Initial results show intersections reduce emissions by 37% to 43%. However, a more detailed study did not demonstrate significant differences between emission rates near both types of controls (Shaaban et al., Citation2019).
3. Methodology
This section presents the methodology used in this study, summarized in Figure . It explains the process of collecting, processing, and analyzing data divided by construction stage and operational scenario.
Figure 2. Study methodology flow chart.
The study considers six scenarios that depict different traffic conditions: before, during, and post-construction and operation. Three additional scenarios were included in the post-stage related to the inclusion of the BRT and the consequence modal shift to the BRT, as will be explained in this section. As a first scenario, the BRT service is accommodated without any modal shift, providing a five-minute headway without any modal shift as part of the trial operation “Soft Opening.” With more frequent service at two-minute headways, the other two scenarios describe a gradual transition from private to public transport with modal shift proportions of 10 and 25%. To increase the share of public transportation from 13% to 40%, the last scenario assumes a 25% reduction in private vehicle transport. Before realizing the end goal, the 10% reduction takes a gradual transition. Data were collected for the four stages of construction and operation. Simulated models with appropriate parameters were used to evaluate the remaining two scenarios
3.1. Study area
This study examines the Yajouz intersection on Queen Rania Street (QRS), which runs 7.2 kilometers in northern Amman and is an eight-lane divided urban arterial street. It was reconfigured to accommodate BRT line 1, consisting of a two-lane section in most sections and a three-lane segment in front of Jordan University (Figure ). Yajouz intersection was a three-leg signalized intersection connecting QRS with road 30, a major east-west route. Three approaches serve all possible traffic movements at this intersection. The intersection was open to traffic during construction, but some turning movements were prohibited (Table ). The intersection’s signal control is fully actuated with a 180-second cycle time. Reconstruction of the Yajouz intersection was part of procurement package three, one of five packages for stage three construction of the BRT implementation plan. During construction, the intersection layout had to be modified to minimize public disturbance and ease traffic flow. However, street narrowing was inevitable since it wasn’t always possible. Approximately 600 meters long, the two-lane bridge provides free maneuvering for eastbound left-turning traffic (from Sweileh towards Jubaiha) from Queen Rania Street to Yajouz Street. From the Yajouz intersection to the Sweileh roundabout, approximately 800 meters, dedicated bus lanes (BRT lanes) were constructed, a transfer station for public transport services, and a bus station for Jubaiha and Shafa Badran.
Figure 3. Yajouz intersection general layout on BRT line 1.
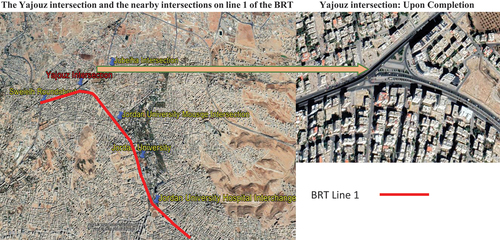
Table 1. Number of lanes by stage and traffic streams
Reconstruction of the Yajouz intersection was part of procurement package three, one of five packages for stage three construction of the BRT implementation plan. During construction, the intersection layout had to be modified to minimize public disturbance and ease traffic flow. However, street narrowing was inevitable since it wasn’t always possible. Approximately 600 meters long, the two-lane bridge provides free maneuvering for eastbound left-turning traffic (from Sweileh towards Jubaiha) from Queen Rania Street to Yajouz Street. From the Yajouz intersection to the Sweileh roundabout, approximately 800 meters, dedicated bus lanes (BRT lanes) were constructed, a transfer station for public transport services, and a bus station for Jubaiha and Shafa Badran.
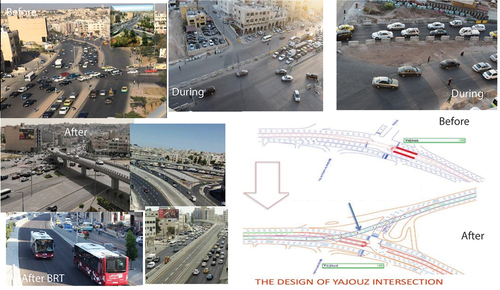
The project’s estimated cost was 5.3 US$ million (GAM, Citation2022), and it took 262 days to implement, including a 52-day extension. The study was motivated by the disruption caused by nearly a year of construction at a bustling intersection, adversely affecting traffic flow, local businesses, and the well-being of nearby residents. At the end of the project, a two-phase actuated signal will control the at-grade intersection. Despite this, a separate phase was added once the BRT service was launched. In 2017, the project was opened to traffic. Four years later, in July 2021, GAM started the first soft or trial BRT operation on the 2nd line. One year later, in August 2022, it began operations on the 1st line. Figure presents the intersection layout before, during, and after construction, including some pictures. Table summarizes the number of lanes dedicated to each traffic stream manoeuvre.
Figure 4. Intersection layout before, during and after construction.
3.2. Data collection
3.1.1. Traffic volume and mix
The count was conducted in working days (two days for each stage) in October 2015, 2016, and 2017 for the before, during, and after, respectively, and November 2022 for the BRT operation scenario supported with monthly archived data. For each traffic stream, classified manual turning 15-minute counts were performed on a typical weekday (Monday) during peak hours (7:30–8:30, 14:00–15:00, and 17:00–18:00). These hours are related to when the work and schools start or end in Jordan. Vehicular traffic was categorized into five classes (Passenger cars, taxis, small buses, large buses, and trucks). Public transport passenger count was conducted on the east-west bound corridor for one peak hour. The average of 10 observed cycles was used to determine the signal cycle time and split.
3.1.2. Speed and travel time
Travel time and delay surveys were conducted to determine the time required to traverse the road sections for all intersection approaches, including the delay and stop time. The test section starts at the nearest intersection and ends at the next. The tested segments shown in Figure were travelled three times by car cruising at the traffic average speed to determine each approach’s average travel time, delay, and average travel speed. A stopwatch method was also used to measure spot speeds for all intersection approaches by dividing the time elapsed to travel 25 meters, representing the space between two light poles, by that predetermined distance.
Figure 5. Test segments for the travel time and speed study.
3.1.3. Environmental data: air quality
Background data on environmental aspects based on real-time data on the air quality index (AQI) from a non-profit international project started worldwide in 2007. The project’s website makes data available for only the last four years (2019–2023), not including the pre-construction stages. Air pollutants collected include particulate matter (PM2.5 and PM10) and nitrogen dioxide (NO2). As opposed to PM2.5, PM10 is a mixture of many chemical species, a complex mixture of solids and aerosols, composed of tiny droplets of liquid, dry solid fragments with liquid coatings with a diameter of 10 microns or less, and PM2.5 with a diameter of 2.5 microns or less. A six-point scale is used to quantify and qualify AQI based on its health implications, as shown in Table . The Jordan Ministry of Environment installed a station near the study area to provide data primarily on PM10 and NO2, feeding real-time data for index calculations. The data were collected from University Street—Sweileh, Amman station (WAQI, Citation2023).
Table 2. Description of air quality index levels
A small sample of subjects was examined to assess site reconstructions, including traffic detours, impacts on individual travel behavior patterns, and businesses. A minimum sample size of 97 observations was determined based on a 95% confidence level with a desired margin of error of 10%. However, this number was increased to 100 interviews, divided into two parts: 50 for students and workers and 50 for business owners.
Short interviews were conducted involving 50 participants divided into two groups, students (24%) and workers (76%), who were asked to reflect on the effect of the construction site (work zone) on their travel patterns. The same subjects were interviewed before and during the construction on a typical weekday (Monday through Wednesday) during the daytime. Subjects in both groups were asked about the travel time they used to reach their destinations (door-to-door) before the start of the construction and the time needed to reach their final destination during the construction. They were asked if they have taken alternative roads to avoid congestion generated due to the construction work on the site. To assess the impact on business owners and the effect of parking restrictions during construction, an additional 50 interviews were conducted with a sample of businesses in the area.
3.3. Traffic modelling simulation
The data were coded and modeled in Synchro (Trafficware, Citation2017) to assess the delay (turning movement, approach, and intersection delays) and related LOS, the queue length (the 50th percentile and the 95th percentile). SIM software was used to evaluate intersection performance by considering some measures of effectiveness, including denied and total delays, average travel speed, density, stop per vehicle, and environmental data (emissions- Carbon Monoxide CO, Nitrogen Oxides, and Hydro Carbone (HC) and fuel consumption). Test scenarios’ results were compared against each other; apart from the last two scenarios related to the BRT, the outcomes of the simulations were also compared to the field observations of speed, travel time, and delay. The appropriate statistical tests were based on data type, hypothesis, and total delay. As a measure of effectiveness, the highway capacity manual defines the average control delay, as shown in Table (Transportation Research Board; National Academies of Sciences, Engineering, and Medicine, Citation2016).
Table 3. The average control delay as a measure of the effectiveness of signalized intersections
The validation of developed models was tested using the Root-Mean Square Percent Error (RMSPE), a measure used to evaluate the model performance. It is usually applicable to test the link/segment volumes, travel times, and travel speeds, and it is calculated as follows:
Where,
S = Simulated Data
O = Observed Data
n = Number of Data Points and i = Observation Point.
The practice in the literature suggests an acceptable range of 5–15%, beyond which there is a need to carry on a significant calibration for the model before it can be applied to test different scenarios (Wisconsin Department of Transport- DoT, Citation2019). Mean absolute error ratio (MAER) as a measure was also used to judge the model validity, and it is defined as follows:
According to the literature, the model is considered “accurate” if the estimates present relative errors ranging between 5% and 15% (Casas et al., Citation2009; Soule et al., Citation2005).
3.1.4. Statistical analysis
The Inferential and descriptive analyses were completed to assess if the tested parameters differ across the tested scenarios that depict the different stages of construction or operational scenarios. The t-test was applied to examine the difference between the two tested parameters (i.e., travel time before and during the construction and the associated delays). The t-test was also applied in the interviews’ analysis to assess the construction work’s social impact. On the other hand, the F-test was used to test if there are differences between three or more tested parameters’ averages or the variances of the tested parameters.
4. Results and findings
The results of the analysis are discussed from different perspectives in this section. It discusses the observed exposure regarding total entry volumes and mixes by construction stage. Furthermore, it presents simulations of observed traffic conditions during and after construction and trial operation and predictions of full-scale operations (two scenarios after construction). A comparison between the observed and modeled or simulated indicators is presented. The environmental impact of tested scenarios and stages of construction is only modeled, and the comparison is limited to that. The social implications based on road users’ and shop owners’ interviews are analyzed and summarized.
4.1. Traffic exposure
4.1.1. Intersection traffic volumes and mixes
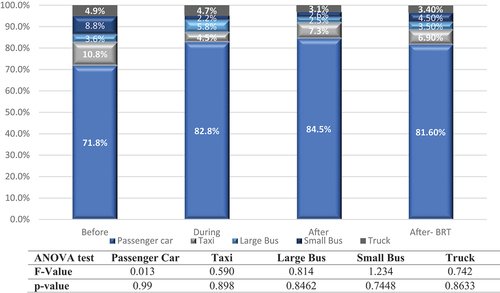
Total entry volume and its mix distribution were analyzed for each construction stage during the afternoon peak hour (14:00–15:00). Before starting the construction, the peak hour traffic volume was 7,192 vehicles per hour, which dropped by 28% during the construction period, and reached 5,162 vehicles per hour. After construction, the traffic level increased to 7,461 vehicles per hour, almost 50 percent more than during construction and slightly higher than before construction (+3.74%). As BRT trial operation started, traffic volume decreased to 7,167 vehicles per hour with a (−3.94%) decrease from after construction. Although the operation began four years after the project was completed, it was anticipated that traffic would grow at a rate of 2%, like the country’s gross domestic product, bringing the traffic volume to 8,076. Still, it decreased by 941 vehicles (−12.62%) compared to what would have been expected.
Figure shows that the percentage of passenger cars increased from 71.8% to 82.8% before construction, increased after construction (84.5%), and slightly decreased with BRT service (81.6%). During construction, the percentage of taxis dropped to half (4.5%), then increased to 7.3% after the construction and remained the same as the BRT service. At the same time, the proportion of large buses remained almost at the same level before and after the construction, and with BRT service (ranges between 2.6% to 3.6%), but not during the construction when it reached 5.8%. From 8.8% before construction to 2.2% during work execution, the number of small buses continued to decline and then increased slightly to 2.6% after construction and almost doubled after the BRT service was implemented. The truck presence during and before the construction remained the same (4.7% to 4.9%) and then dropped to 3.1% and 3.4% after the construction and BRT service operation, respectively, indicating that a small proportion of these trucks were not only site-construction-related. The ANOVA test results suggested that the ratio of each category in the traffic mix is not significantly different due to the construction stage. The statistical analysis shows no statistically significant differences in traffic mix between construction stages and operation scenarios (χ2 = 12.14, p = 0.435).
Figure 6. Intersection total entry volume at by construction stage.
4.1.2. Turning traffic movement volumes and mix
Figure illustrates the distribution of traffic mix by turning movement and construction stage, highlighting changes in the intersection entry volumes. The turning movements were examined primarily because the project had a significant construction component. It involved building a flyover next to the existing exclusive Bus Rapid Transit (BRT) lanes. This flyover was designed to cater to the Exclusive Bus Lane Traffic (EBLT), which had previously experienced severe congestion. The assessment aims to investigate the impact of these improvements on traffic patterns within the facility. It analyses how the enhancements have influenced the flow of vehicles in the area, changing traffic stream directions and magnitudes. It is evident that the proportions of passenger cars increased for all traffic movements during and after construction, while the presence of taxis decreased during construction and increased after completion.
Figure 7. Traffic mix distribution by traffic movement and stage of construction (%).
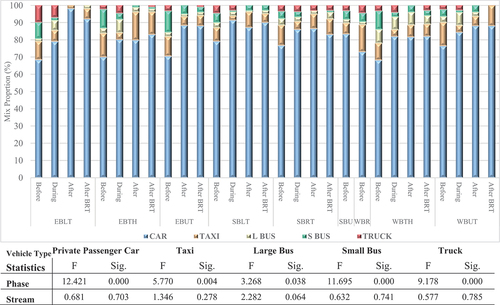
Apart from small passenger cars, other vehicle types presence was more before and to some extent during the construction but less so after the construction, both with and without the BRT service. The change in the traffic mix structure is particularly significant for left-turn traffic. When comparing the proportion of passenger cars before and during the construction, the difference decreased in the post-construction stage compared to the during-construction stage across different directions.
For EBLT, the ratio of private passenger cars increased in the post-construction phase, which can be attributed to the introducing of a flyover that facilitated traffic flow. Conversely, the proportion of private passenger cars decreased by 4.0% for the SBLT compared to the construction phase. This decrease could be due to the new signal timing causing some delays, which may have discouraged taxi drivers’ use of the signal. Furthermore, passenger car traffic in the through traffic streams (EBTH and WBTH) increased compared to the pre-construction stage. After the construction, the proportions almost stabilized, with nearly identical ratios for both traffic streams.
During construction, taxis in the left turn streams (EBLT and SBLT) decreased, and this trend continued after the two-lane flyover was constructed to serve the EBLT. There was a slight increase in the proportion of taxis in the SBLT compared to before construction, but the level did not exceed that observed after introducing the BRT service.
The proportion of taxis in the EBTH mix was higher than in the WBTH. However, their presence in both traffic streams declined during the construction phase to 3.9%. Although the presence of taxis in the WBTH slightly increased after the construction to 6.9%, it remained somewhat lower than the corresponding ratio before construction (9.8%). This was not the case for the EBTH, where the proportion of taxis increased to 16.2% after construction, compared to 13.7% before construction. However, with the introduction of the BRT service, the proportion of taxis in the EBTH decreased to 13%, while it increased for the WBTH to 13.6%.
Small buses accounted for 11% and 10.7% of the traffic in the EBTH and WBTH, respectively. However, their presence dropped to 3.6% during the construction period. It remained low even after the construction and during the BRT operation, with only 1.2% for the EBTH and slightly higher for the WBTH (3.9% and 3% with and without BRT service, respectively).
Bus presence in EBLT is like that in the EBTH traffic stream. However, it is slightly lower with proportions of 9.5%, 1.6%, none, and 2% before, during, and after the construction stages without and with the BRT service, respectively. This is almost triple the presence of buses in the SBLT before construction. After construction, the bus presence in EBLT and SBLT becomes practically equal, with proportions of 3.1%, 2.5%, 0.9%, and 2% before, during, and after construction stages without and with the BRT service, respectively. The traffic mix for the SBRT remained relatively constant during the construction and after-construction stages, which differs from the pre-construction phase.
An ANOVA test was conducted to analyze the differences in the mix due to traffic stream type and construction stage. Due to the construction stage, significant differences were found in the proportions of private passenger cars, taxis, large and small buses, and trucks. However, these proportions did not exhibit significant differences based on the traffic stream, as indicated by the F values and associated significance levels in Figure . Additionally, an analysis was performed to examine the difference in vehicle proportions for each traffic stream based on the construction stage. This disaggregated analysis did not reveal any significant differences, except for small buses in EBTH (F = 1645, p = 0.017) and SBLT (F = 264, p = 0.043), as well as taxis in WBTH (F = 1741, p = 0.017). Furthermore, a paired t-test analysis was conducted to compare the traffic mix between different construction stages. No statistically significant differences were found between any tested pairs, including comparing traffic mix after construction with and without the BRT service.
4.1.3. Public transport ridership
Based on the number of buses and the average number of passengers on board, the total number of passengers was calculated for each scenario. Due to detours in work zones, as shown in Table , the number of passengers on board decreased during construction, which changed the traffic mix since buses accounted for a smaller percentage of traffic. Ridership increased after construction was completed (2017), which took a year to reach only 17 passengers before construction. Parallel to the existing service, BRT began four years after completing the project. Due to a decrease in traffic volume, including buses, passengers slightly increased by 272, compared to those without the service. In general, public transportation ridership decreased, aggravated by the conditions and restrictions caused by COVID-19, which may have also changed demand by making people less likely to take public transportation. BRT runs between EB and WB, and 29 and 33% of passengers used the 5-minute service for EB and WB, respectively. On the non-BRT service, there are an average of 16.5 and 16.7 passengers per bus on the EB and WB, respectively. The corresponding numbers for the BRT service are 13.9 and 14.9 passengers per bus for EB and WB, respectively.
Table 4. Change in public transport ridership over time: peak hourly pax
4.2. Traffic performance: observation-based
4.2.1. Traffic variation within the peak hour
The Peak Hour Factor (PHF) was used to describe the variation within the peak hour. Table showed that traffic before the start of the work was less uniform compared to other stages. It also suggests that the difference between the prevailing conditions during and after the construction with or without the BRT operation is minimal and is proven to be insignificant. The difference was statistically significant when comparing the before versus the after-no BRT construction stages (t = −2.543, p = 0.023). In general, the ANOVA test showed no statistically significant difference in the mean of PHF that can be attributed to the stage of construction (F = −2.153, p = 0.144).
Table 5. Traffic flow parameters’ variation by stage and related statistical analysis
4.2.2. Operating speed
After construction, with the inclusion of the flyover’s operating speed, the average speed is significantly higher than before or during construction. The average speed decreased by 1.94 km/h after the BRT service operation, and the difference between the two speeds is marginally insignificant (t = 1.903, p = 0.058). During construction, the average travel speed differs slightly from before work began. An analysis of the ANOVA test results (Table ) indicates that average travel speeds are not significantly different by construction stage. In addition, the T-test results showed that the average speed before construction differed significantly from the speed after construction with and without the BRT but not if compared to the speed during construction, which was also statistically different from the speed after construction with and without the BRT.
4.2.3. Traffic delay
Travel time delays on the links leading to the intersection (Table ) are not significantly different according to the construction stage or if every two stages are compared. During construction, the delay was 27.26 seconds shorter than before work began. After construction, the delay increased to 20.46 seconds, only 6.8 seconds less than before. The introduction of the BRT service only increased the delay by, on average, one second. Table shows the observed delays for each traffic stream at the intersections within the study area. The construction phase experienced comparatively shorter delays than other construction or operational stages. Such a relatively short delay may be due to the construction site layout, which prohibited specific movements (such as WBUT) at the intersections while facilitating a smooth flow for EBTH. Additionally, the constructed BRT lanes before the start of this project, and because the service was not yet in operation, temporarily opened the Bus Rapid Transit (BRT) lanes to regular traffic, enhancing intersection capacity. Furthermore, specific traffic was rerouted to alternative paths, lowering the overall traffic volume entering the intersection and reducing delays.
After construction, traffic delays decreased in most traffic streams, except for left turn traffic streams (SBLT), which almost equalled construction delays. As shown in Table , the planned improvements have resulted in some performance indicators improving while others worsening for some traffic streams. BRT service reduced the delay for the EBTH and SBRT by half a minute and slightly increased it for other streams (less than 10 seconds). Before the construction, the average traffic delay for the entire intersection was 100.9 seconds per vehicle, compared to 64, 73, and 56 seconds per vehicle during and after construction without and with BRT service. Based on the ANOVA test, most traffic streams did not show any significant differences due to the construction stage; EBTH and WBUT, however, show significant differences
Table 6. Traffic streams’ delay variation by stage and related statistical analysis
4.3. Environmental background data
The data on the AQICN website for a station on University Street-Sweileh Street, one of the intersecting streets at the interchange, provides data starting in 2019 for PM10 and NO2 and only 10 days in 2021 for PM10. Hourly pollution levels are provided. Pollution levels and other environmental data (wind, temperature, humidity, and air pressure) are shown hourly. As shown in Figure , a schematic representation of the data provided is shown along with collected data from 2019–2022 indicating when the BRT trial operation started in phase; in July 2021, line 2 began service, and a year later, in August 2022, line 1 began. Monitoring the hourly variation in pollutant levels shows that it mainly falls in the first level (50), classified as good air quality, with few hours exceeding 50 to be in level two and seldom the PM10 level exceeds level two, the moderate level of air quality, which usually occurs in early hour of the day (6:00–11:00).
Figure 8. Jordan University Street station: Air quality index, location, daily variation, and monthly variation pattern from 2019 to 2022.
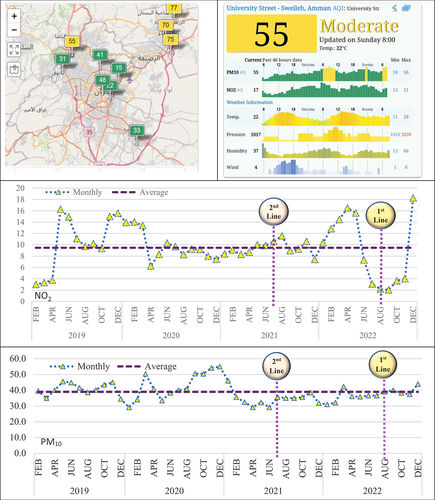
Regarding the long-term air quality index, NO2 averages 9.47 and has a standard deviation 4.9. Annual averages range from 9.19 (2022) to 10.2 (2019), while standard deviations range from 1.17 (2020) to 6.14 (2022). The pattern in 2020 and 2021 appears more uniform, as indicated by their variation around the mean. Due to the COVID-19 lockdown and traffic restrictions, uniformity is most evident between April 2020 and June 2021. As the BRT service started operating in July 2021 and the restrictions were eased, the index increased and reached a high level in April 2022, almost twice the long-term average. After that, it started to decline. In August 2022, when the 1st line service also began to operate, the air quality index decreased, then picked up later, just as it did when the 2nd BRT started to. Although the BRT operation can’t be solely blamed for the change in pattern, it contributes to it.
PM10 Pollutant air quality index over the four years differs from that of NO2, with an average of 39 and a deviation of 6.33, showing a small coefficient of variation (16%). When the COVID-19 lockdown and association restrictions eased and coincided with the start of the BRT service operation, the index value was smaller, and the variance around the mean was also reduced. After the trial operation of BRT line 2 started, the index averaged 36, and it was higher when line 1 started operating (39.8), which was also around the long-term average. The index value was uniform for the first three to four months after the service began, then fluctuated. Again, it would have to attribute the trend only to BRT operation; other contributory factors related to the weather conditions may also influence the index.
4.4. Traffic simulation
4.4.1. Model validation
Synchro 10 software was used to model traffic and assess traffic conditions at different construction stages. This tool enables the researcher to model the operation of BRT once started and test the impact of these operations on the general traffic conditions and different future scenarios once the models are calibrated and proven valid. The analysis considers two scenarios for passenger traffic reduction because of a modal shift (10% and 25%) in the use of bus service, which will be reflected in the traffic mix at the intersection.
Due to the intersection layout that extends over a large area, the diverging right (WBRT) and merging right (SBRT) from and to main traffic streams were treated in the Synchro simulation process as separate nodes. The total entry volume, as a measure of effectiveness (MOE) excluding these two turns, was considered for traffic validation. Ten simulation runs were conducted for an observed hourly volume of 6,731veh/h (Before stage conditions), and the results shown in Table show the RMSPE value of 2.07% is less than 5%, the lower limit of the acceptable range of the valid model that would not need calibration as indicated in section 4.3.
Table 7. Simulated one hour run and the total traffic entry - before construction stage- as measure of effectiveness results
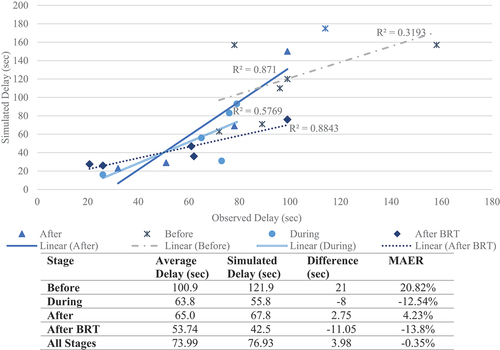
Although traffic delay was not heavily mentioned in the literature as MOE for the validation process, the MAER of the control was calculated for each stage and all stages. As shown in Figure , the accuracy level is satisfactory (less than 15%), with one exception related to the before-construction phase, which exceeds the limit due to human error and field observations. Despite this, the MOE for the same stage indicated above was highly satisfactory, indicating the model’s validity. MAER decreases, resulting in improving the association between observed and simulated models. After-construction data with a BRT service in operation had the highest Pearson correlation (r = 0.94), almost as high as after-construction data without a BRT service (r = 0.93), and before-construction data had the lowest correlation (r = 0.57).
Figure 9. Observed vs simulated delay as MOE validation results.
4.4.2. Traffic performance
4.4.2.1. Traffic delay and modelled vs. Observed LOS
In the simulations, approximately 59% of the modeled stream delays in different stages exhibited the same or worse LOS than the observed field delays. On the other hand, around 41% of the modeled stream delays showed a better LOS, accurately predicting lower delays than the observed delays. On average, there was a delay of 10.7 seconds between predictions that matched the observed LOS and a delay of 54 seconds between predictions that indicated a worsened LOS compared to the observed LOS (refer to Table ). Before construction, the intersection’s observed delay was the highest, measured at 100.9 seconds per vehicle, corresponding to LOS F. The model’s prediction also anticipated the highest delay at this intersection, estimating it to be 121.9 seconds (LOS F). This prediction indicated an overestimation of the observed delay by 20 seconds.
Table 8. The field delay vs modelled delay by stage and traffic streams
During the construction phase, the observed intersection delay reached its lowest point, with values of 63.8 and 55.8 seconds per vehicle for observed and modelled delays, respectively, corresponding to LOS E. There was only an eight-second difference between the observed and modelled delays during this stage. After the construction phase, delays increased to 20.2 seconds per vehicle. Under simulated conditions, the observed delay was measured at 53.5 seconds per vehicle, while the modelled delay was 73.7 seconds per vehicle.
For the Bus Rapid Transit (BRT) scenario, the simulated intersection delays amounted to 67.7 seconds per vehicle, 11.96 seconds per vehicle longer than the observed delays, recorded at 55.7 seconds per vehicle. Traffic simulation generally overestimates the delay of turning traffic streams at intersections (U, right, and left turning traffic). Left-turn traffic streams have the highest predicted delay. The EBTH delay was underestimated in the simulation. The opposite is true for the WBTH, which was overestimated in modelling the before-construction stage.
These statistics show comparable results during and after the construction, confirming the model’s validity. Before construction, however, a higher discrepancy could be attributed to data collection accuracy. Nevertheless, the analysis shows a satisfactory trend for delay prediction; the observed low or high delay values were also modelled as low and high in the same order but with different magnitudes—the modelled delay had a satisfactory correlation with the observed (r = 0.585, p = 0.004). The correlation for each construction stage was insignificant, attributed to the small number of streams included in the analysis for each phase. It was considered satisfactory at the stages of before (r = 0.598, p = 0.287) and after-construction (r = 0.565, p = 0.186). It is highly correlated during construction (r = 0.76, p = 0.136), but the association is for after construction and the inclusion of the BRT service (r = −0.034, p = 0.957).
4.4.2.2. Tested scenarios: modelled delays
The Synchro software was used to model traffic operations for the remaining scenarios, which were two hypothetical traffic conditions describing the case once the BRT service is in the process; hence, data is available for comparison purposes as above. The average control delay for traffic streams of the modelled network based on the tested stages of construction or operation scenarios, as shown in Figure , indicates a high level of delay the traffic used to experience before the commencement of work (121.9 sec/veh). The average control delay during construction drops to less than half of what prevailed before the construction (55.8 sec/veh). After completing the work on-site, the average delay increases to 53.6 sec/veh; it is 68.3 seconds less than before the construction delay. Even though traffic volume at the intersection decreased once BRT began operating, the delay increased to 67.7 seconds per vehicle). Depending on whether a modal shift involves a reduction in private traffic by 10% or 25%, it may drop to 34.5 and 33.14 sec/veh. The ANOVA test results, however, do not indicate a significant difference in delays based on the construction stage (F = 1.03, p = 0.42). Figure illustrates that, before BRT service construction, left-turn traffic experienced the highest delays in both the before and after phases. However, right-turn traffic encountered more delays once the service commenced than the other two traffic streams.
Figure 10. Average modelled delays at the intersections with the study area by stage.
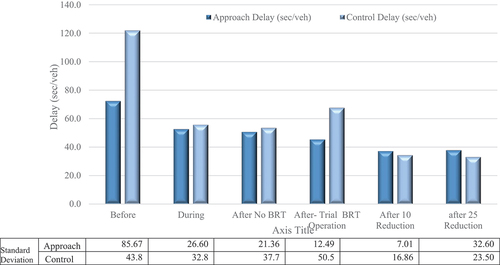
Figure 11. Average modelled traffic stream delays and queue length by stage.
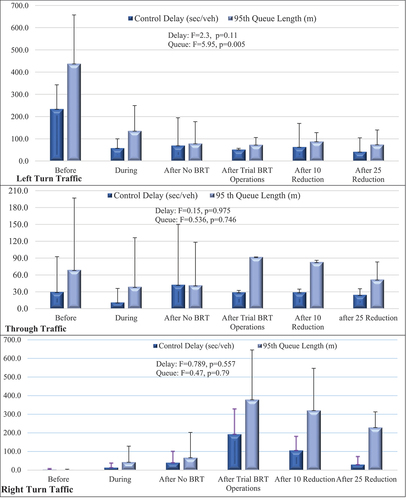
Delays for left and through-bound traffic exhibited similar variation patterns, albeit with different magnitudes depending on the construction stage. Left-turn traffic demonstrated the highest variation in the delay before, during, and after construction, aligning with the modelled delay for each stage. Furthermore, if further modal shifts could be achieved after the service started, right-turn traffic would continue to experience the most substantial delays.
Before construction, left-turning traffic experienced significant delays and long queue lengths. Extra lanes were designated for SBLT during construction, reducing delays and queues. Upon opening, left turn delays notably decreased, especially for EBRT, due to the newly constructed layover, ensuring smooth traffic flow. Under 10% or 25% modal shift scenarios, queue lengths varied marginally from 74 to 87.7 meters. Through bound traffic saw a 62% decrease in delays during construction, while right-turn delays increased sevenfold. Post-construction, right-turn, and through traffic experienced a delay of 40.3 and 42.6 seconds, respectively. Upon BRT service start, delays decreased by 13.45 seconds per vehicle for through traffic streams and more than two minutes for right-turn traffic. Full service and a 10% modal shift would increase delays by 9 seconds for throughbound traffic and continue to drop further for the 25% private car reduction scenario. Queue length fluctuations for through-bound traffic were shorter than left-turn traffic but higher than right-turn traffic in BRT scenarios. After operational activities began, delays for right-turn and through traffic increased due to a new BRT phase, extending cycle time and causing delays.
The variation in queue length differed among the three traffic streams. It was significant for left turn and through traffic in the stages leading up to project completion but decreased after BRT service operation began. Conversely, the variation in queue length was minimal before and during construction, but it increased after project completion and doubled with the commencement of BRT service. However, if a 25% modal shift were achieved, the queue length for all traffic streams would decline to a lower level.
Considering the limited number of streams in each scenario, the results of the ANOVA test indicate that there are no statistically significant differences in control delay or queue length for any movement at the intersection attributable to the construction stage or operation scenario, except for one exception related to the left-turn queue length (F = 5.95, p = 0.005).
4.4.2.3. Tested scenarios: simulated network denied and total delay
The denial of vehicle entry occurred when queues extended to the end of a roadway, resulting in a denied delay. This was simulated for traffic streams at all intersections within the study area using Sim software (refer to Figure ). Before construction, the denied delay was relatively lower due to the intersection layout. However, during and after construction, the denied delay increased as it encompassed longer trips with more intersecting points.
Figure 12. Simulated total and denied delay by stage of construction/operation scenario: sixty-minute simulation.
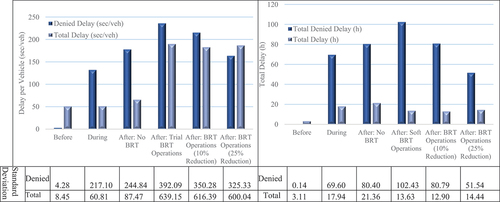
During construction, the denied delay increased by 129 seconds per vehicle. It further increased by 45.7 seconds per vehicle after the completion of the work and by 58.3 seconds per vehicle when the BRT service commenced. However, with a modal shift of 10% and 25% from passenger cars to BRT service, the denied delay decreased by 20.7 and 52 seconds per vehicle, respectively. Depending on the scenario of BRT service operation, the denied delay varied. The average delay across the three scenarios was 204.9 seconds per vehicle, higher than after completion (177.7 seconds per vehicle) and significantly higher than during construction. The simulated total delay, which includes control and queue delays, also exhibited a similar trend.
Before the construction stage, the denied delay constituted only 5.4% of the total delay (50.4 seconds per vehicle). During construction, the denied delay increased to 2.6 times the total delay (50.9 seconds per vehicle), and this further increased to 2.7 times for the completion scenario (65.6 seconds per vehicle). Once the BRT service commenced, the denied delay remained relatively stable (2.6 to 2.62 times) at 89.9 seconds per vehicle, even with a 10% modal shift (82.5 seconds per vehicle). However, if the modal shift increased to 25%, the denied delay accounted for 88% of the total delay (186.6 seconds per vehicle). The ANOVA test results revealed no significant difference in the denied delay based on the stage of construction or the operational scenario (F-value = 0.84, p = 0.53). Similarly, there was no significant difference in the total delay (F-value = 0.39, p = 0.86). Upon calculating the delay in hours, it is evident that there are varying levels of delay before, during, and after construction, ranging from 3.1 to 21.4 hours. However, the delay significantly decreased to 13.6 hours once the BRT system was operational. With a 10% reduction in private cars, the delay was further reduced to 12.9 hours. However, it slightly increased to 14.4 hours with a 25% reduction in private vehicles.
Regarding the denied delay, it was minimal before construction (0.1 hours) and during construction (1.36 hours), but it increased to 10.4 hours after completion when the BRT service was not yet operational. In the modal shift scenarios, the denied delay levels were 80 and 51.5 hours, lower than the construction level (69.9 hours). However, no significant differences were observed between the construction and operation stages regarding denied delays (F-value = 0.43, p = 0.83) or total delays (F-value = 0.33, p = 0.90). Based on the two scenarios depicting the reduction of private cars, the proportion of total delay attributed to denied delay ranged from 13.3% to 28%. This indicates that the denied delays significantly outweighed the total delays in the study area, particularly at intersections related to introducing a new signal serving BRT operations and site redesign involving multiple meeting points.
4.4.2.4. Tested scenarios: simulated traffic density and speed
The average simulated network speed before construction was as low as 5.9 km/h, corresponding to LOS F according to the Highway Capacity Manual (HCM) classification for Average Urban Travel Speed Class II. Despite an increase in speed of 9.5 km/h during construction to reach 15.4 km/h, the streets still operated at LOS F. After completing the site work, the average speed decreased by 0.5 km/h, resulting in the same LOS F. During BRT operation, the expected average speed increased to 15.4 km/h, like the construction stage. In the modal shift scenarios, the average speeds were 15.1 km/h and 16.2 km/h for the 10% and 25% reduction scenarios, respectively. Regardless of the investigated scenario, the approaching streets to the intersection continued to operate at poor service with LOS F. The highest variation in speed, indicated by the standard deviation of 13.3 km/h, was observed during the BRT trial operation (Figure ). The lowest variation occurred before construction began, with a 1.9 km/h standard deviation. The ANOVA test did not provide evidence supporting a significant difference in speed based on the construction stage or scenario (F-value = 0.958, p = 0.447). The speed continues to fluctuate in a narrow margin, mainly because the intersection operates at the capacity condition and even beyond with or without the BRT, and the improvement did not yield significant improvement to enhancer intersection performance.
Figure 13. Simulated average speed and Street density by stage of construction/operation scenario.
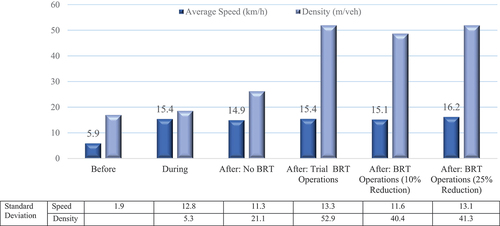
Although the traffic density on the street differs based on the construction stage or scenario of private car reduction, the difference was insignificant (F-value = 0.95, p = 0.462). It was initially low at 17 vehicles per meter (m/veh) before construction. During construction, there was a slight increase of 1.6 vehicles per meter, reaching a density of 18.6 m/veh. After completion, the density increased by 7.7 vehicles per meter, resulting in a density of 26.3 m/veh.
Once the BRT operation commenced, the density doubled to 51.9 m/veh, like the density associated with the 25% modal shift scenario, but slightly different from the 10% modal shift scenario (48.7 m/veh). Regardless of the simulated scenarios, the high-density levels indicate the significant congestion levels that the intersections within the study area would continue to experience. As discussed earlier, introducing a dedicated phase for the BRT increases the cycle time and the queue length, increasing the density of approach road segments. Moreover, the variation in density is more significant for scenarios depicting BRT operation compared to those without the service, suggesting that implementing the BRT system may impact traffic density and congestion levels.
4.4.3. Environmental impact
A vehicle would make 0.49 stops before construction, 0.41 stops during construction, and 0.49 stops after construction. As the BRT service operation began, it decreased to 0.43, similar to the 10% modal shift scenario (0.42). However, the 25% modal shift scenario reported the least number of stops, with only 0.40. ANOVA tests could not detect any difference in the tested attribute between the stage and reduction scenarios (F-value = 0.172, p = 0.973). Figure shows a significant negative relationship between fuel efficiency and the number of stops (r = −0.867, p = 0.025) and a weak, insignificant relationship between fuel consumption and the number of stops (r = 0.336, p = 0.515).
Figure 14. Simulated fuel consumption and stops per vehicle by stage of construction/operation scenario.
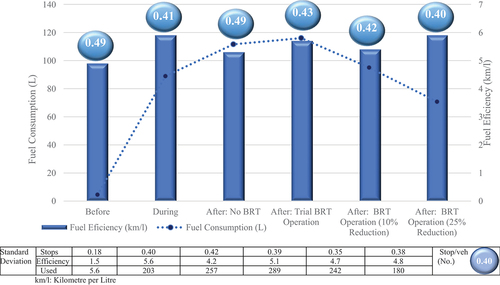
Fuel efficiency would be highest during construction (4.9 km/l), corresponding to the 25% modal shift scenario if it is realized and very close to the BRT service after construction (5.7). Before construction, the efficiency was the lowest (4.9 km/l), with the smallest variation (1.5 km/l) around the mean. After construction, fuel efficiency is slightly higher (5.3), which differs marginally from the 10% modal shift scenario. The variations of the remaining scenarios are restricted to a small band (4.2–5.6 km/h) except for the before-construction scenario. ANOVA analysis revealed no statistically significant difference between fuel consumption based on the construction stage or operation scenario (F-value = 0.082, p = 0.995). Fuel consumption increased before, during, and after construction, and the peak occurred during the trial BRT service operation. It is predicted to decrease if mode shifts of 10% and 25% materialize. Figure shows the variation increases with consumption increase and decreases with its decrease. However, no significant differences in consumption could be attributed to the construction or operation phases (F = 0.344, p = 0.885).
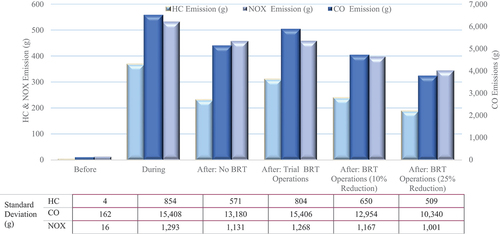
Simulating traffic conditions with the associated three types of pollutants (HC, NOX, and CO) shows similar trends for all scenarios but varying magnitudes. Figure shows that the lowest emissions, regardless of the type of pollutant, occur before construction begins. On the other hand, the highest would be related to the construction phase, followed by the scenario involving the BRT service operation. The 25% reduction scenario is estimated to have the lowest emissions levels in the after-construction scenario. Regarding variation, HC emissions would be the highest among the three simulated pollutants, followed by CO emissions. There would be a minor variation with coefficients of 1.41, 1.29, and 1.33 for HC, NOX, and CO emissions before construction. After completing the BRT trial service, HC, NOX, and CO emissions showed the most significant variation, with coefficients of variation of 2.72, 2.74, and 2.93, respectively. The ANOVA test provides no evidence of a statistical difference in mission levels [HC (F-Value = 00.419, p = 0.835), NOX (F-Value = 0.27, p = 0.93), CO (F-Value = 0.33, p = 0.895)] because of the stage of construction or operation scenario.
Figure 15. Simulated pollutant emission by stage of construction/operation scenario.
4.5. Construction impact on individual travel time and businesses
The impact of construction work on road user travel patterns showed that students’ door-to-door travel time increased by 28.67, while it was 16.87 minutes for non-student travelers. The statistical analysis indicates a significant difference in the average travel time before and during construction for both groups (students and non-students), as indicated by the t-test results (Table ). Half of the non-student group and 58 percent of the student group took the alternative road to avoid work zone congestion and inconvenience. The travel time for those who took the alternative road was increased by 19.58 min, marginally lower from the excess delay than those who remained on the same route as before the construction work (19.83 minutes).
Table 9. Travel time pattern by type and route selection and associated statistical tests
Construction travel time differs significantly from before for both groups, as indicated by the t-test results. Further breakdown of traveller type groups by route selection, as shown in Figure , suggests that students who remained on the route experienced an average delay of 38 minutes. In comparison, it was 22 minutes for those who took alternative routes.
Figure 16. Breakdown of the travel time pattern by traveller type and route selection and associated statistical tests.
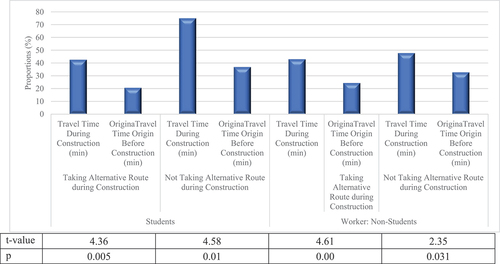
On average, the non-student group needs less time to reach their destination than the students. Fifty percent of the non-student group took the alternative route and experienced an additional delay of 18.63 minutes compared to only 15.06 minutes for those who remained using the same route. The difference in travel time between the four groups was statistically significant. The shop owner survey unanimously agreed that parking is a concern, with 94% confirming parking as a significant problem for their businesses. Many road users confirmed taking alternative roads to avoid congestion in the construction work and related detours. Consequently, around 84% of shop owners believe their businesses are negatively impacted.
5. Discussion of the results
Implementing Amman’s first mass-transit system encountered significant challenges, such as limited right-of-way, heavy congestion at main intersections, and a lack of trust in the city’s public transportation system. Among these bottlenecks, the Yajouz intersection was particularly problematic. It was anticipated that traffic would experience disruptions during the construction phase and even after the BRT operations commenced due to the site’s reconstruction to accommodate a two-lane BRT service. This study aimed to assess the effects of BRT operation and construction on various facility performance indicators, including the impact on individual travel patterns and businesses. The research involved conducting a field survey to gather data on turning movements, vehicle types, travel times, and delay times for the approaches to the intersection. Three periods were considered for data collection: morning, afternoon, and early evening, covering the periods before construction, during construction, and after the completion of the construction work, both with and without BRT service operation. Additionally, enough interviews were conducted to capture the impact of the construction on road users and local businesses, ensuring a comprehensive analysis of the situation.
5.1. Traffic flow characteristics
The study revealed a significant decrease in the total entry volume at the intersection, dropping from 7,192 vehicles per hour to 5,162 vehicles per hour during the construction phase, representing a reduction of 28%. After completing the construction work, the entry volume either returned to the previous level or slightly increased, which aligns with previous literature findings (Saleh et al., Citation2017). This reduction in traffic can be attributed to the municipality’s advisory for road users to utilize alternative routes to avoid congestion despite the intersection remaining open for traffic. Approximately 50% of the interviewed road users stated that they opted for alternative routes to evade high delays caused by detours. These delays amounted to double the travel time compared to before the construction work began.
The BRT operation, which started four years after the intersection opened to traffic, was expected to result in a 2% growth in traffic volume, in line with the country’s gross domestic product. This would have brought the traffic volume to 8,076 vehicles per hour. However, the total entry volume at the intersection decreased to 7,167 vehicles per hour, indicating a decline of 3.94% compared to the post-construction period and a decrease of 12.62% below what would have been expected based on the growth in travel demand. It is worth noting that the COVID-19 lockdown measures and other restrictions, coupled with the increasing trend of remote work and e-learning strategies, have had a noticeable impact on travel behavior. People have shown a greater inclination to travel less and reduce mobility, which may explain the drop in intersection traffic volume. The post-COVID-19 impact on travel demand has been extensively discussed in the literature, indicating an expected change in travel patterns (Currie et al., Citation2021; Du et al., Citation2021).
During the construction stage, the traffic composition revealed that the proportions of taxis and small buses were only half of what they were before construction began. Conversely, private passenger cars experienced an 11% increase, suggesting that the diverted traffic primarily consisted of small buses and taxis. This indicates that small buses did not adhere to their designated service routes, leaving a portion of public transport passengers without service due to the diversion. After completing the site construction work, the proportion of private car traffic slightly increased, along with a slight increase in the proportion of taxis. Consequently, the ratios of both small and large buses decreased.
The estimated travel speeds based on the field travel time and delay survey align well with the predicted network speeds, as indicated by a Pearson correlation coefficient 0.68. Before construction, the average observed traffic speed was 6 km/h, which was overestimated by 10 km/h in the model. During the construction phase, there was a minor deviation, with the average simulated speed (15.44 km/h) slightly lower than the observed speed (17.3 km/h). After the completion of the project and before the start of BRT service, the average observed speed was 22.7 km/h, compared to the simulated speed of 14.9 km/h (or 18.7 km/h when excluding the flyover speed, only 3.8 km/h higher). When the BRT service began, the average observed speeds were 20.73 km/h (with flyover) and 16.7 km/h (without flyover), while the simulated speed was 15.4 km/h. The simulated speeds for the two scenarios tested for BRT operation were 15.1 km/h and 16.2 km/h for 10% and 25% modal shifts, respectively. These results indicate that a modal shift can lead to reduced traffic and, consequently, higher speeds. However, it should be noted that installing additional signal phases and adjusting timings to accommodate the two-minute headway of BRT buses may result in longer travel times and slower speeds. Compared to the pre-construction period, effective work-site management, including detours and campaigns promoting alternative routes, resulted in an overall approach delay reduction of 27.26 seconds per vehicle. Although traffic streams exhibited differences in delay, their magnitudes varied. However, the statistical analysis did not identify significant differences between the construction stages.
5.2. Public transport ridership
With the operation of the BRT service, there was an increase in the proportion of buses and a slight decrease in the proportion of private passenger cars and taxis compared to the post-construction period. However, the difference in traffic composition due to the construction stage was statistically insignificant. The increase in bus proportions following the commencement of the BRT service, with 24 large buses operating on a 5-minute headway and a capacity of 59 passengers, only marginally increased ridership. The total ridership reached a level like the predicted ridership based on natural demand growth following GDP growth (2805 passengers per hour in both directions), slightly higher than the existing ridership (2797 passengers per hour). Despite the enhanced service quality compared to the existing service, the BRT system did not attract a significantly higher number of passengers. Despite having lower bus standards, the current service had higher bus occupancy than the BRT system. However, it is essential to note that both types of services would have been expected to have higher ridership than what was observed, which can be partially attributed to the post-COVID-19 changes in travel behavior. The restrictions imposed on public transport to ensure physical distancing led to a shift towards private car usage, a trend observed in other cities worldwide (Subbarao & Kadali, Citation2022). It should be emphasized that the evaluated service is still in a trial operation phase, and improvements and enhancements are being considered. These include increasing service frequency, upgrading fleet standards, and improving the feeder system, which is expected to increase ridership.
5.3. Traffic simulation
The simulation of traffic conditions for all stages allows for testing different future scenarios to estimate delays, which showed a positive correlation with the observed delay (r = 0.59, p = 0.004). For the investigated construction or operation scenario stage, 13 out of 23 modelled traffic streams were classified at the same level of service or one level worse than the corresponding field data. Similarly, six out of seven traffic streams (86%) were modelled at the same or lower service level before construction. The proportions of simulated traffic streams categorized at the same level or one or more service levels were 60%, 40%, and 40% for construction and post-construction scenarios with or without BRT, respectively. Before construction, the average observed intersection delay was 100.9 seconds per vehicle, overestimated by 21 seconds per vehicle in the model, resulting in a LOS F for both modelled and observed delays. During and after the reconstruction stages, the observed and modelled delays remained at LOS E. The delay during construction (64 seconds per vehicle) was underestimated by 8 seconds per vehicle in the model, while the after-construction stage without BRT service had an overestimated delay of 20.16 seconds per vehicle (73.7 seconds per vehicle).
Similarly, the modelled delay for the BRT operation scenario was 55.8 seconds per vehicle, underestimating the observed delay of 63.8 seconds per vehicle (LOS E) by 11.96 seconds per vehicle. However, there is no evidence of a significant difference in the average delay based on the construction stage or the tested scenario (F = 1.03, p = 0.42). Therefore, it can be concluded that the intersection reconstruction, including the provision of the flyover, improved performance as the delay decreased, despite the observed increase in traffic volume after the completion of the construction work. The LOS improved from F before construction to E after completion, with or without the BRT service. However, there is still a need to enhance intersection performance. The improvement could include supply-side management, like building an underpass for the SBLT or focusing on demand-side management strategies. These strategies involve promoting public transport as a viable mobility alternative to BRT ridership while discouraging the use of private vehicles. This finding aligns with research conducted in Miri City, Malaysia (Tay & Lee, Citation2018). During the early stage of BRT operation, the model predicted a further delay of 14.1 seconds per vehicle, which was not confirmed by field observations that indicated an 18-second reduction in traffic delays. Despite some discrepancies, the model remains valid in its predictions, as noted in the MAER (Mean Absolute Error) values. These discrepancies could be attributed to human errors in observing delays or accurately simulating all site parameters.
During the before and after phases of BRT construction, left-turn traffic experienced the highest delays, while right-turn traffic faced increased delays following the start of the BRT service. Before and during construction, the intersection layout allowed for free turn-on-red if traffic conditions permit, but free-right turns were no longer permitted post-construction. Completing the construction project, with and without the BRT service, led to queue lengths of 67.5 m and 379 m, respectively. The delay for EBLT decreased by 176 sec/veh between the before and during construction stages, transitioning from LOS F with a delay of 234 sec/veh to LOS E with a delay of 58 sec/veh. The queue length during the construction stage was reduced to one-third of the pre-construction length (136 m compared to 438 m). After the completion of the project without the BRT service, the service quality was slightly worse than during construction, with an increase in delay by 11.6 sec/veh while remaining at LOS E. Once the BRT service began, a new signal phasing and timing system was implemented, resulting in an 18.2 sec/veh decrease in delay and an improvement to LOS D. The two modal shift scenarios, associated with 2-minute headways, showed an increase in delay of 11.8 sec/veh for the 10% modal shift and a decrease of 9.8 sec/veh for the 25% modal shift compared to the scenario without modal shift. However, the delay and queue length for right-turn traffic did not follow the same trend as left-turn traffic, showing a significant increase, particularly when the BRT service began. Despite both modal shift scenarios resulting in reduced delays, they were still associated with long queues and high delays. Previous research by Sharma et al. (Citation2012) demonstrated a significant reduction in average queue length, maximum queue length, average delay time per vehicle, and emissions per vehicle when optimizing intersection performance with BRT service, which aligned with the findings for left-turn performance in this study but not for right-turn traffic.
During construction, delays and queue lengths may have decreased due to modified signal cycle splits, reduced phases, and changes in lane group configuration that prohibited U-turns. Additional green time was allocated to southbound traffic making a left turn. BRT dedicated lanes were temporarily opened to general traffic to accommodate SBLT traffic, separating it from EBTH traffic and helping maintain the same delay level as before construction (78 sec/veh) at LOS E. The delay level increased by 21 sec/veh when the service began to accommodate the 5-minute trial service headway, causing a slight increase in observed delay that was not reflected in the modelled delay, which showed a decrease, as explained earlier. Traffic conditions influenced EBLT delays at the next intersection and the type of control. The improvement included a flyover providing free flow if traffic conditions permit. There was a non-stop free movement with the reassignment of lane groups at the signal for EBTH traffic. The reduction in delay at the intersection was due to traffic conditions rather than signal operations (Figure ). Additional signal phasing was introduced once the BRT service began, causing delays for WBTH and SBLT traffic streams.
Figure 17. A render of Yajouz intersection upon completion of and BRT operation started.
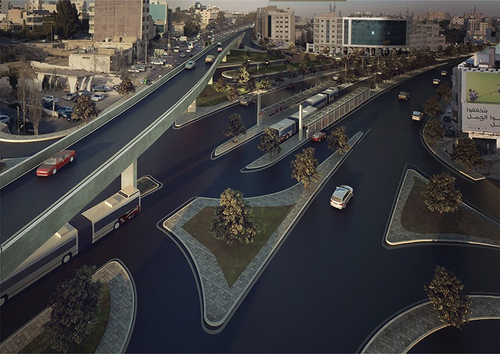
The Sim simulation considers all are merging and diverging traffic streams, which explains the slight difference observed compared to the Synchro modelling. A direct correlation exists between denied delay and operating conditions at the next intersection, meaning that higher delays at the adjacent intersection result in increased denied delay. The presence of detours and an additional traffic light located 400 meters from the intersection causes westbound traffic to stop twice in the area, leading to an overall increase in denied delay in the study area (129.3 sec/veh). After the construction, the redesigned layout of the site reduces the lanes for westbound traffic on the BRT, increasing the distance from the signalized intersection serving WBTH traffic and further exacerbating the denied delay (45 seconds). Once the BRT service begins operation, the denied delay increases to 58.3 sec/veh compared to the conditions before its implementation. Additionally, the intersection between the SBLT and the BRT lines can result in a signalized intersection, causing denied delay. A comparison between the simulated delay (Sim) and the modelled control delay (Synchro) demonstrates a significant correlation across the three types of movements: left-turn traffic (r = 0.604, p = 0.00), through traffic (r = 0.643, p = 0.00), and right-turn traffic (r = 0.622, p = 0.002).
5.4. Environmental impact
The construction of the flyover and the additional traffic light signal to facilitate BRT service would be associated with a higher number of stops per vehicle. This is the same as before construction. This may be related to the redesigned intersection layout and the increase in delay denied compared to the pre-and construction stages. It was denied that the delay before construction was negligible. The intersection approaches have the lowest traffic density, which may explain the low number of stops per vehicle. The fuel consumption increases when the denied delay increases and decreases when the fuel consumption decreases. The number of stops per vehicle is poorly associated with fuel consumption (r = 0.336 p = 0.515), and it is negatively and strongly correlated with fuel efficiency; as the number of stops decreases, fuel efficiency increases and the association is significant (r = −0.867, p = 0.024). Fuel efficiency was highest in construction. If a mode shift to BRT of 25% materialized, both would have fewer stops.
In the study, the lowest emission, irrespective of pollutant types, is linked to the before the construction stage. This is despite insignificant emission levels in the tested scenarios. At the same time, the highest is related to the construction stage. This has the smallest traffic volume but needs to travel longer distances due to the site’s redesigned layout, producing more emissions. The 25% reduction scenario provides the lowest emissions levels among different scenarios. Such findings may suggest that the long-term effect of the BRT, which may lead to a high modal shift, would result in lower emissions. Statistical analysis, however, did not reveal significant differences between construction and operation scenarios in emissions. Historical air quality indexes could not conclusively demonstrate the short-term effects of BRT on air quality. Some literature did not verify the hypotheses stating that improvements, like changing the roundabout to a signalized intersection, would reduce the emission; they were indifferent and recorded almost the same emissions rate (Shaaban et al., Citation2019), which partially agrees with the findings of this study.
5.5. Impact on travel time and business
The construction works increased door-to-door travel time by 28.67 and 16.87 minutes for the student and non-student groups, respectively. More than half of the interviewed subjects started taking alternative roads to avoid congestion at the construction site, and the delay in travel time almost remained the same. The difference in travel time is marginal, with 19.58 minutes for those who take alternatives and 19.83 minutes for those who stay on the same route. The average speed in the vicinity of the intersection was increased by 1 km/h during the construction. The study area covers 1.5 km, which implies rising travel by 1.5 minutes. The excess in the overall travel delays due to the disruption to traffic caused by the on-site work extending over a large area forms some form of a shockwave. The ratio of diversion traffic in the field survey (28%) is lower than the proportion taking alternative routes, as indicated in the interview survey (50%). The representativity of the sample and its distribution by road-user type may cause such a discrepancy, as it included a high proportion of public transport passengers, including taxis.
Nevertheless, 84% of the shop owners confirmed the negative impact of the construction site works and related detours on their businesses, which might be related to the fact that a considerable proportion of the traffic diverted to other routes. There was an accessibility problem for some shops, even for the non-diverted traffic. Furthermore, their main concern is the lack of parking places, which adds to their losses. This study highlights the need for better planning of the work zone layout and the associated traffic control devices by city planners and road agencies. It also indicates the need to promote the improvement schemes to the public to influence their modal choice for mass-transit projects.
To conclude, the impact of the construction zone on individuals and businesses should be integrated into the project’s initial plan and design. A policy should be developed to address these issues. A follow-up is needed to address the long-term impact of the BRT operation, investigating the modal shift, including the environmental impact. This study did not address the effects on pedestrian movements and how they can be enhanced since it is linked to the use of BRT services and the associated.
6. Conclusions
The study conclusions are summarized below:
Construction road work significantly impacted traffic conditions, and surrounding communities, leading drivers to opt for alternative routes doubling door-to-door travel times.
Traffic management measures improve the facility performance minimizing traffic impacts during the construction, including effective allocation of green time and signal phasing.
The facility, upon completion of the improvement work, attracted more traffic, offsetting expected benefits, leading to increased delays at the intersection.
The trial operation of the BRT service began four years after the project was completed, resulting in increased delays for intersection traffic streams due to the dedicated BRT phase, which affected overall intersection efficiency.
BRT service operating at a 5-minute headway showed minimal change in ridership, influenced by COVID-19-induced travel pattern shifts, necessitating continued monitoring.
The construction phase had the highest emissions, while a 25% modal shift to BRT resulted in fewer emissions and stops, indicating the environmental benefits of BRT implementation.
Local businesses experienced adverse effects due to detoured traffic and limited workplace access, highlighting the need for improved work zone layouts and management strategies.
In summary, this study emphasizes the crucial need to consider the impact of construction zones on individuals and businesses in initial project planning and design, urging the development of effective policies. It highlights the necessity for a follow-up study to assess the long-term impact of BRT operation, focusing on modal shifts and environmental effects. While connected to BRT services, the study did not explore pedestrian movement effects, indicating a potential area for future research.
Acknowledgments
The author would like to thank those who helped collect field data and Greater Amman Municipality for providing archiving data. There has been no funding for this research, and no grant has been awarded.
Data availability statement
Some or all data, models, or code that support the findings of this study are available from the corresponding author upon reasonable request.
Disclosure statement
No potential conflict of interest was reported by the author(s).
Additional information
Funding
References
- Bharadwaj, N., Edara, P., & Sun, C. (2019). Risk factors in work zone safety events: A naturalistic driving study analysis, Transportation research record. Transportation Research Record: Journal of the Transportation Research Board, 2673(1), 379–34. https://doi.org/10.1177/0361198118821630
- Casas, P., Vaton, S., Fillatre, L., & Chonavel, L. (2009). September. Efficient methods for traffic matrix modeling and on-line estimation in large-scale IP networks. 21st. International Teletraffic Congress.
- Cunagin, W. D., & Chang, E. C. P. (1982). Effects of trucks on freeway vehicle headways under off-peak flow conditions. Transportation Research Record, 869, 54–59.
- Currie, G., Jain, T., & Aston, L. (2021). Evidence of a post-COVID change in travel behaviour – self-reported expectations of commuting in Melbourne. Transportation Research Part A: Policy and Practice, 153, 218–234. https://doi.org/10.1016/j.tra.2021.09.009
- Dalala, Z., Al Banna, O. and Saadeh, O. (2020). The feasibility and environmental impact of sustainable public Transportation: A PV supplied electric bus network. Applied Sciences, 10(11), 3987. https://doi.org/10.3390/app10113987
- Deng, T., Ma, M. and Wang, J. (2013). Evaluation of bus rapid transit implementation in China: Current performance and progress. Journal of Urban Planning and Development, 139(3), 226–234. https://doi.org/10.1061/(ASCE)UP.1943-5444.0000150
- Deng, T. and Nelson, J. D. (2011). Recent developments in bus rapid transit: A review of the literature. Transport Reviews, 31(1), 69–96. https://doi.org/10.1080/01441647.2010.492455
- Deng, T. and Nelson, J. D. (2013). Bus rapid transit implementation in Beijing: An evaluation of performance and impacts. Research in Transportation Economics, 39(1), 108–113. https://doi.org/10.1016/j.retrec.2012.06.002
- Du, J., Hesham, A., Rakha, H. A., Filali, F., & Eldardiry, H. (2021). COVID-19 pandemic impacts on traffic system delay, fuel consumption and emissions. International Journal of Transportation Science and Technology, 10(2), 184–196. https://doi.org/10.1016/j.ijtst.2020.11.003
- GAM. (2021) The bus rapid transit (BRT) project. http://www.ammanbrt.jo/
- GAM. (2022) Construction of infrastructure for the BRT project/Al-dawriyat al-Kharijya/Tender no. (46/1/2016). http://www.ammanbrt.jo/Project/
- Greater Amman Municipality. (2010). Transport and mobility master plan for Amman. Final Report.
- Imam, R., Kang, S. C., & Quezada, D. (2020). Exploring low-carbon bus options for urban BRT systems: The case of Amman. Journal of Public Transportation, 22(1), 57–75. https://doi.org/10.5038/2375-0901.22.1.4
- Joni, H. and Hikmatt, M., (2018) Assessment at Al-Ameer signalized intersection in Samawa city. MATEC web of conferences 162, 01039. The 3rd International Conference on Buildings, Construction and Environmental Engineering, BCEE3–2017. https://doi.org/10.1051/matecconf/201816201039
- Leleisa, S., Quezon, E. T., & Wedaj, T. (2018). Performance Evaluation of grade separation within the selected major intersection in Addis Ababa city. American Journal of Traffic and Transportation Engineering, 3(3), 41–49. https://doi.org/10.11648/j.ajtte.20180303.11
- Liang, G., Wang, F., Wang, W., Sun, X., & Wang, W. (2014). Assessment of freeway work zone safety with improved cellular automata model. Journal of Traffic and Transportation Engineering (English Edition), 1(4), 261–227. https://doi.org/10.1016/S2095-7564(15)30271-3
- Maji, A., Maurya, A. K., Nama, S. and Sahu, P. K. (2015). Performance-based intersection layout under a flyover for heterogeneous traffic. Journal of Modern Transportation, 23(2), 119–129. https://doi.org/10.1007/s40534-015-0072-4
- Mashhadi, A. H., Farhadmanesh, M., Rashidi, A., & Marković, N. (2021). Review of methods for estimating construction work zone capacity. Transportation Research Record, 2675(9), 382–397. https://doi.org/10.1177/03611981211002202
- Osei, K. K., Adams, C. A., Ackaah, W., & Oliver-Commey, Y. (2021). Signalization options to improve capacity and delay at roundabouts through microsimulation approach: A case study on arterial roadways in Ghana. Journal of Traffic and Transportation Engineering (English Edition), 8(1), 70–82. https://doi.org/10.1016/j.jtte.2019.06.003
- Saleh, S. M., Sugiarto, S., Almira, H. and Dedek, A. (2017). A study on the traffic impact of the road corridors due to flyover construction at Surabaya intersection, Banda Aceh of Indonesia. Proceedings of the 3rd International Conference on Construction and Building Engineering: Smart Construction Towards Global Challenges (ICONBUILD) 2017 AIP Conf. Proc. 1903, 060005.1–0600057. https://doi.org/10.1063/1.5011559
- Satiennam, T., Fukuda, A. and Oshima, R. (2006). A study on the introduction of bus rapid transit system in Asian developing cities: A case study on Bangkok Metropolitan Administration project. IATSS Research, 30(2), 59–69. https://doi.org/10.1016/S0386-1112(14)60170-9
- Shaaban, K., Abou-Senna, H., Elnashar, D., & Radwan, E. (2019). Assessing the impact of converting roundabouts to traffic signals on vehicle emissions along an urban arterial corridor in Qatar. Journal of the Air & Waste Management Association, 69(2), 178–191. https://doi.org/10.1080/10962247.2018.1526137
- Shao, Y., Luo, Z., Wu, H., Han, X., Pan, B., Liu, S., & Claudel, C. G. (2020). Evaluation of two improved schemes at non-aligned intersections affected by a work zone with an entropy method. Sustainability, 12(14), 5494. https://doi.org/10.3390/su12145494
- Sharma, H. K., Swami, M. and Swami, B. L. (2012). Optimizing performance of at-grade intersection with bus Rapid transit corridor and heterogeneous traffic. International Journal of Transportation Science and Technology, 1(2), 131–145. https://doi.org/10.1260/2046-0430.1.2.131
- Soule, A., Lakhina, A., Taft, N., Papagiannaki, K., Salamatian, K., Nucci, A., Crovella, M., & Diot, C. (2005). Traffic matrices: Balancing measurements, inference and modeling. ACM SIGMETRICS Performance Evaluation Review, 33(1), 362. https://doi.org/10.1145/1064212.1064259
- Stewart, A. F., Attanucci, J. P., & Wilson, N. H. M. (2015). Ridership response to incremental bus rapid transit upgrades in North America: Demographic and network effects. Transportation Research Record, 2538(1), 37–43. https://doi.org/10.3141/2538-05
- Stewart, O. T., Moudon, A. V., & Saelens, B. E. (2017). The causal effect of bus rapid transit on changes in transit ridership. Journal of Public Transportation, 20(1), 91–103. doi:10.5038/2375-0901.20.1.5 https://doi.org/10.5038/2375-0901.20.1.5
- Subbarao, S. S. V., & Kadali, R. (2022). Impact of COVID-19 pandemic lockdown on the public transportation system and strategic plans to improve PT ridership: A review. Innovative Infrastructure Solutions, 7(1), 97. https://doi.org/10.1007/s41062-021-00693-9
- Suleiman, G., Dahamsheh, A. M., & Ergun, M. (2020). Improvement of highway work zone performance by traffic management. International Journal of Civil Engineering and Technology (IJCIET), 11(10). https://doi.org/10.34218/IJCIET.11.10.2020.003
- Tay, A. C., & Lee, H. H. (2018). Traffic condition with road upgrading during construction and operation stages based on level-of-service (LOS). IOP Conference Series: Materials Science and Engineering, 344(1), 012018. https://doi.org/10.1088/1757-899X/344/1/012018
- Trafficware. (2017). Synchro Studio 10 Synchro plus SimTraffic and 3D Viewer: Traffic Signal Optimization and Simulation Modeling Software User Guide. Version 1.
- Transportation Research Board; National Academies of Sciences, Engineering, and Medicine. (2016). Highway capacity manual 6th Edition: A guide for multimodal mobility analysis. The National Academies Press.
- Varhelyi, A. (2018). Inventory of best practices to prevent incursions into work zones - literature review. Lund University. Conference of European Directors of Roads (CEDR). Transnational Road Research Programme. Incursion Reduction to Increase Safety in road work zones, Task 1.3
- Venugopal, S., Andrze, J. T. (2001). Investigation of factors affecting capacity at rural freeway work zones. In: 80th Annual Meeting of the Transportation Research Board, Washington.
- Vincent, W. A. J., & C, L. (2006). The potential for bus rapid transit to reduce Transportation-related CO2 emissions. Journal of Public Transportation, 9(3), 219–237. https://doi.org/10.5038/2375-0901.9.3.12
- WAQI. (2023). Real time air quality index, air pollution in the world. The World Air Quality Index Project. https://waqi.info/
- Wisconsin Department of Transport- DoT. (2019). Traffic Engineering, operations & safety manual- traffic analysis and modeling: 20 microscopic simulation traffic analysis. https://wisconsindot.gov/dtsdManuals/traffic-ops/manuals-and-standards/teops/16-20.pdf
- Yang, H., Kaan Ozbay, K., Ozturk, O., & Xie, K. (2015). Work zone safety analysis and modelling: A state-of-the-art review. Traffic Injury Prevention, 16(4), 387–396. https://doi.org/10.1080/15389588.2014.948615
- Yazici, M. A., Levinson, H. S., Ilicali, M., Camkesen, N. and Kamga, C. (2013). A bus rapid transit line case study: Istanbul’s metrobüs system. Journal of Public Transportation, 16(1), 153–177. https://doi.org/10.5038/2375-0901.16.1.8
- Zhang, Z., Akinci, B. M., & Qian, S. (2022). Inferring the causal effect of work zones on crashes: Methodology and a case study. Analytic Methods in Accident Research, 33, 100203. https://doi.org/10.1016/j.amar.2021.100203