
 ?Mathematical formulae have been encoded as MathML and are displayed in this HTML version using MathJax in order to improve their display. Uncheck the box to turn MathJax off. This feature requires Javascript. Click on a formula to zoom.
Abstract
This study was carried out to determine the current levels of nitrates in baby foods marketed in Lisbon, Portugal to estimate the toxicological risk associated with their intake. The nitrate content was determined in bottled baby foods of four varieties: vegetable-based foods, meat-based foods, fish-based foods, and fruit-based foods. A total of 39 samples were analyzed over the period 2010–2011. Average and median levels of nitrate in baby foods were lower than the maximum limits established by European Union legislation (200 mg kg−1). Median nitrate values in baby foods were 61, 30, 39, and 15 mg kg−1 w/w for vegetable-based baby foods, meat-based baby foods, fish-based baby foods, and fruit-based baby foods, respectively. The estimated nitrate daily intake through bottled baby foods for infants indicate that individually, these foods are not able to induce nitrate toxicity in the children population.
Public Interest Statement
In recent decade, there have been significant changes in the eating habits of the children, where the consumption of processed foods has been increasing, such as vegetable-, meat-, fish-, and fruit-based baby foods. The exposure to all these sources of nitrate can increase the number of cases of nitrate toxicity, mainly the methemoglobinemia. Therefore, nitrates are an important parameter for baby food quality and safety.
In order to study nitrate content in baby foods marketed in Portugal, a colorimetric method after extraction with hot water and reduction in cadmium columns was in-house validated and subsequently used for the analysis of processed baby foods. This is the first study on occurrence of nitrates in meat- and fish-based baby foods.
The concentrations of nitrate in all analyzed samples are below the acceptable daily intake (ADI = 3.7 mg kg−1), indicating that individually these foods are not able to induce nitrate toxicity in the infant population.
1. Introduction
In the discussion of population health, the issue of infant feeding is extremely important. Due to the sensitivities of the physiology of babies and infants, it is extremely important to control the type of substances ingested by them. Initially, it is important to control the feeding of pregnant and breastfeeding women, and then this concern is reflected in the control of infant feeding.
Infants are especially vulnerable to the acute, sub-acute, and chronic effects of ingestion of xenobiotics, as the nervous, reproductive, digestive, respiratory, and immune systems of infants are in developing stage. Moreover, dietary exposure of infants to xenobiotics tends to be higher when the exposure is calculated as mg kg−1 body weight than that of other population groups, and the assessment of acute and chronic dietary exposure to contaminants in baby foods is needed to ensure healthy infant growth (Piccinelli et al., Citation2010).
It is common to feed the baby with mashed fruit and vegetables in the first months of life, and add meat and fish from 6 months onward. The introduction of new foods in infant feeding is well studied and although doctors sometimes disagree on some specific issues, it is important to note that this introduction follows a pattern related to the age of the baby (number of months), which is closely related to your metabolism and your ability to process food. All studies in this area show that there is a great concern given to child health, which no doubt contributed greatly to the reduction of infant mortality rate that has been observed since the early twentieth century. This feed contributes to the rate of development of a country, and, even without the socioeconomic consequences, from human viewpoint, it is always important to take care of the new generation.
Since the first year of life is a very vulnerable and sensitive period in the human development, the composition of baby foods and its consumption pattern are crucial, although a deep assessment of these products has not been achieved (Pandelova et al., Citation2009).
Traditionally, the baby foods were cooked at home, under the guidance of the physician according to the baby’s age. However, today in developed countries (or in development), part of infant nutrition is made in the form of processed food, and as such it has become very important to keep a tight control over their production (Kersting, Alexy, Sichert-Hellert, Manz, & Schöch, Citation1998). One of the compounds under study in processed baby foods is nitrates.
The nitrogenous-base derivatives, in particular nitrate and nitrite, may have some effects on human health when present in large quantities. Nitrate per se is relatively non-toxic, but its metabolites—nitrite, nitric oxide, and N-nitroso compounds—make nitrate of regulatory importance because of their potentially adverse health implications (European Food Safety Authority (EFSA), Citation2008; Santamaria, Citation2006). These nitrogen compounds present particularly in water (particularly in untreated wells or in proximity to agricultural land), vegetables (through the fertilizers, the composition usually includes some form of nitrogenous derivative), and dried, smoked, or cured meat (as a preservative because of the addition of nitrites or nitrates) are necessary to prevent the growth and toxin production by bacteria, particularly Clostridium botulinum) (EFSA, Citation2003).
In 2010, EFSA published a statement on possible public health risks for infants and young children from the presence of nitrates in leafy vegetables (EFSA, Citation2010). The Scientific Committee for Food (SCF) refers that vegetables are the principal source of nitrate exposure, providing 70–90% of the average daily nitrate intake. Some vegetables, particularly leafy vegetables like rucola, lettuce, and spinach, have been shown to have relatively high levels of nitrate (EFSA, Citation2010). Foodstuffs other than vegetables and cured meats usually contribute relatively little to intakes of nitrates (European Community, Citation1997). With regard to nitrites, fresh and undamaged plant tissues are usually very low in this compound, but this concentration can be increased during post-harvest storage (decreased water content) by the action of nitrifying bacteria and an inadequate storage (EFSA, Citation2010). Spinach has often been seen as one of several major vegetable sources for nitrate in the diet, and high levels of nitrite have been found in home-made spinach baby food stored under inappropriate conditions (Greer, Shannon, & Committee on Nutrition, Committee on Environmental Health, Citation2005; Sanchez-Echaniz, Benito-Fernandez, & Mintegui-Raso, Citation2001). Due to the frequent use of nitrite as a preservative, most of the nitrite is obtained by meat consumption (60 to 95%) (Hsu, Arcot, & Alice Lee, Citation2009). It recommended, however, continuation of efforts to reduce exposure to nitrate via food and water (European Community, Citation2006b).
The primary health concern regarding nitrate and nitrite is the formation of methemoglobinemia, so-called “blue-baby syndrome” (Greer et al., Citation2005). Nitrate is reduced to nitrite in the stomach of infants, and nitrite is able to oxidize hemoglobin (Hb) to methemoglobin (metHb), which is unable to transport oxygen around the body. The reduced oxygen transport becomes clinically manifest when metHb concentrations reach 10% or more of normal Hb concentrations; the condition, called methemoglobinemia, causes cyanosis and, at higher concentrations, asphyxia. The normal metHb level in infants under 3 months of age is less than 3%. The Hb of young infants is more susceptible to metHb formation than that of older children and adults; this is believed to be the result of the large proportion of fetal Hb, which is more easily oxidized to metHb, still present in the blood of infants. In addition, there is a deficiency in infants of metHb reductase, the enzyme responsible for the reduction of metHb to Hb. The reduction of nitrate to nitrite by gastric bacteria is also higher in infants because of low gastric acidity (WHO, Citation2004). As a result, the methemoglobinemia manifested mainly in the first six months of life, but the greater incidence is in the first quarter (Fewtrell, Citation2004; Greer et al., Citation2005; Phillips, Citation1971; Zeman, Citation2005).
Although, the occurrence of nitrates and nitrites in foodstuffs has been a subject of concern to health authorities for a long time, more recently, especially attention is given to baby foods and according to European legislation (EC, Citation2006b), a maximum level of 200 mg kg−1 of nitrates in processed cereals and baby foods for infants and young children is established.
An acceptable daily intake (ADI) of 0–3.7 mg kg−1 body weight day−1 was established by the SCF in 1990 (European Community, Citation1992), retained in 1995 (European Commission, Citation1997) and reconfirmed by the Joint FAO/WHO Expert Committee on Food additives (JEFCA) in 2002 (FAO/WHO, Citation2003).
The European Commission, in considering options for a longer term strategy to manage any risks from dietary nitrate exposure, used the scientific basis provided by the opinion of the European Food Safety Authority (EFSA) on “Nitrate in vegetables” issued by the Panel on Contaminants in the Food Chain (CONTAM Panel) in 2008. As part of the process, more information was requested on potential, acute health effects of nitrate exposure in infants and young children consuming lettuce or spinach, taking into accounts the possibility of establishment of slightly higher maximum levels as an alternative to local derogation (EFSA, Citation2010).
As some estimates of chronic nitrate exposure were in the region of the ADI, it is to be expected that acute exposure will exceed the ADI on some instances. Occasionally exceeding the ADI does not per se indicate a health risk, since the ADI for nitrate was derived from subchronic and chronic studies. Since nitrate, after reduction to nitrite, has the potential to cause methemoglobinemia, which can occur after a single exposure, it would be appropriate to establish an Acute Reference Dose (ARfD), in order to assess the safety of acute exposure to nitrate. The available data from studies in animals and reports of human nitrate poisoning did not provide an adequate basis for establishing an ARfD. However, the available data indicate that methemoglobin (MetHb) is not elevated in children or infants above 3 months old when exposure to nitrate from drinking water or from vegetables is below at least 15 mg kg−1 body weight day−1. Poisoning due to nitrates in food is serious, but rare, and occurs mainly due to water contamination and not necessarily through food, which, in most cases, will only contribute to a cumulative effect of continuous exposure to nitrates (EFSA, Citation2010).
Distinct analytical methods are available for the analysis of nitrates and nitrites in water and food matrices, such as potentiometric method with ion-selective electrodes (Consalteri, Rigato, Clamor, & Giandon, Citation1992), ion chromatography (McMullen, Casanova, Gross, & Schenck, Citation2005), spectroscopic methods (Casanova, Gross, McMullen, & Schenck, Citation2006; Clesceri, Greenberg, & Eaton, Citation2005), and capillary electrophoresis (Erdogan & Onar, Citation2012).
Spectroscopic methods are by far the most widely used for nitrate/nitrite determination due to the excellent limits of detection obtained and facile assay-type protocols. A broad range of techniques have been evaluated, including UV/Vis, chemiluminescence, fluorimetric, and IR/Raman protocols (Moorcroft, Davis, & Compton, Citation2001).
The objectives of this study were to analyze the contents of nitrates in processed foods intended for children consumption marketed in Portugal. A colorimetric method after extraction with hot water and reduction in cadmium columns (CRM) was in-house validated and subsequently used for sample analysis.
Some samples’ results were compared with those ones obtained for the same samples analyzed by ion chromatography (IC) with conductivity detector. This chromatographic method is one of the accredited methods in LALA (Laboratório de Águas do Litoral Alentejano), an accredited laboratory with which our laboratory is collaborating on various methodologies. In this method, nitrate and nitrite were separated on a hydroxide-selective anion-exchange column using online electrolytically generated high-purity hydroxide eluent and detected using suppressed conductivity detection.
Results regarding the calibration, linearity, recovery, precision, detection, and quantification limits are presented and discussed. The in-house validated method was applied for the analysis of target processed foods from all studied matrices and was found to be appropriate for monitoring nitrates in these matrices, at levels ≥ 0.3 mg kg−1.
2. Materials and methods
2.1. Samples
Sample selection was conducted in order to include a large number of bottled baby foods and brand names labeled as being intended for infants or young children. The products were selected particularly for children up to the first year of life. Due to this fact, the number of brands and products is scarce. A total of six brand names, two with national origin and the remaining imported were analyzed. A total of 39 baby foods were purchased comprising 15 meat-based meals (for infants with four, six, eight, and twelve months of age), 4 fish-based meals (for infants with eight and twelve months of age), 7 vegetables-based meals (for infants with four, six, and eight months of age), and 13 fruit-based meals (for infants with four, six, and eight months of age). Samples were randomly selected from big supermarkets, organic produce retail outlets, and pharmacies in Lisbon city (Portugal) between August 2010 and January 2011.
The quantification of any analyte in a sample can be made if its concentration in the sample is higher than the LOD or LOQ, although it is more accurate to use the LOQ. However, between the LOD and the LOQ can be several samples, which were considered negative if the measurement were made with the LOQ.
In this study, all samples are considered positive when their concentration in food sample is above the LOD, and it means that analyte is present in the sample. Therefore, this sample is different than the other sample, where analyte is not detected.
Therefore, samples with a concentration of nitrates higher than the LOD were considered to be positive, whereas samples with concentrations lower than LOD were considered to be negative. All results are reported as uncorrected for recovery.
2.2. Reagents and standard solutions
All the aqueous solutions and serial dilutions were prepared by dilution with ultra-pure water (Mili Q System, Millipore, Billerica, MA, USA).
Several reagents (pro-analysis grade), such as copper sulfate, potassium hexacyanoferrate(II)-3-hydrate, potassium nitrate, sodium hydroxide, N-(1-naphthyl)-ethylenediamine dihydrochloride (NED dihydrochloride), sodium nitrite, 85% ortho-phosphoric acid, 37% sulfuric acid, sulfanilamide, and zinc sulfate heptahydrate, were purchased from Merck (Darmstadt, Germany). The cadmium granules (30–80-mesh) was purchased from Sigma-Aldrich (Sigma-Aldrich, Portugal).
One liter of Griess reagent (color reagent) for nitrites reaction was prepared with 100 ml of 85% ortho-phosphoric acid, 10 g of sulfanilamide, and 1 g of NED dihydrochloride, according to the standard methods procedure (4500-NO2 − B) (Clesceri et al., Citation2005).
A nitrate stock solution at 1000 mg l−1 was purchased from Eutech Instruments (Thermo Scientific, Portugal). This commercial solution was used to prepare the control intermediate solution. A total of 10 ml of this stock solution was diluted with ultra-pure water to 100 ml to obtain an intermediate control solution of 100 mg l−1 NO3 −. Appropriate amounts of the intermediate control solution were diluted with ultra-pure water in order to get a standard control of 0.2 mg l−1 and 4.0 mg l−1.
A nitrate standard solution at a concentration of 100 mg l−1 was prepared by dissolving 0.163 g of potassium nitrate in 1000 ml. This solution was used to prepare the standard solutions for the calibration curve. Appropriate amounts of the standard solution were diluted with ultra-pure water in order to obtain a final concentration between 0.2 and 4.0 mg l−1 (calibration curve).
A buffer solution of pH9.6–9.7 (1.7 ml v/v of sulfuric acid with 10% v/v of sodium hydroxide at 25% w/w), Carrez I solution (15% w/v of potassium hexacyanoferrate (II)-3-hydrate), and Carrez II solution (22% w/v of zinc sulphate heptahydrate with 3% v/v of glacial acetic acid) was also prepared.
A nitrite stock solution at 1000 mg l−1 was purchased from Eutech Intruments (Thermo Scientific, Portugal). This commercial solution was used to prepare the standard intermediate solution. A total of one milliliter of this stock solution was diluted with ultra-pure water to 100 ml to obtain an intermediate control solution of 10 mg l−1 NO2 −. Appropriate amounts of the intermediate control solution were diluted with ultra-pure water in order to get a standard control of 0.03 mg l−1 and 1.5 mg l−1.
All these solutions are prepared and stored in polyethylene bottles at room temperature and protected from light.
2.3. Analysis of nitrates in baby foods
2.3.1. Sample treatment
Ten grams of homogenized sample was measured and transferred to a 750 ml Erlenmeyer flask. Then, 500 ml of hot water (± 70°C) was added. Extraction was performed in a thermostated water bath (± 100°C) during 15 min. After cooling to room temperature, the sample was transferred to a 500 ml volumetric flask and it was completed to graduation mark with ultra-pure water. Clarification was done by adding 12 ml of Carrez I, 12 ml of Carrez II, and 40 ml of buffer solution. The mixture was then filtered through a paper filter. For filtration, a gravimetric analysis filter, 0.45 μm with thin pad 37 mm, 150 mm of diameter, and white from Millipore (Molsheim, France) was used. Some results were compared with the ones obtained by ion chromatography analysis. In these cases, the final extract was passed through a 0.45-mm PET (polyester).
2.3.2. Preparation of reduction column
A glass chromatography with a PTFE plug stopcock at the bottom was used. The column has an outer diameter of 20 mm and a height of 150 mm. A glass wool plug was inserted into the bottom of reduction column and then, about 10 g of cadmium granules was introduced. The cadmium was previously treated and activated (4500-NO3 − E) (Clesceri et al., Citation2005). Above the activated cadmium granules, the water level was maintained to prevent entrapment of air. Before column utilization (with samples or standards), the water above the cadmium granules was removed.
The cadmium column was regenerated when its reducing capacity indicated a loss of efficiency, which was tested by the analysis of nitrate standard controls (Clesceri et al., Citation2005). The efficiency was evaluated by the comparison of a reduction of a nitrate standard (NO3 −) and a nitrite standard (NO2 −).
2.3.3. Spectrophotometric method
For nitrate analysis, a spectrophotometric method was selected. Nitrate was reduced to nitrite by post-column reduction using a cadmium column. 50 ml of treated sample or a portion diluted to 50 ml was introduced in a cadmium column. The sample was collected in 50 ml volumetric flask. As soon as possible, and not more than 15 min after reduction, 2 ml of Griess reagent was added. Between 10 min and 2 h afterward, the absorbance was measured at 543 nm against an ultra-pure reagent blank. If the concentration of nitrate exceeds the standard curve range, use remainder of reduced sample to make an appropriate dilution and analyze again. Nitrite reacted with Griess reagent to produce a dye that was detected at 543 nm (SMEWWA 4500 NO2-B) (Clesceri et al., Citation2005). The spectrophotometric analysis was performed using a double-beam UV/Visible spectrophotometer, HITACHI U-2000 (Tokyo, Japan).
2.3.4. Ion chromatography method
The Ion chromatography system consists of a CS-2000 quaternary-proportioned gradient pumping system consisting of a Dionex GS50 pump, EG50 eluent generator, AS50 auto-sampler, DS6 heated conductivity cell, LC 30 chromatography oven with rear-loading Rheodyne injection valve (1000 loop), ICS-2000 isocratic pumping system with integrated conductivity detection, AS50 auto-sampler. A Dionex anion self-regenerating suppressor set to 50 mA (ASRS 300, 4 mm) was used for the electrochemical suppression with Dionex eluent generator cartridge EGC III KOH.
Dionex IonPac® AS19, 250 mm × 4 mm i.d. and a guard column: IonPac® AG19, 50 mm × 4 mm i.d. were used.
The injection volume was 250 μl. The standard working solutions were always analyzed together with the samples. Samples were injected in duplicate and checked for repeatability. Data were collected and analyzed using the Chromeleon® 6.6 link data software. Peak identification was performed comparing the retention times with those from pure standards.
Quantification was made using external standard calibration. All samples, calibration solutions, and control solutions was analyzed by the same way according to selected method (Clesceri et al., Citation2005). The nitrate concentration was expressed in mg kg−1.
2.4. In-house validation studies
The linearity range was studied by analysis of 10 solutions containing nitrate at different concentration levels (0.02–4.0 mg l−1—preliminary linear range). The calibration curve was plotted, applying least square regression analysis. Linearity was evaluated by the values of determination coefficients (R 2) and coefficient of variation of the method (CV m , %), and later several statistical tests were applied, such as residual analysis, Mandel test (Fisher-Snedecor test), and RIKIL test (ISO Citation1990; van Trijp & Roos, Citation1991). The initial results were treated in order to comply with all the defined limits for each statistical test.
The choice of the working range was made by evaluation of the homogeneity of variances. In order to verify the homogeneity of variances, 10 standard solutions of each of the lowest (0.20 mg l−1) and the highest (4.0 mg l−1) concentrations of the linear range are analyzed separately. The standard deviation (S) and variances (S2) of both series of measurements were checked for homogeneity using an F-test (ISO, Citation1990).
These solutions were analyzed to evaluate the repeatability of the method. The values of the limit of detection (LOD) and of the limit of quantification (LOQ) of the method were calculated using the repeatability data and using residual standard deviation (S
x/y
) and slope (b) of calibration curve (LOD = 3 × and LOQ = 10 ×
).
The precision of spectrophtometric method was evaluated by repeatability and intermediate precision assays. The repeatability was studied by the standard deviation determination of 10 independent standard solutions of the lowest concentration (0.2 mg l−1), intermediate concentration (1.0 mg l−1), and the highest concentration (4.0 mg l−1) of the working range. The intermediate precision or intra-laboratory reproducibility was evaluated by analysis of 10 independent standard solutions of three concentration levels (0.2 mg l−1, 1.0 mg l−1 and 4.0 mg l−1), which were analyzed in two series of independent working days (2 days: 5 analyzes/day). Then, we determined the relative standard deviation of the 10 determinations for each concentration level. The repeatability and intra-laboratory reproducibility of the method were expressed as a relative standard deviation, RSDr and RSDR, respectively.
Accuracy was evaluated by recovery studies in all matrices, meat-based baby foods, fish-based baby foods, vegetables-based baby foods, and fruit-based baby foods.
A sample of each baby food of approximately 50 g was weighed and spiked with two concentrations of nitrates (5 and 15 mg kg−1). The spiked food samples were homogenized with a vortex mixer. Three subsamples of 10 g from each spiked baby food (meat-based, fish-based, vegetables-based, and fruit-based) were transferred to a 750 mL Erlenmeyer flask. Three subsamples of 10 g of each remaining baby food (blank assay) were also weighed and transferred to a 750 ml Erlenmeyer flask. Both samples were analyzed according to the procedure described in Section 2.3.1.
3. Results and discussion
3.1. Linearity and working range
Linearity was determined by analyzing several calibration standards in the range of 0.02–4 mg l−1. This preliminary linear range did not comply with several acceptance criteria like determination coefficient (R 2 ≥ 0.995), the residuals analysis and the RIKILT residuals (< 10%). Moreover, the first points of the calibration curve showed no absorbance value. Therefore, the linear range was reduced. The new calibration curve (0.2–4.0 mg l−1) fulfills all the requirements for a linear method, shows a well-defined linear range (Table ), and the quantification limit obtained by the calibration curve was equal to the first concentration level.
Table 1. Regression data and analytical limits for nitrate by spectrophotometric method
LOD and LOQ showed equal results when determined by both methods, under repeatability conditions and using data values of calibration curve. Daily, the LOQ was tested in routine analysis as control standard (0.2 mg l−1).
The values of LOD and LOQ were corrected with volume of dilution (ml) and test portion of baby food (g) and are expressed at mg kg−1. The LOD and LOQ in baby food samples were 2.8 mg kg−1 NO3 − and 9.3 mg kg−1 NO3 −, respectively.
The absorbance values of nitrate calibration standards (after reduction on cadmium column) are plotted on a graph against the absorbance values of nitrite calibration standard with same concentration (nitrate standard absorbance vs. nitrite standard absorbance). The concentration of nitrite calibration standard is the theoretical concentration obtained after reduction of nitrate in the cadmium column. There was a good correlation between both standards with a R 2 of 0.9993 (N = 6). The results are showed in Figure .
Figure 1. Correlation between theoretical and experimental concentration of nitrites
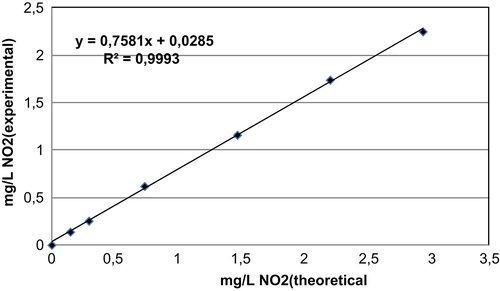
The efficiency of cadmium column was 82% with a RSD of 7.7%.
3.2. Repeatability, intra-laboratory reproducibility, and accuracy
The repeatability and intra-laboratory reproducibility were studied by analyzing replicate samples of ultra-pure water spiked with different concentration of nitrate in validated working range. These quality parameters are expressed as relative standard deviation (RSD) (Table ).
Table 2. Repeatability and intra-laboratory reproducibility for nitrate by spectrophotometric method
The results in both conditions showed an RSD lower than 10%, therefore, the method had a good precision.
The repeatability was also studied in our baby foods spiked with two concentrations of nitrate. Samples with nitrate levels of 50 mg kg−1 for meat-based food, 30 mg kg−1 fish-based food, 40 mg kg−1 for vegetable-based food, and for 11 mg kg−1 for fruit-based food were used for repeatability studies. A total of 24 samples were analyzed. Table shows the repeatability for nitrate by spectrophotometric method (cadmium reduction method) in baby food samples and the recovery results (Rec, %) in these different matrices after fortification. These recovery results are also a tool for evaluating the accuracy of the method.
Table 3. Recovery rates (Rec, %) and RSDr for nitrates by spectrophotometric method (cadmium reduction method) in baby foods at two spiked levels
The RSDr values for 5 mg kg−1 spiked level for meat-based food, fish-based food, vegetable-based food, and fruit-based food were 15, 2.9, 4.4, and 11%, respectively.
The RSDr values for 15 mg kg−1 spiked level for meat-based food, fish-based food, vegetable-based food, and fruit-based food were 11, 8.3, 9.5, and 11%, respectively.
The recoveries’ values are according to the defined requirements (between 60 and 120%, for a concentration range of 0–500 mg kg−1) (European Community, Citation2006a) and the variability of the data was satisfactory with an RSDr ≤ 20%.
These results showed that cadmium reduction method for nitrate analysis had a good accuracy.
Method accuracy was also determined by the analysis of some baby food samples by both methods, CRM and IC. When analyzed as duplicates, the concentration obtained by both methods showed differences duplicate (DD%) below 20% for all concentration samples (40–120 mg kg−1), with values between 2.4% and 16%. The results suggest that the analysis of nitrates by CRM did not have a significant loss of nitrate (error < 20%) (Figure ).
Figure 2. Comparison between the results of baby food samples obtained by cadmium reduction method and ionic chromatography
Comparison of baby foods’ nitrate concentrations using colorimetric analysis and an ion chromatography shows a good correlation (R 2 = 0.978). The 95% confidence intervals for regression line parameters are: 0.80–1.0 for the slope and −0.5–26 for the y-intercept.
The greatest losses are associated with the nitrates extraction process with hot water, although such losses are according to the defined requirements (between 60 and 120%, for a concentration range of 0–500 mg kg−1) (European Community, Citation2006a).
3.3. Analysis of baby foods
The optimized and validated CRM was applied for nitrate analysis in baby food samples. Nitrate concentration of target samples is present in Figure .
Figure 3. Nitrate levels in meat-based foods, fish-based foods, vegetables-based foods, and fruit-based foods
In the present study, we didn’t observe higher nitrate levels in vegetable-based baby foods than the legislated value (200 mg kg−1), which may be due to the small number of these baby foods because there are few brands and products (meat, fish, vegetables, and fruits) intended for child consumption in Portuguese supermarkets. Furthermore, most of the brands did not present in their composition, the green vegetables with more concentration in nitrates, such as lettuce, watercress, and spinach (EFSA, Citation2010; Hardisson, Gonza, Padron, Frias, & Reguera, Citation1996; Santamaria, Citation2006). The dominant green vegetable in meat-based foods and fish-based foods are the peas and green beans, but the main vegetables in meat-based baby foods, fish-based baby foods, and vegetable-based baby foods are the potato and the carrots.
The majority of samples (87%) had nitrate concentration higher than LOQ (9.3 mg kg−1) and 13% of samples had nitrate concentration between LOD and LOQ (2.8–9.3 mg kg−1). This last group of samples belongs to the fruit-based baby foods. Occurrence studies showed a higher nitrate concentration in vegetable-based baby foods (61 ± 41 mg kg−1), followed by fish-based baby foods (39 ± 15 mg kg−1), meat-based baby foods (30 ± 19 mg kg−1), and fruit-based baby food (15 ± 10 mg kg−1), respectively. Considering totality of samples, the highest nitrate level was observed in some vegetable-based baby-foods with a maximum of 129 mg kg−1 nitrate and the lowest nitrate level was observed in a fruit-based food (3.8 mg kg−1).
There wasn’t a correspondence between nitrate concentration of samples and their brand, and within each brand, there is not a relationship between nitrate levels and the type of vegetable, fruit, meat, or fish.
Analysis of variance (ANOVA) showed significant differences between nitrate levels of baby food samples (p = 0.000877). However, ANOVA showed no significant differences between nitrate levels of meat-based baby foods and fish-based baby foods (p > 0.05).
Nitrate values for fruit-based fruits were lower than vegetable-based baby foods, which is consistent with values below 10 mg kg−1 reported by EFSA (EFSA, Citation2010) and other Portuguese study (Vasco & Alvito, Citation2011). However, some samples with banana or strawberries had nitrates levels between 25 mg kg−1 and 31 mg kg−1. These values are consistent with the values obtained by other authors (Hardisson et al., Citation1996) that noted that fruit products containing bananas or strawberries showed a greater concentration of nitrates than others fruit products.
According to Alvito (Vasco & Alvito, Citation2011), nitrate level in baby foods was 108 ± 54 mg kg−1 and 15 mg kg−1 in vegetable-based foods and fruit-based foods, respectively. However, in our study, the mean nitrate level in vegetable-based foods was significantly lower (61 mg kg−1). These results regarding vegetable-based foods are consistent with the ones obtained in a region of Valencia, Spain (60.4 ± 38.6 mg kg−1) (Pardo-Marin, Yusa-Pelecha, Villalba-Martin, & Perez-Dasi, Citation2010), but they are lower than those obtained in Spain (Hardisson et al., Citation1996) and in Estonia (Tamme et al., Citation2006), where mean levels of 92 and 88 mg kg−1 were reported, respectively. Tamme and collaborators (Tamme et al., Citation2006) detected the highest levels in baby foods containing carrot and pumpkin (62–148 and 124–162 mg kg−1, respectively).
There are no consumption data for this kind of baby foods. However, these baby foods (processed foods) are made for a substitution of a meal. Therefore, one bottle represents a meal and usually, the main meals are made at lunch (until six month), and in both meals, lunch and dinner (after 8 months). Thus, the worst scenario is two meals of bottled foods per day.
The methodology to obtain the resultant risk is a deterministic one, using mean levels and mean consumption data as point of departure, and the number of meals with processed baby foods necessary to reach the ADI levels was determined.
If a four-month-old infant with 6.5 kg of body weight eats 200 g of a vegetable-based baby food with a mean nitrates level of 61 mg kg−1, it will represent approximately 51 % of the ADI (3.7 mg kg−1 body weight day−1). However, for the same meal for an eight-month-old infant with 11 kg of body weight, it will represent approximately 30% of the ADI. As a result, the nitrate daily meal with toxicity risk for these children represents 24 and 39 mg day−1 for a four and eight-month-old infant, respectively. A daily intake of around 394 g (about 2 meals of 200 g) and 516 g (about 2.5 meals of 200 g) is necessary to induce toxic effects in infants of four months and eight months, respectively.
However, the available data indicate that methemoglobin (MetHb) is not elevated in children or infants above 3 months old when exposure to nitrate from drinking water or from vegetables is below at least 15 mg kg−1 body weight per day (EFSA, Citation2010). For this value, the vegetable-based baby food for an infant of four and eight months old, it will represent approximately 13% and 10% of the ADI, respectively. Again, these estimated exposures are not likely to be of health concern.
If the infants make a meat-based meal, it will represent approximately 25 % and 19% of the ADI. If the infants make a fish-based meal, it will represent approximately 32 % and 25% of the ADI. A daily intake of around 802 g (about 4 meals of 200 g) and 1048 g (about 5 meals of 200 g) of meat-based baby food, and 617 g (about 3 meals of 200 g) and 806 g (about 4 meals of 200 g) of meat-based baby food is necessary to induce toxic effects in infants of four months and eight months, respectively. Thus, these levels of nitrate in meat-based and fish-based baby food are not a health concern.
As the concentration of nitrates in fruit-based baby foods is much lower than the other baby foods, they are also not a health concern. A fruit-based meal will represent approximately 12% and 10% of the ADI.
4. Conclusions
The infant food producers must pay more attention to the type (vegetables, meat, fish, or fruit) and quality of raw materials. Nitrate content analyses should be added as compulsory tests to the quality assurance programs.
The colorimetric method described in this study is adequate for the nitrate analysis of baby foods and fulfills the validation criteria and quality control purposed for these procedures.
The concentrations of nitrates in all analyzed samples are below the acceptable daily intake (ADI = 3.7 mg kg−1 body weight day−1), indicating that individually, these baby foods are not able to induce nitrate toxicity in the infant population.
Although the main infant exposure to nitrate is through the consumption of vegetable-based foods, it should be highlighted that for the total nitrate daily intake, the contribution of water and other products (meat-based foods, fish-based foods, and fruit-based foods) must be taken into account.
As such, future studies combining various exposure routes would be effective in determining nitrates exposure.
Cover image
Source: Authors.
Acknowledgements
The authors greatly acknowledge the technical assistance of the Bromatology and Water Quality, Faculty of Pharmacy, Lisbon, who helped this work and to Universidade de Lisboa/Fundação Amadeu Dias (UL/FAD) for this grant. Especially thanks to LALA for their assistance in ion chromatography.
Additional information
Funding
Notes on contributors
Cristina M. M. Almeida
João Sebastião was a student of Faculty of Pharmacy of University of Lisbon and he finished his course in 2014. This work was made in 2010–2011, after he won a research grant “Bolsa Amadeu Dias” in the area of infant feeding with a project designed by Cristina Almeida (Corresponding author).
Her research and expertise are in the analytical area, mainly in the analysis of organic compounds in water and food matrices by several chromatographic techniques (GC, HPLC, UPLC), mass spectrometry (single quadrupole and triple quadrupole), FTIR, and molecular absorption spectrophotometry. These methods are preceded by several sample preparation techniques, such as LLE, SPE, SPME, purge and trap, headspace system, Soxhlet extraction, and QuEChERS. In the field of the food contaminants, she implemented and validated several analytical methods and participated in several Portuguese occurrence studies, such as mycotoxins (patulin, aflatoxins, and ochratoxin) and fluorides in baby food.
References
- Casanova, J. , Gross, L. , McMullen, S. , & Schenck, F. (2006). Use of Griess reagent containing vanadium(III) for post-column derivatization and simultaneous determination of nitrite and nitrate in baby food. Journal of Aoac International , 89 , 447–451.
- Clesceri, L. , Greenberg, A. , & Eaton, A. (2005). Standard methods for the examination of water and wastewater (21st ed.). Washington, DC: American Public Association.
- Consalteri, A. , Rigato, A. , Clamor, L. , & Giandon, P. (1992). Determination of nitrate in vegetables using an ion-selective electrode. Journal of Food Composition and Analysis , 5 , 252–256. doi:10.1016/0889-1575(92)90044-K
- European Community . (1992). Opinion on nitrate and nitrite ( Reports of the scientific committee for food, 26th Series, pp. 21–28). Luxembourg: Office for Official Publications of the European Communities. Retrieved from http://ec.europa.eu/food/fs/sc/scf/reports/scf_reports_26.pdf .
- European Community . (1997). Nitrates and Nitrites (Reports of the Scientific Committee for Food). Brussels Luxembourg: Office for Official Publications of the European Communities. Retrieved from http://ec.europa.eu/food/fs/sc/scf/reports/scf_reports_38.pdf
- European Community . (2006a). Laying down methods of sampling and analysis for the official control of the levels of nitrates in certain foodstuffs. Official Journal of the European Union , L364 , 25–31. Retrieved from http://eur-lex.europa.eu/legal-content/EN/ALL/?uri=CELEX:32006R1882
- European Community . (2006b). Commission Regulation (EC) No. 1881/2006 of 19 December 2006 setting maximum levels for certain contaminants in foodstuffs (European Commission). Official Journal of the European Communities , L364 , 5–24.
- European Commission . (1997). Opinion on nitrate and nitrite ( Reports of the Scientific Committee for Food, 38th Series, pp. 1–33).
- European Food Safety Authority . (2003). Opinion of the scientific panel on biological hazards on a request from the commission related to the effects of nitrites/nitrates on the microbiological safety of meat products. EFSA Journal , 14 , 1–34.
- European Food Safety Authority . (2008). Nitrate in vegetables—Scientific opinion of the panel on contaminants in the food chain. The EFSA Journal , 689 , 1–79.
- European Food Safety Authority (2010). EFSA panel on contaminants in the food chain (CONTAM); scientific opinion on possible health risks for infants and young children from the presence of nitrates in leafy vegetables. EFSA Journal , 8 , 1935. doi:10.2903/j.efsa.2010.1935. Retrieved from www.efsa.europa.eu/efsajournal.htm
- Erdogan, B. , & Onar, A. (2012). Determination of nitrates, nitrites and oxalates in kale and sultana pea by capillary electrophoresis. Journal of Food and Drug Analysis , 20 , 532–538. doi:10.6127/jfda.2012200215
- Fewtrell, L. (2004). Drinking-water nitrate, methemoglobinemia, and global burden of disease: A discussion. Environmental Health Perspectives , 112 , 1371–1374. doi:10.1289/ehp.7216
- Food and Agriculture Organization of the United Nations/World Health Organization . (2003). Nitrate (and potential endogenous formation of N-nitroso compounds) ( WHO Food Additive series 50). Geneva: World Health Organisation.
- Greer, F. , Shannon, M. , & Committee on Nutrition, Committee on Environmental Health . (2005). Infant methemoglobinemia: The role of dietary nitrate in food and water. Pediatrics , 116 , 784–786. doi:10.1542/peds.2005-1497
- Hardisson, A. , Gonza, A. , Padron, A. , Frias, I. , & Reguera, J. (1996). The evaluation of the content of nitrates and nitrites in food products for infants. Journal of Food Composition and Analysis , 9 , 13–17. doi:10.1006/jfca.1996.0003
- Hsu, J. , Arcot, J. , & Alice Lee, N. (2009). Nitrate and nitrite quantification from cured meat and vegetables and their estimated dietary intake in Australians. Food Chemistry , 115 , 334–339. doi:10.1016/j.foodchem.2008.11.081
- International Organization for Standardization . (1990). Water quality—Calibration and evaluation of analytical methods and estimation of performance characteristics. Part 1: Statistical evaluation of the linear calibration function . ISO 8466-1: Geneva.
- Kersting, M. , Alexy, U. , Sichert-Hellert, W. , Manz, F. , & Schöch, G. (1998). Measured consumption of commercial infant food products in German infants: Results from the DONALD study. Journal of Pediatric Gastroenterology and Nutrition , 27 , 547–552.10.1097/00005176-199811000-00011
- McMullen, S. , Casanova, J. , Gross, L. , & Schenck, F. (2005). Ion chromatographic determination of nitrate and nitrite in vegetable and fruit baby foods. Journal of AOAC International , 88 , 1793–1796.
- Moorcroft, M. , Davis, J. , & Compton, R. (2001). Detection and determination of nitrate and nitrite: A review. Talanta , 54 , 785–803. doi:10.1016/S0039-9140(01)00323-X
- Pandelova, M. , Lopez, W. , Kasham, S. , Leclercq, C. , Piccinelli, R. , & Schramm, K. (2009). Assessment of energy intake of infants exclusively fed with infant formulae available on the European market. International Journal of Food Sciences and Nutrition , 60 , 212–219. doi:10.1080/09637480903183495
- Pardo-Marin, O. , Yusa-Pelecha, V. , Villalba-Martin, P. , & Perez-Dasi, J. (2010). Monitoring programme on nitrates in vegetables and vegetable-based baby foods marketed in the Region of Valencia, Spain: Levels and estimated daily intake. Food Additives and Contaminants Part A-Chemistry Analysis Control Exposure & Risk Assessment , 27 , 478–486. doi:10.1080/19440040903439804
- Piccinelli, R. , Pandelova, M. , Le Donne, C. , Ferrari, M. , Schramm, K. , & Leclercq, C. (2010). Design and preparation of market baskets of European Union commercial baby foods for the assessment of infant exposure to food chemicals and to their effects. Food Additives and Contaminants Part A-Chemistry Analysis Control Exposure & Risk Assessment , 27 , 1337–1351. doi:10.1080/19440049.2010.489913
- Phillips, W. (1971). Naturally occurring nitrate and nitrite in foods in relation to infant methaemoglobinaemia. Food and Cosmetics Toxicology , 9 , 219–228. doi:10.1016/0015-6264(71)90307-5
- Sanchez-Echaniz, J. , Benito-Fernandez, J. , & Mintegui-Raso, S. (2001). Methemoglobinemia and consumption of vegetables in infants. Pediatrics , 107 , 1024–1028. doi:10.1542/peds.107.5.1024
- Santamaria, P. (2006). Nitrate in vegetables: Toxicity, content, intake and EC regulation. Journal of the Science of Food and Agriculture , 86 , 10–17. doi:10.1002/jsfa.2351
- Tamme, T. , Reinik, M. , Roasto, M. , Juhkam, K. , Tenno, T. , & Kiis, A. (2006). Nitrates and nitrites in vegetables and vegetable-based products and their intakes by the Estonian population. Food Additives and Contaminants , 23 , 355–361. doi:10.1080/02652030500482363
- van Trijp, J. , & Roos, A. H. (1991). RIKILT-DLO, Model for the calculation of calibration curves ( RIKILT Report 91.02). Wageningen: RIKILT-Institute of Food Safety.
- Vasco, E. , & Alvito, P. (2011). Occurrence and infant exposure assessment of nitrates in baby foods marketed in the region of Lisbon, Portugal. Food Additives & Contaminants Part B-Surveillance , 4 , 218–225. doi:10.1080/19393210.2011.611951
- World Health Organization . (2004). Guidelines for drinking water quality . Geneva: Author.
- Zeman, C. (2005). Infant methemoglobinemia: Causative factors—Reply. Environmental Health Perspectives , 113 , A806–A806.