
Abstract
Fourier transform infrared spectroscopy based on attenuated total reflectance sampling technique, combined with multivariate analysis methods was used to monitor the adulteration of pure sunflower oil (SO) with thermally deteriorated oil (TDO). Contrary to published research, in this work, SO was thermally deteriorated in the absence of foodstuff. SO samples were exposed to temperatures between 125 and 225°C from 6 to 24 h. Quantification of adulteration of SO with TDO, based on principal components regression (PCR), partial least squares regression (PLS-R), and linear discriminant analysis (LDA) applied to mid-infrared spectra and to their first and second derivatives is reported for the first time. Infrared frequencies associated with the biochemical differences between TDO samples deteriorated in different conditions were investigated by principal component analysis (PCA). LDA was effective in the twofold classification presence/absence of TDO in adulterated SO (with 5% V/V of less of TDO). It provided 93.7% correct classification for the calibration set and 91.3% correct classification when cross-validated. A detection limit of 1% V/V of TDO in SO was determined. Investigation of an external set of samples allowed the evaluation of the predictability of the models. The regression coefficient (R 2) for prediction was 0.95 and 0.96 and the RMSE was 2.1 and 1.9% V/V when using the PCR or PLS-R models, respectively, and the first derivative of spectra. To the best of our knowledge, no investigation of adulteration of SO with TDO based on PCR, PLS-R, and LDA has been reported so far.
Public Interest Statement
Analysis of the quality and purity of edible oils, such as sunflower oil (SO), is of great importance. Adulteration of pure SO with either thermal-degraded used oils or with toxic mineral oils can have great economic and social impact and is a serious public health problem because harmful substances are delivered to the organism of unwary consumers.
Several techniques can be used to analyze the adulteration of pure edible oils with thermal-degraded oils, such as mass spectrometry-based methodologies. Absorption spectroscopy in the visible, near-infrared, or in the mid infrared has enormous advantages over classical methods as they provide real-time analysis.
In this work, infrared spectroscopy combined with statistical techniques was used to develop methodologies for the quantitative analyses of mixtures of sunflower oil with thermal-degraded SO oil in order to predict the adulteration level.
1. Introduction
Although edible oils (EO) are very stable foodstuff, autoxidation takes place leading to hydroperoxides, usually called primary oxidation products. Later, the breakdown of these compounds leads to alcohols, aldehydes (mainly responsible for flavors and odors), ketones, lactones, hydrocarbons, fatty acids (secondary and tertiary oxidation products), and, in the last stage, the polymerization products is observed (Frankel, Citation2010).
Uncooked EO keep all their nutritional components, such as vitamins, essential fatty acids, and antioxidants. However, EO are frequently used for baking, cooking, and deep frying. The latter is a popular method of food preparation, either at home, in traditional or in fast food restaurants. During frying, the oils change color and thicken and acquire an unpleasant taste and odor (Sanibal & Mancini-Filho, Citation2004).
Due to the high temperature and absorption of oxygen and water during deep frying, EO in general, and sunflower oil (SO) in particular (Aladedunye & Przybylski, Citation2014), suffer a wide range of reactions, namely, hydrolysis, oxidation, isomerization, and polymerization, especially if the process is repeated and lasts for long time (Allouche, Jiménez, Gaforio, Uceda, & Beltrán, Citation2007; Brühl, Citation2014; Gómez-Alonso, Fregapane, Salvador, & Gordon, Citation2003). Consequently, numerous categories of products are produced (Sanibal & Mancini-Filho, Citation2004). These reactions lead to an increase in polar substances, decomposition of essential fatty acids, and in an increase in trans isomers (Moya Moreno, Olivares, Lopez, Adelantado, & Reig, Citation1999). The deterioration substances formed during frying have nutritional and toxicological consequences in human health (Stender & Dyerberg, Citation2004). Therefore, frying oils have to be substituted before substantial deterioration has taken place.
Analysis of the EO quality and purity is of great importance and has been the subject of research of several authors (Bendini, Cerretani, Di Virgilio, Belloni, Bonoli-Carbognin, & Lercker, Citation2007). Adulteration of pure EO either with low-priced oils, with toxic mineral oils, or with deteriorated used oils can have great economic and social impact and is a serious public health problem. Adulteration results in the integration of harmful substances to the human organism, supplied to unwary consumers (Rossell, Citation2001).
Several methods were developed to determine the deterioration threshold of frying oils, such as the measurement of free fatty acids, total polar compounds, alkaline materials, anisidine, peroxide values, and mono- and diglycerides (Sanibal & Mancini-Filho, Citation2004; Stier, Citation2001). However, most of these methods have the disadvantage of being expensive, time consuming, unsuitable for online monitoring, and do not provide results in a short-time interval. Therefore, the development of accurate, inexpensive, and real-time methods of frying oil deterioration monitoring is useful in the food industry.
Optical techniques, such as Raman, fluorescence, and absorption spectroscopy, are reagentless, non-destructive analytical techniques having an increasing number of application in the study of foodstuff (Gouvinhas, Machado, Carvalho, de Almeida, & Barros, Citation2015; Machado et al., Citation2014). Namely, near-infrared (NIR) and Fourier transform infrared (FTIR) spectroscopy found application across a wide range of fundamental (Movasaghi, Rehman, & Rehman, Citation2008) and applied sciences (De Luca, Oliverio, Ioele, & Ragno, Citation2009) and production lines in industry (Gouvinhas, de Almeida, Carvalho, Machado, & Barros, Citation2015; Roggo et al., Citation2007).
FTIR-ATR (Attenuated Total Reflection) technique is one of the most common analytical techniques found in research laboratories and in the industry (Romera-Fernández et al., Citation2012). It has been employed as a rapid tool for the identification and quantification of relevant compounds in food products, namely, in EO (Vlachos et al., Citation2006), meat, fish, beer, fruit juices, among others (Karoui, Downey, & Blecker, Citation2010).
FTIR spectroscopy has been used to monitor the thermal deterioration of EO, such as sunflower and canola oils, and to study the kinetics of olive oil deterioration (Román Falcó, Grané Teruel, Prats Moya, & Martín Carratalá, Citation2012; Tena, Aparicio, & García-González, Citation2009). Thermal stability between 30 and 170°C of EO (colza, corn, SO, soybean and olive oils) was evaluated by ultraviolet–visible (UV–vis) spectroscopy (Gonçalves, Março, & Valderrama, Citation2014) and by FTIR spectroscopy using direct heating of oil samples on an ATR diamond crystal (SO, olive and canola oils) (Pinto, Locquet, Eveleigh, & Rutledge, Citation2010). A review of other experimental procedures employed for the study of EO thermal deterioration was presented by Pinto et al. (Citation2010). However, there are few publications targeted to the authentication of edible vegetable oils adulterated with used frying oils.
An FTIR-based systematic analysis of adulteration of corn, peanut, rapeseed, and soybean oils with used frying oil of unknown origin and characteristics was reported recently (Zhang et al., Citation2012). Area ratio between two absorption band and wavenumber shift of a specific band was treated by linear regression. For this four adulteration types, the limit of detection for the area ratio was 6.6, 7.2, 5.5, and 3.6% and for the wavenumber shift was 8.1, 9.0%, 6.9, and 5.6. Also, it was published recently a low-field nuclear magnetic resonance (LF-NMR)-based study on discrimination of edible vegetable oil adulteration with used frying oil. The work focused on discrimination of the adulteration of commercial corn, peanut, rapeseed, and soybean oils with two kinds of used frying oils (collected in restaurants) (Zhang, Saleh, & Shen, Citation2013)
The purpose of the present work was to study the adulteration of SO with thermally deteriorated sunflower oil (TDO), filling the gap in the literature. Contrary to published work, the SO in this work was thermally deteriorated without contact with any foodstuff. Specifically, the objective was to develop and validate a methodology based on FTIR-ATR spectroscopy combined with principal components regression (PCR) and partial least squares regression (PLS-R), aiming to predict the adulteration level of SO with TDO in different conditions.
2. Material and methods
2.1. Sample preparation
Five brands of commercial pure SO was purchased from local producers which were contacted and asked to supply pure cold press SO to be used in research. They were delivered to us one month after production in the dark glass bottles. Aliquots of these oils were subjected to thermal deterioration using a range of different conditions and mixed with pure SO as described below and organized in three sets (Set A, B, and C).
Set A was intended to make a qualitative exploratory analysis of thermally deteriorated SO using multivariate analysis. Set B was planned develop a quantitative model for the prediction of adulteration of SO with TDO. Four of the five oils brands (arbitrarily selected) were used to prepare SO aliquots with different concentrations of TDO, constituting the so-called “calibration set,” i.e. a set of samples used to build and validate the PCR and PLS-R models. Set C was formed with the remaining brand of SO and was used to prepare a set of aliquots to test the predictability of the PCR and PLS-R methods, referred below as the “external set”.
Set A was constituted by aliquots produced by heating the five brands of SO at 125, 150, 175, and 225°C for 6 h and at 200°C for 6 and 24 h.
In order to create Set B and Set C, a volume of ~350 ml of each one of the five SO brands was heated at 200°C for 24 h, giving rise to five varieties of TDO.
Set B was prepared by randomly mixing TDO with pure SO from 0.5 to 10% in 0.5% steps and from 11 to 20% in 1% steps (total of 30 sampling points) using a Vortex mixer (model ZX3, Neu-TEC Group Inc, USA) to ensure total homogenization. Set B was assembled using four SO brands and four varieties of TDO (both randomly chosen). For each sampling point of Set B, four samples were produced: one out of the four TDO varieties was randomly selected and mixed with the four virgin SO brands. The infrared (IR) absorption spectra of 128 samples (120 SO/TDO, 4 virgin SO and 4 TDO) were measured.
Set C (the “external set”) was gathered by mixing the remaining SO with the fifth TDO (prepared using a different SO brand), therefore creating an external set of 32 samples (30 SO/TDO, 1 virgin SO and 1 TDO).
Pure SO samples were preserved in the original package and both TDO and mixed samples were stored in small polyethylene terephthalate flasks.
2.2. FTIR-ATR measurement
Infrared spectra were collected in a “Unicam Research Series” FTIR spectrometer equipped with a single reflection “Golden Gate” ATR module, a DLaTGS detector and a KBr beamspliter. The equipment is connected to computer and controlled by WinFirst software - v1.1.
FTIR-ATR measurements were performed by pipetting a small drop (~1 μl) of edible oil on top of the ATR baseplate, which was kept at 30°C. We calculate that the evanescent field was probing a depth of approximately 2.0 μm. All IR spectra were recorded from 500 to 4,000 cm−1, co-adding 128 interferograms at a resolution of 4 cm−1. The collection time for each sample spectrum was approximately 2 min. These spectra were subtracted against background air spectrum. After every scan, a new background spectrum was taken. The ATR base was carefully cleaned in situ by scrubbing with ethanol and dried with soft tissue before measuring the next sample. The cleaning method was verified by collecting a background spectrum and compared to the previous one. These spectra were recorded as absorbance values at each data point. From each oil sample, five replicates were analyzed. Each measurement was repeated three times and averaged using the software that controls the equipment.
2.3. Treatment of spectral data
Baseline drifts of the spectra were corrected by using a fourth-order polynomial. Smoothing of the spectra was based on the Savitzky-Golay algorithm using a third-order polynomial and frames of seven points. Afterward, data were mean centered and standardized using the standard normal variate (SNV) transformation (Bendini, Cerretani, Di Virgilio, Belloni, Lercker, & Toschi, Citation2007; Nunes, Martins, Barros, Galvis-Sánchez, & Delgadillo, Citation2009). First and second derivatives were determined by the Savitzky–Golay method (De Luca et al., Citation2009).
2.4. Mathematical treatment of data-set
The IR spectral data can be considered as a multidimensional set of variables where each spectrum consists of hundreds of variables, corresponding to the absorbencies recorded at the different wavenumbers (cm−1). These data-sets were then analyzed by a multivariate analysis method as described below.
A PCA was applied to inspect differences between samples. The PCA transforms a large number of potentially correlated variables into a smaller number of uncorrelated variables (usually called principal components, PCs), and thus reduces the size of the data-set.
For preliminary qualitative analysis, principal components contributing to the variance of the data-set were subjected to a linear discriminant analysis (LDA) in an attempt to predict the likelihood of a sample belonging to a previously defined group. LDA is a statistical method used to find a linear combination of structures which characterizes or separates classes of objects or observations. The resulting arrangement may be used as a linear classifier or dimensionality reduction.
For quantitative analysis of adulteration, variables considerably contributing to the variance of the data-set were regressed using PCR and PLS-R (Miller & Miller, Citation2005). Both regression methods are used to model a response variable when a biological system is analyzed trough a large number of predictor variables that are highly correlated or even collinear (Marini, Bucci, Ginevro, & Magrì, Citation2009). They give rise to new predictor variables or factors (usually known as principal components (PC) in the context of PCR or latent variables in the case of PLS-R) that are linear combinations of the original predictor variables.
Those factors are calculated in different ways, PCR creates PC to explain the observed variability in the predictor variables, without considering the response variable. In PLS-R, the response variable is taken into account and, consequently, leads to models that can fit the response variable with fewer factors (Wentzell & Vega Montoto, Citation2003). Whether or not it ultimately translates into a useful model that depends on the specific biological system.
2.5. Model selection
The calibration methodology for quantification of the adulteration relied on two steps, so-called calibration and validation. In the calibration step, a mathematical model was built to establish a relation between the matrix of FTIR spectra (predictor variables) and the concentration of analytes of interest (response variables), using a set of observations usually named calibration set. In the validation step, the developed model was used to calculate the concentration of samples not used to set up the model (De Luca et al., Citation2009).
The relative performance of the established model is evaluated by the root mean square error of calibration (RMSEC), root mean square error of cross-validation (RMSECV), and multiple coefficient of determination or regression coefficient (R 2). The model selected is then used to determine the concentration of samples of an independent prediction set (or external set). The predictive ability of the model is evaluated from the root mean square of prediction (RMSEP). The lower the RMSEP value, the higher the degree of accuracy of the prediction result provided by the calibration model.
PCA, LDA, PCR, and PLS-R calculations were performed using the Excel-based “XLSTAT” V2006.06 package (Addinsoft, Inc, New York, USA) and statistical software “Unscrambler” V9.6 package (Camo, Oslo, Norway).
3. Experimental results and discussion
3.1. FTIR spectra analysis
Figure illustrates the measured FTIR spectra of oil samples subjected to temperatures from 125 to 225°C for 6 h in the range of 600–3,100 cm−1. All spectra appear to be very similar in this range of deterioration conditions; however, there are visible differences between spectra of TDO at 225°C for 6 h and SO. These small differences in relative absorbencies were used for qualitative classification and quantification of SO adulterated with TDO, as discussed below.
Figure 1. FTIR spectra of sunflower oil (SO) samples heated at temperatures ranging from 125 to 225°C for 6 h
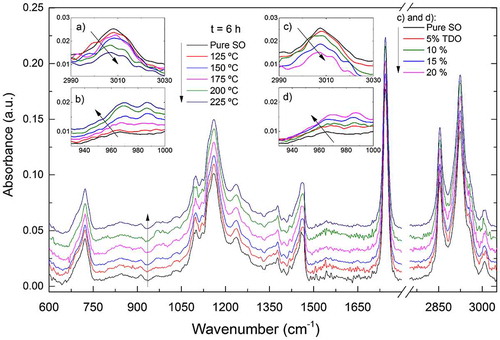
For quantitatively observing the oxidative deterioration of SO by thermal treatment, several IR bands can be motorized. The expression of oxidation products (hydroperoxides followed by carbonyl compounds) can be perceived by changes in the spectral regions from 3,100 to 3,700 cm−1 and from 1,700 to 1,800 cm−1, respectively. A decrease in peak absorbance at around 2,853 and 2,922 cm−1 due to C–H stretching vibration of aliphatic, CH3 and CH2, respectively, was observed.
For samples of Set A (heated from 125 to 225°C for 6 h) and of Set B (SO adulterated with 5, 10, 15 and 20% of TDO), Figure 1(a) and (c) shows the reduction in absorbance in the region between 2,990 and 3,030 cm−1, due to the stretching vibration of cis- double bond, respectively. Figure (b) and (d) shows the corresponding absorbance increase from 930 to 1,000 cm−1, due to bending vibration of trans- double bond. Fading of the cis- double bond of fatty acids and the appearance of trans- products occur in parallel, therefore, the oxidation process occurs alongside with cis/trans isomerization. Also, a decrease in peak absorbencies at around 1,655, 1,401, and 1,119 cm−1 and an increase at 1,635 and 1,418 cm−1 were observed. These spectral features were reported as being related to thermal deterioration of olive oil (Zhang et al., Citation2012).
3.2. Principal component analysis
Looking for an eventual relationship within samples of Set A, a matrix was built with its corresponding absorption spectra in order to run a preliminary PCA. Spectral regions that presented an overall low signal-to-noise ratio and were found to be susceptible to induce misclassification were left out of the analysis. In addition, during measurement, the laboratory atmosphere was not very stable and induced random spectral changes in the region between 1,800 and 2,750 cm−1. The collected spectra were divided in two regions: a first region from 600 to 1,800 cm−1 and a second from 2,750 to 3,050 cm−1.
It was found that the total variance of the data-set could be explained by 24 principal components, among which the first seven principal components, with eigenvalue higher than 1, explain approximately 89% of the total variance.
Communality is defined as the sum of the squared principal component loadings for all principal components for a given original variable. It is the variance in that variable accounted for by all the principal components. In other words, the communality measures the percentage of variance in a given variable explained by all the principal components together and may be interpreted as the consistency of the indicator (Abdi & Williams, Citation2010). The initial value of the communality in PCA is 1. According to (Stevens, Citation2002), a lower limit of 0.6 should be used. Small communalities values after extraction indicate variables that do not fit well the principal component solution and should be dropped from the analysis (Field, Citation2005).
Wavenumbers (variables) for which the communality value of each principal components out of the six was higher or equal to 0.6 were considered as meaningfully explaining the variance of the spectral data-set and were considered as potential wavenumbers associated with the biochemical variations occurring during the thermal deterioration process.
Frequency bands with peaks at 723, 969, 990, 1,037, 1,099, 1,117, 1,160, 1,234, 1,361, 1,385, 1,417, 1,463, 1,701, 1,745, 2,853, 2,922, 2,952, and 3,007 cm−1 were selected for a second PCA. The peak at 723 cm−1 is associated with a CH2 rocking mode, while the peaks at 1,099, 1,117, 1,160, and 1,234 cm−1 correspond to CO stretching vibration. The peak at 1,463 cm−1 is associated with a CH2 bending (scissoring) vibration and the peak at 1,376 cm−1 is ascribed to symmetrical bending of CH3. A large peak at 1,745 cm−1 is responsible for the CO stretching vibrations. Symmetric and asymmetric stretching vibrations of CH2 are caused by the absorbance at 2,853 and 2,922 cm−1, respectively (Downey, Citation1998; Guillén & Cabo, Citation1997; Lerma-García, Ramis-Ramos, Herrero-Martínez, & Simó-Alfonso, Citation2010).
The first principal component (F1) explained 66.85% variance, while the second (F2) explained 28.38%; therefore, approximately 95.23% of variance can be described by only two principal components. According to the observation diagram shown in Figure , each oil sample occupies a different position in the F1/F2 plane, thus, leading to the conclusion that PCA allows qualitative discrimination between samples deteriorated in wide range of different conditions. It should be noticed that a cluster of pure SO samples occupy a distinct position on the F1/F2 plane.
Figure 2. Observation diagram of a principal component analysis for the differentiation of sunflower oil (SO) samples deteriorated using a set of different conditions using FTIR-ATR spectral data
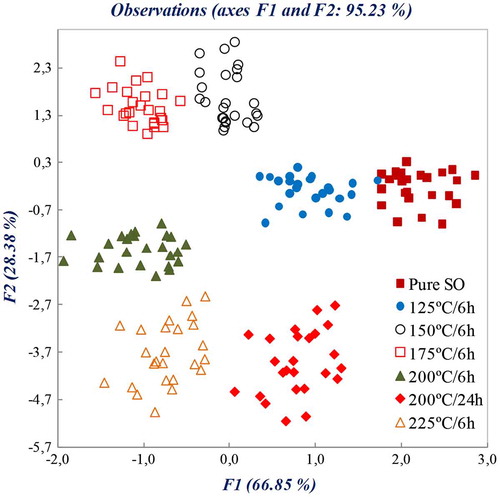
The loading reveals that the wavenumbers 969 and 3,007 cm−1 have a high contribution to the formation of principal components F1 and F2. These frequencies correspond to the bending and stretching vibrations referred above, characteristic of oil deterioration.
3.3. SO/TDO adulteration discrimination by supervised analysis
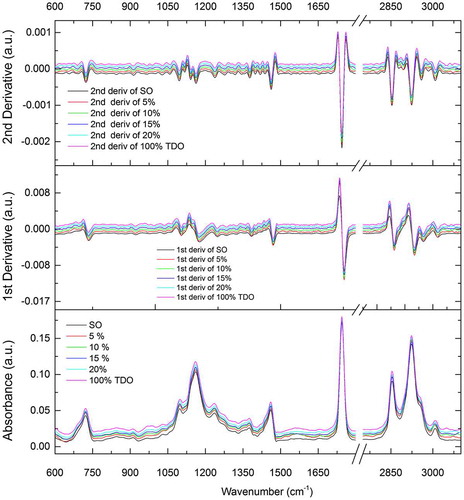
Representative measured spectra from 600 to 3,100 cm−1, together with its first and second derivatives are shown in Fig. for SO, TDO (200°C/24 hours), and SO adulterated with 5, 10, 15, and 20% of TDO (part of Set B).
Figure 3. Measured spectra together with its first and second derivatives for sunflower oil (SO) samples, thermally deteriorated sunflower oil (TDO, 200°C/24 h), and SO adulterated with 5, 10, 15, and 20% of TDO (sub-set of Set B)
With the goal of determining the possibility of using IR spectral data to discriminate between pure SO and SO adulterated with small percentages of TDO, a sub-set of Set B constituted by SO samples adulterated with 5% or less of TDO, pure SO, and TDO was classified by LDA, using the absorbencies at the aforementioned set of 17 frequencies, based on the known classification of each sample as SO/TDO, SO, or TDO, constituting the dependent variable.
The observation diagram represented in Figure is defined by discriminant factors DF1 and DF2, which explained the total variance. The TDO samples are positioned in the lower right side of the plot opposed to the SO samples located in the upper left side of the diagram. The classification in Table , resulting from LDA, provided 93.7% correct classification for the calibration set and 91.3% correct classification when cross-validated. A high degree of correct classification after cross-validation was achieved for SO/TDO, with only 6 out of 200 SO/TDO samples being classified as SO. Those samples had concentrations of 0.5 and 1% V/V of TDO. Thus, LDA allows the possibility to categorize SO samples according to presence/absence of TDO in concentrations smaller than 5%, the limit of detection being 1% V/V.
Figure 4. Similarity map as determined by discriminant analysis using factors DF1 and DF2 for FTIR-ATR spectral data of pure sunflower oil (SO), thermally deteriorated sunflower oil (TDO), and SO mixed with thermally deteriorated sunflower oil (SO/TDO) (samples with less than 5% of TDO deteriorated at 200°C for 24 h)
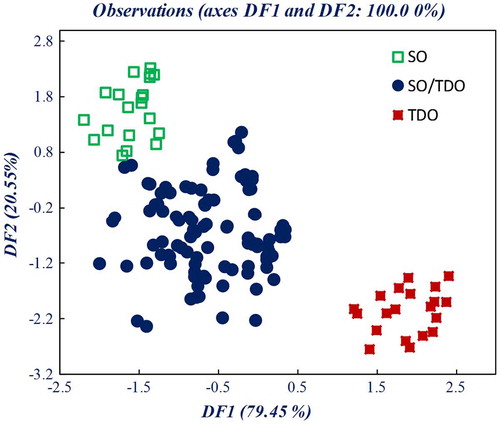
Table 1. Confusion matrix for the classification of pure SO, TDO, and SO/TDO (samples with less than 5% of TDO). Results for calibration and cross-validation. Observed classifications in the rows. Predicted classifications in columns
3.4. Model for prediction of SO adulterated with TDO based on FTIR spectral data
In the PCR, PLS-R, and calibration models, the evaluation of the methods linearity was carried out in order to establish a proportional relationship between predictor variables (absorbencies) and the concentration of TDO in pure SO.
PLS regression method is able to collect information from large spectral intervals, correlating changes therein to the concentration of specific constituents, and concomitantly consider other possible contributions to these changes not related to the sample constitution (Cheman, Syahariza, Mirghani, Jinap, & Bakar, Citation2005). On the other way, in PCR method, the spectral and concentration information are incorporated into the model in one step (Smith, Citation2002).
The quality of the fitting was scrutinized by the root mean square error of calibration (RMSEC), multiple coefficient of determination, or regression coefficient (R 2, where R is the correlation factor) and by the root mean square error of cross validation (RMSECV) (Wang, Lee, Wang, & He, Citation2006). The optimum number of factors, either for PCR and PLS-R models, was determined using leave-one-out cross-validation (LOOCV) method. This is done by plotting the number of factors against the RMSECV, and from this, the optimum number of factors is selected for both PCR and PLS-R models. The optimum number of factors is the one that minimizes the RMSECV (Naes et al., Citation2002). The capability of the models to predict the concentration of TDO in SO for external samples was inspected by the RMSEP.
The results achieved for the PCR and PLS-R calibrations models of concentration of TDO in terms of R 2, RMSEC, RMSECV, and RMSEP, either for normal spectra and its first and second derivatives are presented in Table . The high value of R 2 and the lowest of RMSEC, RMSECV, and RMSEP indicate good performance and precision of the models. Furthermore, to obtain a good calibration model, the number of regression factors used should be the lowest as possible (Smith, Citation2002). A model build with such high number of factor would lead to over fitting, conducting to a very low RMSE value for the calibration samples but would give rise to high values of RMSE for an external set of samples. Table also shows the number of factors that minimizes the RMSECV for PCR and PLS-R.
Table 2. Principal component regression (PCR) and partial least squares regression (PLS-R) models-based calibrations for quantification of adulteration of SO with TDO using standard normal variate (SNV) spectral data and its first and second derivatives
The multivariate calibrations showed the highest value of R 2 and the lowest of RMSEP value when using the first derivative of the spectral data. Figure (a) and (b) show the plot of the measured concentrations of TDO against the predicted values based on absorbencies for PCR and PLS-R regression models, respectively, which illustrates the quality of the models established in this work. In general, PLS-R offers enhanced results compared to others regression methods, such as PCR (Liang & Kvalheim, Citation1996) or multiple linear regression (MLR) for quantitative analysis of concentration of analytes (Wentzell & Vega Montoto, Citation2003).
Figure 5. Quality of the models for the relationship between measured concentration of thermally deteriorated sunflower oil (TDO) in pure sunflower oil (SO) samples and predicted values based on FTIR spectra: (a) PCR model and (b) PLS-R model, using first derivative of spectral data
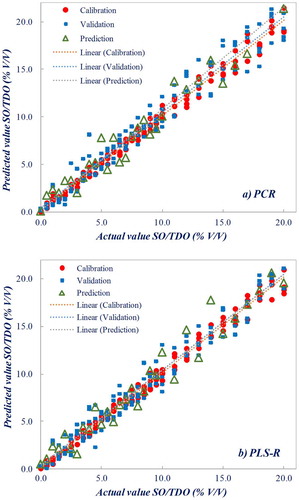
The relationship between measured values of TDO concentration and predicted values based on FTIR absorbencies shows R 2 values ranging from 0.91 to 0.96 after cross-validation and from 0.90 to 0.96 when using Set C of samples (external set, used for prediction). The higher difference of R 2 values between calibration and prediction sets was 0.14 (~17%), for the PLS-R model, using the second derivative. The RMSEP is as low as 1.9% V/V when using the first derivative and a PLS-R model with three factors. A fairly higher value of 2.1% V/V was attained for a four-factor PCR model. The greater difference of the RMSE value between calibration and prediction sets was 0.60 (~28%), for the PCR model, using the first derivative.
4. Conclusions
In this work, we presented a preliminary study of the applicability of FTIR-ATR spectroscopy in the prediction of the adulteration of sunflower oil with thermally deteriorated oil. PCR and PLS-R multivariate regression techniques were found suitable for the establishment of a practical experimental methodology.
Using PCA, we were able to establish the most informative wavenumbers that provide distinction between thermal deterioration conditions used in this work. Furthermore, LDA was able to differentiate between pure SO and SO adulterated with 5% V/V or less of TDO. Using LDA methodology, a detection limit of 1% V/V was established.
Assessment of the predictability of the models was achieved by the analysis of a set of external samples. A value for the RMSE of prediction of 1.9% V/V was obtained for a three-factor PLS-R model based on the first derivative of spectral data.
In conclusion, FTIR spectroscopy combined with PLS-R applied to the first derivative of spectral data is reliable technique for the discrimination and quantification of TDO in SO.
Cover image
Source: Authors
Additional information
Funding
Notes on contributors
José Manuel Marques Martins de Almeida
José Manuel Marques Martins de Almeida graduated in Applied Physics (Optics and Electronics) (1987) and has a PhD (1998) by University of Porto, Portugal. Since 2000, he has the position of associate professor at the Department of Physics, Universidade de Trás os Montes e Alto Douro, Portugal and has Habilitation (2006) from the same University. Currently, he is a senior researcher in the Centre for Applied Photonics at INESC-TEC, Porto, Portugal. His present research interests include absorption and Raman spectroscopy and optical biosensors based on optical fibers for application in the food industry and life sciences.
References
- Abdi, H. , & Williams, L. J. (2010). Principal component analysis. Wiley Interdisciplinary Reviews: Computational Statistics , 2 , 433–459.
- Aladedunye, F. , & Przybylski, R. (2014). Performance of palm olein and modified rapeseed, sunflower, and soybean oils in intermittent deep-frying. European Journal of Lipid Science and Technology , 116 , 144–152. doi:10.1002/ejlt.201300284
- Allouche, Y. , Jiménez, A. , Gaforio, J. J. , Uceda, M. , & Beltrán, G. (2007). How heating affects extra virgin olive oil quality indexes and chemical composition. Journal of Agricultural and Food Chemistry , 55 , 9646–9654. doi:10.1021/jf070628u
- Bendini, A. , Cerretani, L. , Di Virgilio, F. , Belloni, P. , Bonoli-Carbognin, M. , & Lercker, G. (2007). Preliminary evaluation of the application of the ftir spectroscopy to control the geographic origin and quality of virgin olive oils. Journal of Food Quality , 30 , 424–437. doi:10.1111/j.1745-4557.2007.00132.x
- Bendini, A. , Cerretani, L. , Di Virgilio, F. , Belloni, P. , Lercker, G. , & Toschi, T. G. (2007). In-process monitoring in industrial olive mill by means of FT-NIR. European Journal of Lipid Science and Technology , 109 , 498–504. doi:10.1002/ejlt.200700001
- Brühl, L. (2014). Fatty acid alterations in oils and fats during heating and frying. European Journal of Lipid Science and Technology , 116 , 707–715. doi:10.1002/ejlt.201300273
- Cheman, Y. B. , Syahariza, Z. A. , Mirghani, M. E. S. , Jinap, S. , & Bakar, J. (2005). Analysis of potential lard adulteration in chocolate and chocolate products using Fourier transform infrared spectroscopy. Food Chemistry , 90 , 815–819. doi:10.1016/j.foodchem.2004.05.029
- De Luca, M. , Oliverio, F. , Ioele, G. , & Ragno, G. (2009). Multivariate calibration techniques applied to derivative spectroscopy data for the analysis of pharmaceutical mixtures. Chemometrics and Intelligent Laboratory Systems , 96 , 14–21. doi:10.1016/j.chemolab.2008.10.009
- Downey, G. (1998). Food and food ingredient authentication by mid-infrared spectroscopy and chemometrics. TrAC Trends in Analytical Chemistry , 17 , 418–424. doi:10.1016/S0165-9936(98)00042-9
- Field, A. P. (2005). Discovering statistics using SPSS . London: Sage.
- Frankel, E. N. (2010). Chemistry of extra virgin olive oil: Adulteration, oxidative stability, and antioxidants. Journal of Agricultural and Food Chemistry , 58 , 5991–6006. doi:10.1021/Jf1007677
- Gómez-Alonso, S. , Fregapane, G. , Salvador, M. D. , & Gordon, M. H. (2003). Changes in phenolic composition and antioxidant activity of virgin olive oil during frying. Journal of Agricultural and Food Chemistry , 51 , 667–672. doi:10.1021/jf025932w
- Gonçalves, R. P. , Março, P. H. , & Valderrama, P. (2014). Thermal edible oil evaluation by UV–Vis spectroscopy and chemometrics. Food Chemistry , 163 , 83–86. doi:10.1016/j.foodchem.2014.04.109
- Gouvinhas, I. , de Almeida, J. M. M. M. , Carvalho, T. , Machado, N. , & Barros, A. I. R. N. A. (2015). Discrimination and characterisation of extra virgin olive oils from three cultivars in different maturation stages using Fourier transform infrared spectroscopy in tandem with chemometrics. Food Chemistry , 174 , 226–232. doi:10.1016/j.foodchem.2014.11.037
- Gouvinhas, I. , Machado, N. , Carvalho, T. , de Almeida, J. M. M. M. , & Barros, A. I. R. N. A. (2015). Short wavelength Raman spectroscopy applied to the discrimination and characterization of three cultivars of extra virgin olive oils in different maturation stages. Talanta , 132 , 829–835. doi:10.1016/j.talanta.2014.10.042
- Guillén, M. & Cabo, N. (1997). Characterization of edible oils and lard by fourier transform infrared spectroscopy. Relationships between composition and frequency of concrete bands in the fingerprint region. Journal of the American Oil Chemists Society , 74 , 1281–1286. doi:10.1007/s11746-997-0058-4
- Karoui, R. , Downey, G. , & Blecker, C. (2010). Mid-infrared spectroscopy coupled with chemometrics: A tool for the analysis of intact food systems and the exploration of their molecular structure-quality relationships—A review. Chemical Reviews , 110 , 6144–6168. doi:10.1021/cr100090 k
- Lerma-García, M. J. , Ramis-Ramos, G. , Herrero-Martínez, J. M. , & Simó-Alfonso, E. F. (2010). Authentication of extra virgin olive oils by Fourier-transform infrared spectroscopy. Food Chemistry , 118 , 78–83. doi:10.1016/j.foodchem.2009.04.092
- Liang, Y.-Z. , & Kvalheim, O. M. (1996). Robust methods for multivariate analysis—A tutorial review. Chemometrics and Intelligent Laboratory Systems , 32 (1), 1–10. doi:10.1016/0169-7439(95)00006-2
- Machado, M. , Machado, N. , Gouvinhas, I. , Cunha, M. , de Almeida, J. M. M. , & Barros, A. R. N. A. (2014). Quantification of chemical characteristics of olive fruit and oil of cv Cobrançosa in two ripening stages using MIR spectroscopy and chemometrics. Food Analytical Methods , 1–9. doi:10.1007/s12161-014-0017-2
- Marini, F. , Bucci, R. , Ginevro, I. , & Magrì, A. L. (2009). Coupling of IR measurements and multivariate calibration techniques for the determination of enantiomeric excess in pharmaceutical preparations. Chemometrics and Intelligent Laboratory Systems , 97 , 52–63. doi:10.1016/j.chemolab.2008.07.012
- Miller, J. N. , & Miller, J. C. (2005). Statistics and chemometrics for analytical chemistry . Edinburgh: Pearson.
- Movasaghi, Z. , Rehman, S. , & Rehman, I. U. (2008). Fourier transform infrared (FTIR) spectroscopy of biological tissues. Applied Spectroscopy Reviews , 43 , 134–179. doi:10.1080/05704920701829043
- Moya Moreno, M. , Olivares, D. M. , Lopez, F. J. A. , Adelantado, J. V. G. , & Reig, F. B. (1999). Analytical evaluation of polyunsaturated fatty acids degradation during thermal oxidation of edible oils by Fourier transform infrared spectroscopy. Talanta , 50 , 269–275.10.1016/S0039-9140(99)00034-X
- Naes, T. I., T. , Fearn, T. , & Davies, A. M. (2002). A user friendly guide to multivariate calibration and classification . London: NIR Publications.
- Nunes, A. , Martins, J. , Barros, A. , Galvis-Sánchez, A. , & Delgadillo, I. (2009). Estimation of olive oil acidity using FT-IR and partial least squares regression. Sensing and Instrumentation for Food Quality and Safety , 3 , 187–191. doi:10.1007/s11694-009-9084-2
- Pinto, R. C. , Locquet, N. , Eveleigh, L. , & Rutledge, D. N. (2010). Preliminary studies on the mid-infrared analysis of edible oils by direct heating on an ATR diamond crystal. Food Chemistry , 120 , 1170–1177. doi:10.1016/j.foodchem.2009.11.053
- Roggo, Y. , Chalus, P. , Maurer, L. , Lema-Martinez, C. , Edmond, A. , & Jent, N. (2007). A review of near infrared spectroscopy and chemometrics in pharmaceutical technologies. Journal of Pharmaceutical and Biomedical Analysis , 44 , 683–700. doi:10.1016/j.jpba.2007.03.023
- Román Falcó, I. P. , Grané Teruel, N. , Prats Moya, S. , & Martín Carratalá, M. L. (2012). Kinetic study of olive oil degradation monitored by Fourier transform infrared spectrometry. Application to oil characterization. Journal of Agricultural and Food Chemistry , 60 , 11800–11810. doi:10.1021/jf3035918
- Romera-Fernández, M. , Berrueta, L. A. , Garmón-Lobato, S. , Gallo, B. , Vicente, F. , & Moreda, J. M. (2012). Feasibility study of FT-MIR spectroscopy and PLS-R for the fast determination of anthocyanins in wine. Talanta , 88 , 303–310. doi:10.1016/j.talanta.2011.10.045
- Rossell, J. B. (2001). Frying, improving quality . Cambridge: Woodhead Publishing.10.1201/9781439822951
- Sanibal, E. A. A. , & Mancini-Filho, J. (2004). Frying oil and fat quality measured by chemical, physical, and test kit analyses. Journal of the American Oil Chemists Society , 81 , 847–852. doi:10.1007/s11746-004-0990-8
- Smith, B. C. (2002). 4–Multiple components II: Chemometric methods and factor analysis. In B. C. Smith (Ed.), Quantitative spectroscopy: theory and practice (pp. 125–179). Amsterdam: Academic Press.10.1016/B978-012650358-6/50005-1
- Stender, S. , & Dyerberg, J. (2004). Influence of trans fatty acids on health. Annals of Nutrition and Metabolism , 48 , 61–66. doi:10.1159/000075591
- Stevens, J. P. (2002). Applied multivariate statistics for the social sciences . Hillsdale, NJ: Erlbaum.
- Stier, R. F. (2001). The measurement of frying oil quality and authenticity. Frying: Improving Quality . Boca Raton, FL: CRC Press.
- Tena, N. , Aparicio, R. , & García-González, D. L. (2009). Thermal deterioration of virgin olive oil monitored by ATR-FTIR analysis of trans content. Journal of Agricultural and Food Chemistry , 57 , 9997–10003. doi:10.1021/jf9012828
- Vlachos, N. , Skopelitis, Y. , Psaroudaki, M. , Konstantinidou, V. , Chatzilazarou, A. , & Tegou, E. (2006). Applications of Fourier transform-infrared spectroscopy to edible oils. Analytica Chimica Acta , 574 , 459–465. doi:10.1016/j.aca.2006.05.034
- Wang, L. , Lee, F. , Wang, X. , & He, Y. (2006). Feasibility study of quantifying and discriminating soybean oil adulteration in camellia oils by attenuated total reflectance MIR and fiber optic diffuse reflectance NIR. Food Chemistry , 95 , 529–536. doi:10.1016/j.foodchem.2005.04.015
- Wentzell, P. , & Vega Montoto, L. (2003). Comparison of principal components regression and partial least squares regression through generic simulations of complex mixtures. Chemometrics and Intelligent Laboratory Systems , 65 , 257–279. doi:10.1016/S0169-7439(02)00138-7
- Zhang, Q. , Liu, C. , Sun, Z. , Hu, X. , Shen, Q. , & Wu, J. (2012). Authentication of edible vegetable oils adulterated with used frying oil by Fourier transform infrared spectroscopy. Food Chemistry , 132 , 1607–1613. doi:10.1016/j.foodchem.2011.11.129
- Zhang, Q. , Saleh, A. M. , & Shen, Q. (2013). Discrimination of edible vegetable oil adulteration with used frying oil by low field nuclear magnetic resonance. Food and Bioprocess Technology , 6 , 2562–2570. doi:10.1007/s11947-012-0826-5