
 ?Mathematical formulae have been encoded as MathML and are displayed in this HTML version using MathJax in order to improve their display. Uncheck the box to turn MathJax off. This feature requires Javascript. Click on a formula to zoom.
Abstract
Bun was prepared by blending wheat flour with de-oiled maize germ flour (DMGF) in different combinations. The different proportions of DMGF at 5, 10, 15, 20, and 25% levels were mixed with wheat flour. The composition, physical properties, color, texture, and sensory evaluation were analyzed for de-oiled maize germ (DOMG)-fortified flour bun. It was found that the protein, fat, ash, and crude fiber content increased with increase in the percentage of DMGF in the wheat flour. Bun loaf volume decreased with increase in DMGF levels from 5 to 25%. Bun yield increased with increase in blending proportions. Bun prepared with 5% substitution was lighter than all other treatments as indicated by the higher L* values and the values decreased with DMGF augmentation. Total color difference (∆E) of DMGF buns differed from the wheat flour bun sample. With the increase in DMGF, an increase in the values of the hardness of DMGF bun was observed. Bun prepared from 10% incorporation of DOMG scored highest for its overall appearance.
Keywords:
Public Interest Statement
De-oiled maize germ (DOMG) is the key source of nutrients like protein, fiber, and minerals. As the oil has already been removed from it, this byproduct of oil industry can be effectively utilized in a variety of ways for value addition of food products like bakery products. By fortification, it can be a solution to protein malnutrition and mineral deficiency in developing countries. Formulation of fortified flour is vital for development of value-added products with optimal functionality. Fortified flour produces nutrient-rich flour to produce high-quality food products at low cost. The production of bun is mostly restricted to using wheat flour. But the addition of DOMG in wheat flour will help in improving both the nutritional value and taste of bun.
Competing Interests
The authors declare no competing interest.
1. Introduction
The challenge of processing de-oiled maize germ (DOMG) for human consumption is to develop acceptable foods of high nutritional value and make them available among the nutritionally vulnerable groups. Maize germ (MG) constitutes 5–14% of the weight of kernel and is a good source of key nutrients especially 18–41% of oil and 17–35% of protein contents (Johnston, McAloon, Moreau, Hicks, & Singh, Citation2005; Malaysian Palm Oil Council, Citation2008). With its high content of proteins, fiber, some of the important vitamins and minerals, MG flour has acquired a well-deserved reputation as a poor man’s nutricereal. Developing world is facing the menace of protein malnutrition and mineral deficiency, especially countries like India where wheat and rice are the dietary staples. Food fortification is one of the best cost-effective strategies to combat mineral deficiency. Previous studies have demonstrated fortification of wheat flour with other flours and micronutrients to combat mineral and protein deficiencies (Sihag, Sharma, Arora, Singh, & Lal, Citation2015; Sihag, Sharma, Goyal, Arora, & Singh, Citation2015; Villarino, Jayasena, Coorey, Chakrabarti-Bell, & Johnson, Citation2014). In order to control protein malnutrition, petite efforts are being carried out through diet diversification programs. Residues left after oil extraction, can be a potential food source in fortified flour technology as a source of protein, dietary fiber, and minerals (Rehman, Paterson, Hussain, Anjum Murtaza, & Mehmood, Citation2007). MG flour is reported to have 2.74, 2.36, 1.02, 0.015, and 0.020% of phosphorus, potassium, magnesium, calcium, and iron, respectively (Inglett & Blessin, Citation1979). Defatted MG flour being a cheaper source of nutrients decreases the cost of fortified flour blends or finished product besides improving the nutritional profile (Johnston et al., Citation2005). Fortified flour technology refers to the process of mixing various flours to make use of local raw material to produce high-quality food products in an economical way (Rehman et al., Citation2007).
Utilization of DOMG either by incorporation or substitution of main ingredient in popular bakery products is likely to help in enhancing utilization. De-oiled maize germ flour (DMGF) fulfills the requirement of protein in terms of quantity and quality. In India, DMGF is used in various foods in many ways. DOMG could be incorporated or substituted in either cereal or pulse based foods without affecting the organoleptic appeal adversely up to 25% in bakery product (Johnston et al., Citation2005). DMGF could easily fit in the preparation of both fermented and unleavened bakery foods. Bun is considered to be one of the bakery processed foods and consumed by majority of human population. It is a popular part of the daily breakfast menu and is prepared by cooking dough made of flour, water and other ingredients. In the past, various attempts have been made to produce fortified bread e.g. from peanut meal flour (Yadav, Thakur, Sunooj, & Singh, Citation2013) and extract of black rice (Sui, Zhang, & Zhou, Citation2016). But no attempt has been made to formulate fortified bun. The present study was carried out to find out the acceptability of the bun after the addition of MG flour in wheat flour at different levels. Therefore, the objective of present study was to develop DOMG-fortified bun and its comparative study with wheat flour bun for its different characteristics.
2. Materials and methods
Based on the results of some preliminary trials, wheat flour fortified with 5, 10, 15, 20, and 25% DMGF along with control i.e. 100% wheat flour were selected for bun production.
2.1. Materials
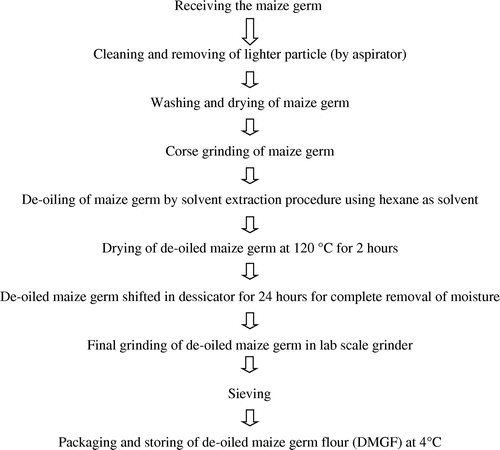
Wheat flour was purchased from local market of Sangrur. MG was collected from Sukhjeet Flour Private Limited, Phagwara, Punjab, India. MG were coarsely grounded and later de-oiled by solvent extraction process. Solvent from oil was removed by distillation process followed by mild heating to remove the traces of solvent. The DOMG was finely grinded and passed through sieve having mesh No. 35, size 0.52 mm. DMGF was obtained from MG using different processing operations as illustrated in flow chart (Figure ). Blends were prepared by mixing wheat flour and DMGF in different combinations. The different proportions of DMGF at 5, 10, 15, 20, and 25% levels were mixed with wheat flour.
Figure 1. Flow chart showing process to obtain DMGF.
2.2. Bun formulation
Bun was prepared according to the following recipe as described by Pyler (Citation1988). For the preparation of bun, 100 g flour, 2 g yeast, 2 g salt, 5 g shortening, 2 g non-fat dry milk, 10 g sugar and 55–65 ml water were used. Dough for bun was prepared by mixing all ingredients. The ingredients were kneaded with hands till good consistency dough was prepared. The yeast suspension was prepared by adding distilled water from wet yeast. The dough was divided into four equal pieces and rounded into balls and places in bowels and covered with wet muslin cloths. Dough balls were then kept in environmental chamber for proofing at 85% relative humidity and 35°C for 70 min. Bun baking was carried out in baking oven (Continental, India) 218 ± 5°C for 20–25 min. Buns were cooled at room temperature, weighed and packed in 100 gauge HDPE packets and sealed.
2.3. Analysis of DOMG-fortified flour bun
2.3.1. Proximate analysis
Moisture, protein, fat, ash, crude fiber content, and nitrogen-free extract (NFE) of flour were determined according to method of AOAC (Citation2000).
2.3.2. Physical properties
The loaf volume after cooling for 15 min was measured using the rapeseed displacement method. Each loaf was put in a container and covered with rapeseed to totally fill the container. Then the loaf was removed and the volume of the rapeseed was recorded by the method given in AACC (Citation2000). The results were expressed as means of triplicate values along with standard deviation in cm3. Specific volume was calculated as the ratio of the loaf volume to the loaf mass determined one hour after baking according to the method of Penfield and Campbell (Citation1990).
Bun density was calculated as the ratio of the loaf mass to the loaf volume (Shogren, Mohamed, & Carriere, Citation2003). Yield of bun during baking is the ratio of weight of the product to the weight of loaf AACC (Citation2000).
2.3.3. Color analysis
Color values for crust were measured at three different locations on the same loaf using the Color Spectrophotometer (Hunter’s color lab, GretagMacbeth model-color i5, CH-8105 Regensdort, Switzerland). The results were reported as L* (lightness), a* (redness and greenness), and b* (yellowness and blueness). The measurements were made in triplicate and the means and standard deviations were reported.
2.3.4. Texture analysis
Hardness, springiness, cohesiveness, gumminess, chewiness, and resilience values were determined using a texture analyzer (TA-XT2i Stable Microsystems, Surrey, UK) with a P75 75-mm compression plate cylindrical probe at pre test speed of 1.0 mm s−1, test speed of 1.0 mm s−1 and post test speed of 10 mm s−1 and a 25-kg load. Bun was cut for getting approximately 2-mm-thick crust portion uniformly.
2.3.5. Sensory evaluation
Sensory tests were conducted by trained panel of eight members of the Department of Food Engineering and Technology, Sant Longowal Institute of Engineering and Technology, Longowal. Buns were evaluated on the basis of acceptability of their crust, aroma, shape, internal texture, taste, appearance, and overall acceptability by a 9-point Hedonic scale. A 9-point Hedonic scale with 1 = dislike extremely, 5 = neither like nor dislike, 9 = like extremely was used (Ranganna, Citation2004).
2.4. Statistical analysis
Data were analyzed using analysis of variance procedures in a completely randomized design with three replications. Statistical analysis was performed using the SPSS statistic software version. The results were interpreted at 5% level of significance. Duncan’s test was used to show difference among the samples.
3. Results and discussion
3.1. Proximate analysis of DOMG-fortified bun
Proximate composition is an important criterion to have an idea about the overall composition and nutritional status of any ingredient intended for food use. So, the proximate composition of all the DMGF bun samples was determined and the data thus obtained were statistically analyzed. Moisture content is the amount of water present in food product. It is an important determinant of shelf life of bun. Low moisture content helps in enhancing the storage of bakery product at ambient temperature. The moisture content of bun containing DMGF was larger than that of the control, but the moisture content of bun containing 5% of DOMG was smaller than the moisture content of the control bun (Table ). There was gradual increase in the moisture content with increase in amount of DOMG. This might be due to the reason that water absorption capacity of DOMG is eight times that of wheat flour. Protein content of fortified bun also gradually increased with increase in amount of DOMG. This was due to the fact that protein of DOMG is higher than wheat flour. During statistical analysis, it was observed that protein content of DMGF bun at all the percentage of blending i.e. from 10 to 25% of DOMG fortified flour bun significantly differs from the wheat flour bun (control) sample. Within the fortified flour bun samples, all the fortified flour samples differ significantly from one another (p < 0.05). DMGF bun samples were having fat content ranging from 5.36 to 5.68%. DOMG-fortified flour substituted at 25% level had the highest fat content, whereas control sample was having 0.98% of ash content. This was due to the fact that oil absorption capacity of DOMG is twice that of wheat flour. It was found that the ash content increased with increase in the percentage of DMGF in the wheat flour. This was due to the fact that ash content of DOMG was much higher than that of wheat flour. Crude fiber is represented by an insoluble but combustible organic residue. The crude fiber content of bun containing DMGF was larger than of the control bun. DOMG-fortified flour bun at the level of 25% had the highest crude fiber content. It was found that the crude fiber content increased with increase in the percentage of DMGF in the wheat flour as the crude fiber content of DOMG is ten times that of wheat flour. It was found that the NFE content decreased with increase in the percentage of DMGF in the wheat flour. This was due to the fact that NFE content of DOMG was lesser than that of wheat flour. During statistical analysis, it was observed that NFE content of DMGF bun at all the percentage of blending i.e. from 10 to 25% blending of MG flour significantly differs from the wheat flour (control) sample, except 5% blending, which did not significantly differ from the wheat flour (p < 0.05).
Table 1. Proximate analysis of DOMG-fortified bun
3.2. Physical properties of DOMG fortified bun
Majority of bakery products show variation in physical, chemical, and functional properties according to their processing endowment. These characteristics influence each other and could in turn affect the acceptability of the product. The physical characteristics of bun are presented in Table . Bun volume decreased gradually with the addition of DMGF in formulation and highest bun volume was recorded in 5% (Table ). Bun loaf volume improved from 260 cm3 for wheat flour to 272 cm3 for 5% DOMG-fortified flour bun. Bun loaf volume decreased significantly from 272.03 to 225.06 cm3 with increase in DMGF level from 5 to 25%. Similar effect was also observed on bun specific volume with DMGF addition. Highest specific volume of 2.90 cm3 g−1 was recorded for 5%. That was significantly different from 10% and 15% DMGF addition which were 2.72 and 2.40 cm3 g−1, whereas significantly low specific volume was observed for 25% level. The decrease in dough loaf volume and specific volume was expected as the amount of gluten, which imparts higher volume decreased as a result of addition of gluten-free DMGF in bun formulation. Partial replacement of wheat flour with non-glutenous flour has been shown to result in lower baked volume as reported by Banks, Wang, and Brewer (Citation1997) who observed a significant decrease in baked volume of muffins made with added defatted soy flour (p < 0.05). DOMG-fortified flour at 25% level had the highest density and the lowest value was observed in 5% level, whereas control sample was having 0.38 g cm−3 of density. It was found that the density increased with increase in the percentage of DMGF in the wheat flour. This was due to the high fiber and low gluten contents in DMGF, which caused low volume and finally resulted in high density. During statistical analysis, it was observed that density of DMGF bun at the percentage of blending of 5 and 10% do not significantly differ from the wheat flour bun (control) sample. Yield of product during baking is the ratio of weight of the product to the weight of dough loaf. Bun yield increased significantly from 86.2 to 91.2%, with a progressive increase in DMGF level from 5 to 25%. It was found that the yield increased with increase in the percentage of DMGF in the wheat flour. Increased dough loaf weight for DOMG-fortified flour buns can be theorized for higher water absorption and retention capacities of DMGF resulting in increased yield of the finished product (Brown & Zayas, Citation1990). During statistical analysis, it was observed that yield of DMGF bun at all the percentage of blending i.e. from 5 to 25% levels significantly differ from the wheat flour bun (control) sample. Within the DMGF bun samples, all the fortified flour samples differ significantly from one another (p < 0.05).
Table 2. Physical properties of DOMG-fortified bun
3.3. Color analysis of DOMG-fortified bun (crust part)
Color depicts first impression for the acceptance of any product by consumers. Mean Hunter color values of different treatments of DMGF bun along with control (wheat flour) bun are shown in Table . L*, a*, and b* values were significantly affected with treatments. Bun prepared with 5% substitution was lighter than all other treatments as indicated by the higher L* values, which decreased with DMGF augmentation. As compared to wheat flour bun, MG flour addition in bun in the range of 5–25% resulted in increased yellow tint (higher b* values in positive range). ∆E value increased with increase in DMGF in buns. Highest ∆E was recorded for 25% and lowest in 5% addition. Greene and Bovell-Benjamin (Citation2004) also observed that L* values decreased with decrease in sweet potato flour addition, whereas whole-wheat flour showed an inverse effect. The lower L* values in this study might possibly be due to maillard browning and caramelization, which are influenced by the distribution of water and the reaction between reducing sugars and amino acids (Kent & Evers, Citation1994). In another study, Banks et al. (Citation1997) reported that muffins containing partially defatted soy flour were lighter and redder in color than control samples. Koca and Anil (Citation2007) reported that the crumb L* and b* values decreased and a* values increased with flaxseed in bread formulation. Similar trend was observed by Alpaslan and Hayta (Citation2006) and Park, Choi, and Kim (Citation2015) in bakery products. It was observed that total color difference (∆E) of DMGF buns at the percentage of blending from 5 and 25% significantly differed from the wheat flour bun (control) sample. Within the DMGF bun samples, all the fortified flour samples at the level of 5 to 25% differ significantly from one another (p < 0.05).
Table 3. Color analysis (crust part) of DOMG-fortified bun
3.4. Texture analysis of control bun and DOMG-fortified bun
Texture analysis indicated that the treatment of DMGF significantly affected the hardness of bun. It was observed that hardness of DMGF bun at all the percentage of blending of DMGF significantly differ from the wheat flour bun (control) sample (Table ). The results substantiated that with the increase in DMGF, an increase in the values of the hardness of DMGF bun was observed. It might be due to increased fiber and protein contents. The values of springiness of DMGF bun declined with the addition of DMGF levels in the wheat flour. The values of the cohesiveness ranged from 0.500 to 0.538 for the bun made from DOMG-fortified flour. Gumminess value in control bun was found to be 13.638 N and the value was highest when substituted at 25% level. It was observed that DOMG-fortified flour had the highest chewiness and the lowest chewiness value was recorded in 10% substitution level. With increase in level up to 25%, the resilience increased gradually. DOMG-fortified flour at the level of 25% had the highest resilience and the lowest resilience value was recorded in 5% substitution level. From the textural analysis, it was found that various textural parameters of fortified bun were within the prescribed limits as reported by various authors in the past for bun evaluation (Feili, Zzaman, Abdullah, & Yang, Citation2013). There was acceptability of DOMG-fortified bun in relation to all the parameters of textural analysis.
Table 4. Texture analysis of DOMG-fortified bun
3.5. Sensory evaluation of control bun and DOMG-fortified bun
Results of the sensory evaluation of bun of DMGF incorporated at different levels i.e. 5, 10, 15, 20, and 25% are depicted in Table . It was observed that irrespective of levels of incorporation, bun prepared from 10% of incorporation scored highest for its appearance. Significantly low scores were observed for bun with substitution of DMGF at the level of 25%. Crust color scores decreased significantly with DMGF addition after 10% level. The effect was more pronounced in 25% DMGF bun. The desirable crust color of bread is “Golden brown.” which became darker brown with subsequent DMGF addition. Banks et al. (Citation1997) reported that soy flour containing muffins crusts were darker and more uneven than that of the control sample. The change in crust color may be attributed to maillard reaction between reducing sugars and proteins (Raidl & Klein, Citation1983). In addition, DMGF contributed high protein content, thus leading to more favorable conditions for non-enzymatic maillard reactions. Esteller and Lannes (Citation2008) observed that during baking, amount of water on the dough surface quickly decreased providing favorable conditions for browning reactions resulting in darker brown color. Dhingra and Jood (Citation2002) reported non-significant changes in crust color of breads prepared with 10% non-wheat flours. From internal texture perspective, it was observed that the crumb of the (wheat flour) control sample and the DMGF bun were similar since no significant differences were detected in terms of firmness, denseness, and stickiness to teeth between them up to 10% of DMGF bun. In the present study, it was found that it is possible to produce bun using 10% DMGF substitution without significantly affecting textural attributes of the crumb. On the other hand, the crumb of bun prepared with more than 20% incorporation had a greater stickiness to teeth and was more difficult to chew in comparison to the control bun because it was significantly firmer in texture than the control bun. This was probably due to the higher fiber and protein contents of the DMGF in comparison to the wheat flour bun. These results indicated that DMGF up to 10% incorporation is a preferable choice over wheat flour bun. The DMGF bun appears to be significantly grainier than the control bun. The graininess associated with DMGF was due to high protein content, thus leading to more favorable conditions for non-enzymatic maillard reactions. Esteller and Lannes (Citation2008) observed during baking that the amount of water on the dough surface quickly decreased providing favorable conditions for browning reactions resulting in grainy and toasted attributes. The overall acceptability of DMGF bun prepared from five levels of DMGF revealed significant differences in overall acceptability. The taste panel rated DMGF at the level of 10% to be better than all other samples. Bun prepared from 25% DOMG appeared to have negative effect on sensory quality; however, it is possible to overcome some of these negative perceptions by optimizing the formulations and changing processing conditions. At last, it was concluded that the bun prepared by 10% addition of DMGF was having highest scores in terms of overall acceptability.
Table 5. Sensory evaluation of DOMG-fortified bun
4. Conclusion
Protein content of fortified bun gradually increased with increase in amount of DMGF. DOMG-fortified flour bun at 25% level had the highest protein and fat contents. The highest bun volume was recorded in bun prepared with 5% level. It was found that the density increased with increase in the blending proportion. As compared to wheat flour bun, MG addition in bun resulted in increased yellow tint. In the textural characteristics, springiness decreased wherever resilience increased with increase in blending proportion. Although hardness increased with increase in fortification the sensory scores for internal texture were highest for bun prepared with 10% substitution. All the sensory scores were observed to be highest in bun prepared from 10% MG-fortified bun. So, out of all the blending proportions, the bun made with 10% substitution was the best in terms of its characteristics. Therefore, it was concluded that purpose of adding the DMGF in bun preparation was achieved as it resulted in the development of bun with high acceptability and nutritional value.
Additional information
Funding
Notes on contributors
Ashish Arora
Ashish Arora has done his MTech in Food Engineering and Technology from the Department of Food Engineering and Technology, Sant Longowal Institute of Engineering and Technology (SLIET), Longowal, Punjab, India. He is currently associated as production manager in food processing industry.
Charanjiv Singh Saini
Charanjiv Singh Saini is associate professor in the Department of Food Engineering and Technology, Sant Longowal Institute of Engineering and Technology (SLIET), Longowal, Punjab, India. He is a member of various professional societies. He is associated in teaching, supervising and training of degree, postgraduate and doctorate students in the department. He is involved in product development and value addition of food products. His prime areas of research are packaging technology and storage studies of processed food products.
References
- AACC. (2000). Approved methods of the Association of Cereal Chemists (11th ed.). St. Paul, MN: Author.
- Alpaslan, M., & Hayta, M. (2006). The effects of flaxseed, soy and corn flours on the textural and sensory properties of a bakery product. Journal of Food Quality, 29, 617–627.10.1111/jfq.2006.29.issue-6
- AOAC. (2000). Association of Official Analytical Chemists, official methods of analysis (15th ed.). St. Paul, MN: Author.
- Banks, W. T., Wang, C., & Susan, M. (1997). Partially de-oiled soy flour effects on sensory and physical characteristics of baked products. Journal of Consumer Studies and Home Economics, 21, 151–156.10.1111/ijc.1997.21.issue-2
- Brown, L. M., & Zayas, J. F. (1990). Corn germ protein flour as an extender in broiled beef patties. Journal of Food Science, 55, 888–892.10.1111/jfds.1990.55.issue-4
- Dhingra, S., & Jood, S. (2002). Organoleptic and nutritional evaluation of wheat breads supplemented with soybean and barley flour. Food Chemistry, 77, 479–488.10.1016/S0308-8146(01)00387-9
- Esteller, M. S., & Lannes, S. C. S. (2008). Production and characterization of sponge-dough bread using scalded rye. Journal of Texture Studies, 39, 56–67.10.1111/jts.2008.39.issue-1
- Feili, R., Zzaman, W., Abdullah, W. N. W., & Yang, T. A. (2013). Physical and sensory analysis of high fiber bread incorporated with jackfruit rind flour. Food Science and Technology, 2, 30–36.
- Greene, J. L., & Bovell-Benjamin, A. C. (2004). Macroscopic and sensory evaluation of bread supplemented with sweet potato flour. Journal of Food Science, 69, 167–173.
- Inglett, G. E., & Blessin, C. W. (1979). Food applications of corn germ protein products. Journal of the American Oil Chemists’ Society, 56, 479–481.10.1007/BF02671550
- Johnston, D. B., McAloon, A. J., Moreau, R. A., Hicks, K. B., & Singh, V. (2005). Composition and economic comparison of germ fractions derived from modified corn processing technologies. Journal of the American Oil Chemists’ Society, 82, 603–608.10.1007/s11746-005-1116-z
- Kent, N. L., & Evers, A. D. (1994). Kent's technology of cereals (pp. 59–63). Oxford: Pergamon Press.10.1533/9781855736603
- Koca, A. F., & Anil, M. (2007). Effect of flaxseed and wheat flour blends on dough rheology and bread quality. Journal of the Science of Food and Agriculture, 87, 1172–1175.10.1002/(ISSN)1097-0010
- Malaysian Palm Oil Council. (2008). Global oils and fats. Business Magazine, 5, 33–34.
- Park, J., Choi, I., & Kim, Y. (2015). Cookies formulated from fresh okara using starch, soy flour and hydroxypropyl methylcellulose have high quality and nutritional value. LWT Food Science and Technology, 63, 660–666.10.1016/j.lwt.2015.03.110
- Penfield, M. P., & Campbell, A. M. (1990). Experimental food science (pp. 362–421). San Diego, CA: Academic Press.
- Pyler, E. J. (1988). Baking science and technology (pp. 99–101). Merriam, KS: Sosland Publishing.
- Raidl, M. A., & Klein, B. P. (1983). Effects of soy or field pea flour substitution on physical and sensory characteristics of chemically leavened quick breads. Cereal Chemistry, 60, 367–370.
- Ranganna, S. (2004). Handbook of analysis and quality control of fruit and vegetable products (pp. 7–77). New Delhi: Tata McGraw Hill.
- Rehman, S., Paterson, A., Hussain, S., Murtaza, M. A., & Mehmood, S. (2007). Influence of partial substitution of wheat flour with vetch (Lathyrus sativus L) flour on quality characteristics of doughnuts. LWT - Food Science and Technology, 40, 73–82.10.1016/j.lwt.2005.09.015
- Shogren, R. L., Mohamed, A. A., & Carriere, C. J. (2003). Sensory analysis of whole wheat/soy flour breads. Journal of Food Science, 68, 2141–2145.10.1111/jfds.2003.68.issue-6
- Sihag, M. K., Sharma, V., Arora, S., Singh, A. K., & Lal, D. (2015). Effect of storage conditions on sensory and microbial characteristics of developed pearl millet based weaning food. Indian Journal of Dairy Science, 68, 463–466.
- Sihag, M. K., Sharma, V., Goyal, A., Arora, S., & Singh, A. K. (2015). Effect of domestic processing treatments on iron, β-carotene, phytic acid and polyphenols of pearl millet. Cogent Food & Agriculture, 1, 1109171.
- Sui, X., Zhang, Y., & Zhou, W. (2016). Bread fortified with anthocyanin-rich extract from black rice as nutraceutical sources: Its quality attributes and in vitro digestibility. Food Chemistry, 196, 910–916.10.1016/j.foodchem.2015.09.113
- Villarino, C. B., Jayasena, V., Coorey, R., Chakrabarti-Bell, S., & Johnson, S. (2014). The effects of bread-making process factors on Australian sweet lupin-wheat bread quality characteristics. International Journal of Food Science and Technology, 49, 2373–2381.10.1111/ijfs.12595
- Yadav, D. N., Thakur, N., Sunooj, K. V., & Singh, K. K. (2013). Effect of de-oiled peanut meal flour (DPMF) on the textural, organoleptic and physico chemical properties of bread. International Food Research Journal, 3, 1307–1312.