
 ?Mathematical formulae have been encoded as MathML and are displayed in this HTML version using MathJax in order to improve their display. Uncheck the box to turn MathJax off. This feature requires Javascript. Click on a formula to zoom.
Abstract
In spite of being a large paddy and maize producer for the last decade, Indonesian farming has been suffering from high population, land conversion and low agricultural employment, which have been more daunting than environmental issues in achieving sustainability. They also arise in complex interrelationships, which create loops and cannot be managed individually. This paper presents a system dynamic simulation of Indonesian sustainable food availability assessment to support policy adjustment in achieving sustainability. A system dynamic model has been built to represent Indonesian sustainable food availability as a holistic system which contains economic, environment and social aspects elements and their interrelationships. Simulation has been also done in three stages for a seven policy-scenario and six combination policy-scenario options to analyse how they affect food availability and farming emissions. The principal contribution is a systemic and quantified assessment of sustainable Indonesian food availability using system dynamic for policy adjustment support. ISFA ratio and Food availability scores were set as the goal performance. As the result, a combination of scenario 5 and 4 has been the selected scenario for ISFA ratio and food availability scores 14.61 kg/capita/GgCO2 Eq and 159.6 kg/capita as the most sustainable policy.
Public Interest Statement
Being a large cereal producer doesn’t mean that Indonesia is released from complex food availability problem, especially in environment and socioeconomic complexities. As a national level problem, policy adjustment in sustainable food availability achievement is often more influenced by socioeconomic aspect than environmental one. This study proposes system dynamics methodology to accomplish policy assessment within complexities in socioeconomic and environmental aspects for supporting policy adjustments. These aspects are exposed for their relationships to configure causal effect relations and quantified in system dynamics simulation to evaluate about thirteen scenario policies at year 2025 for their sustainability performance.
Competing interests
The authors declare no competing interest.
1. Introduction
Indonesia is an agricultural country and has been one of the largest paddy and maize producers among the South-East countries for the last 10 years. In 2016, Indonesia produced 79,171,920 tons of paddy and 24,839,830 tons of maize with a production growth average of 1.87% for paddy and 7.13% for maize (Secretariat, Citation2016). As a commitment to Agenda 21’s sustainable development, the Indonesian Ministry of Agriculture has set sustainable food availability as one of the agriculture policies to produce food without harming the environment. Nevertheless, policy adjustment in achieving Indonesian sustainable food availability has brought new challenges. Despite high cereal production over the recent decades, Indonesian farming is also suffering from high population growth, shrinking sown area, land conversions, low agriculture investment and decreasing agricultural employment (WFP, Pangan, & Pertanian, Citation2015). As a developing country, these socioeconomic aspects have been more threatening than the environmental impact itself (Atkinson, Citation1995; Deng, Huang, Rozelle, & Uchida, Citation2006, Citation2008; Iftikhar & Mahmood, Citation2017; Kc, Fraser, Kc, & Fraser, Citation2017; Thibert & Badami, Citation2011). Furthermore, at a national level problem, every environmental policy always brings a socioeconomic impact that cannot be ignored. These aspects also create unpredictable and related complex relationships that create loops and feedbacks (Hall & Carter, Citation2014; Koning et al., Citation2008; Wei, Yang, Song, Abbaspour, & Xu, Citation2012).
To answer those challenges, this paper seeks to assist the policy adjustments by conducting a system dynamics simulation modelling of Indonesian Sustainable Food Availability (ISFA). The simulation model was designed and run to answer “what-if” questions for Indonesian government policy scenario options in achieving sustainable food availability. Conflict of economic, social and environmental aspects was carried out by observing the problem as a holistic system and exposing the relationships between aspects. Elements of those aspects were identified in accordance with certain Indonesian food availability problems and then related to each other by conducting a system dynamic model for sustainable food availability of Indonesia. Relationships among those elements were arranged and depicted in a Causal Loop Diagram (CLD), then simulated through Stock-flow Diagram (SFD). The goal was set as achieving minimum requirement of food availability score and high ratio of food availability to its farming emission, namely the Indonesian Sustainable Food Availability (ISFA) ratio.
There are seven scenarios determined to represent seven policies assessed for high performance of sustainable food availability, stated as ISFA ratio (Equation 1) and food availability (Equation 2). In an assumption that a combination of two policies will be implemented by the government, simulations were done in three stages to assess seven single scenarios and combination of two scenarios. “What-if” questions are answered by the simulation results that predict food availability score and ISFA ratio in year 2025 for every single scenario and combination of two scenarios.
Food availability is one of the food security dimensions and refers to supply of food security and is determined by the level of food production, stock level and net trades (FAO, Citation2008). It is a critical dimension of food security for its role as assessment of the food supply determinant. Accordingly, sustainable food availability is about providing food from farming activities without harming the environment. The term food availability is preferred over food production or food farming to emphasise the population effect on food production.
Complexities arising between food, environment and socioeconomic issues in the farming activities have been realised and it is discussed that it requires a systemic approach to deal with the complex and non-linear relationships between them (Antunes et al., Citation2017; Banos-González, Martínez-Fernández, & Esteve-Selma, Citation2015; Griggs et al., Citation2013; Hubeau et al., Citation2017).
Kc et al. (Citation2017) adjusted strategies for food production by considering socioeconomic aspects. A framework for a holistic sustainable irrigated agricultural system was also conducted by Antunes et al. (Citation2017), with consideration of socioeconomic and environment aspects; however, the complexities of relationships between those aspects are not considered in those studies and an independent assumption on factors is still applied. A partial consideration and complex relations abandonment on these aspects may create unimplemented policies due to imbalanced socioeconomic conditions, sustainability deceleration and incompatibility with the real problem.
Table lists several methods and indicator aspects used in food security policy assessments. Some of the research employed only environment indicators for sustainability (Khanal & Mishra, Citation2017; Larson, Citation2013; Li & Zhang, Citation2017; Maltsoglou et al., Citation2015; Rutten et al., Citation2016), while others have tended to evaluate the sustainability by combining environment, economic and social indicators. However, the research has not addressed the relationships between indicators that could support policy adjustment.
Table 1. Methods used in food security policy assessment
System dynamics (SD) handles non-linear and complex relationships wherein mathematical modelling has limited competence (Sterman, Citation2004). It also occupies qualitative and quantitative relationships with feedback and time-dependent behaviour through simulation (Coyle, Citation1996; Sterman, Citation2004). Qualitative evaluation is managed through CLD, while the quantitative is handled through SFD simulation. Being a national level problem, parameter uncertainties also often occur in fertiliser consumption, agricultural investment, cereal consumption per capita and population growth. This condition is controlled by growth and shrinking rates from statistical quantification of real system data with 90% level of confidence. System’s fluctuations are better accomplished by system dynamics simulation in sensitivity analysis that occupies how the system behaves (Sterman, Citation2004).
The simulation has been widely implemented in policy assessment and control for its ability to explore trade-offs between elements both qualitatively and quantitatively. In adjusting policies due to socioeconomics, a methodology has been applied for sustainable soil salinity management (Inam et al., Citation2017), agricultural economic (Dang & Kawasaki, Citation2017), land consolidation (Jin, Xu, Xiang, Bai, & Zhou, Citation2016) and sustainable water resources (Kotir, Smith, Brown, Marshall, & Johnstone, Citation2016). Related to sustainability, a system dynamics methodology has been implemented for energy policy (Xu & Szmerekovsky, Citation2017), sustainable utilisation of water resource (Sun, Liu, Shang, & Zhang, Citation2017), CO2 emission assessment and mitigation (Anand, Vrat, & Dahiya, Citation2006). SD modelling also deals with other fields of implementation, such as: supply chain (Fera, Fruggiero, Lambiase, Macchiaroli, & Miranda, Citation2017), economic analysis (Gravelsins, Blumberga, Blumberga, & Muizniece, Citation2017) and Human Factors (Fruggiero, Riemma, Ouazene, Macchiaroli, & Guglielmi, Citation2016).
In similar studies on food availability model, SD was performed in increasing crop productivity policies with environmental impact on land degradation by Bala and Hossain (Citation2010) in Bangladesh. Being focus on sustainable crop production and aquaculture, the study modelled and simulated food availability policies in concern of ecological impact of forestry and shrimp production. Bala, Alias, Arshad, Noh, and Hadi (Citation2014) modelled food security in Malaysia. Despite detailed analysis and simulated environmental impacts, these models did not include socioeconomic aspects such as growth of investment, employment, housings, infrastructures and industrial areas. The exclusion of these certain social aspects may cause missing information of certain unaddressed social aspects that have an essential impact on Indonesian sustainable food availability. By involving social aspects, a study by Pradhito, Chou, Dewabharata, and Wirjodirdjo (Citation2013) modelled Indonesian rice-fulfillment in the context of the supply chain based on rice supply-demand balancing performance. Tsolakis and Srai (Citation2017) also constructed system dynamics model for smaller farmer role in food security. However, these researches have not yet considered the environmental aspects which control sustainability.
By means of the consideration socioeconomic and environment aspects in a holistic view of a system, this paper contributes a system dynamics simulation model of Indonesian sustainable food availability to support policies selection to achieve sustainability. For general purposes, the model proposed may well represent the common sustainability problems in developing countries where land conversions, employment and investment are always the principal attributes, but are frequently overlooked.
The paper was prepared based on two research questions:
| • | What complexities occur in Indonesian sustainable food availability? | ||||
| • | How can policy decision-making be supported without eliminating those complexities? | ||||
The first research question is answered by conducting a Causal Loop Diagram (CLD) in Section 3. CLD is a step-in system dynamic that exposes the qualitative relationships among elements of the aspects and identifies feedback loops in the relationships, which indicate the complexities. The second question is answered by configuring and running the simulation model for four determined scenarios that have been selected based on the Indonesian Ministry of Agriculture for 2015–2019 in Pertanian (Citation2015). For the simulation, CLD has been transformed into a Stock-flow Diagram (SFD) to quantify the relationships. SFD is the simulation model to calculate the food availability score and farming emission score.
2. Indonesian sustainable food availability (ISFA) complexities
Instead of high paddy and maize producer, Indonesian farming activity is facing complex problems which frequently associated with socioeconomic aspect, such as uncontrolled land conversions (LANDac, Citation2016; Van der Laan, Wicke, Verweij, & Faaij, Citation2017), investment (Khanal & Regmi, Citation2018) and agricultural employment (Flor et al., Citation2015; Ma’ruf & Safruddin, Citation2017). It is also stated that regional developments, the government has built the Trans-Java Toll road that has already reduce the productive sown area and will continue to grow along with the growth of urban areas around the toll exits (Sayaka & Tarigan, Citation2011). In environment aspect, Indonesia is suffering for excessive fertiliser use, CO2 emission, climate change and water management in the last decade that threat sown area and its productivity (Caruso, Petrarca, & Ricciuti, Citation2016; Gribaldi, Nurlaili, & Rahim, Citation2016; Khanal & Mishra, Citation2017; Kirono et al., Citation2016; Surahman, Soni, & Shivakoti, Citation2018).
Those socioeconomic and environmental problems relate complexly. While government inhibits the road infrastructure expansion in order to expand the sown area other economic sector problems arise along with road infrastructure slowing down growth. Limited infrastructure growth also decreases cereal production by limited access and high price of fertiliser. Conversely, when road infrastructures accelerate fertiliser consumption, the sown area could shrink through degrading soil. This situation shows that government should consider all aspects as an integrated system. A separated solution in one or two aspects would disrupt others.
3. System modelling of Indonesian sustainable food availability (ISFA)
The ISFA system model was developed based on the current problem faced. It consists of social, economic and environment aspects related to the problem explained in Section 2. Table lists elements of the ISFA system with their definition and unit of measurement. Here, “cereal” represents the term “food”, which consists of paddy and maize. These elements relate to each other complexly and configure the ISFA system. Element relations in the ISFA system are illustrated qualitatively as a CLD in Figure and are quantitatively evaluated in the simulation model of the SFD in Figure .
Table 2. Elements or variables of the ISFA system
Figure 1. Causal lo op diagram (CLD) of ISFA system.
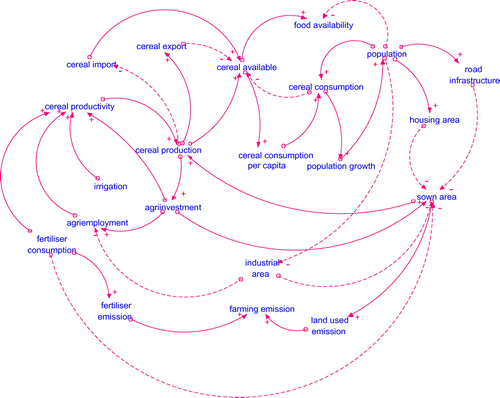
Figure 2. Stock-flow diagram (SFD) of ISFA system.
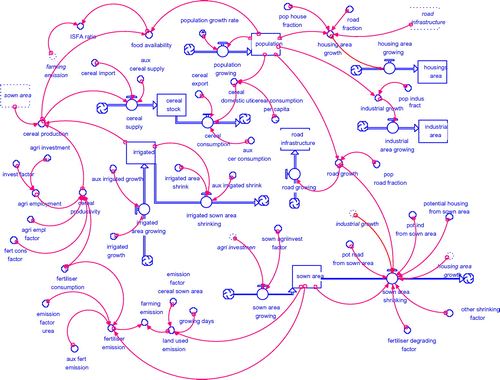
Figure illustrates CLD of ISFA system. Arrows explain the relationships of elements in the system. An arrow head is an “effect” of a “cause” in an arrow tail. A positive relation, shown by (+) signs and solid-lines, means conditions in a “cause” node would affect the same conditions of an “effect” node. A negative relation, shown by (−) signs and dotted lines, means conditions in a “cause” node would conversely affect conditions of an “effect” node. For example, an increase in cereal available causes an increase of food availability (positive relation), while an increase in population causes a decrease in food availability (negative relation). Complexities are also shown in this diagram by the occurrence of feedback loops, for example, sown area loop below that describes complexity in land conversion:
Sown area →(+) Cereal production →(+) Cereal availability →(+) Cereal consumption per cap →(+) Cereal consumption →(+) Population →(+) Road infrastructure or Housing or Industrial area →(−) Sown area
The loop can be explained as:
Beginning from the sown area, when the sown area expands, it increases cereal production and cereal availability. These increases cause an increase of cereal consumption per capita because, when cereal production is high, people tend to increase their consumption. The increased consumption per capita will increase total cereal consumption. When cereal consumption is high, it tends to increase the population requirement of nutrition and health. However, high consumption stimulates the need of road infrastructure, housing and industrial area, which shrinks the sown area. The loop begins in a sequence after the sown area shrinks and decreases cereal production.
Figure illustrates SFD of ISFA system. Elements of the system became variables at SFD (see Table ) and were then simulated for baseline condition and seven policy-scenarios to achieve the goal which are set as the ratio of cereal availability and farming emission (ISFA ratio) and food availability (FA), as written in Equations (1) and (2). Maximum ISFA ratio and FA is required for every policy implemented. The system’s baseline condition was built as existing condition in year 2004–2013 and simulated for 22 years (2004–2025).(1)
(1)
(2)
(2)
Equation (1) is a ratio of sustainability (kg/capita/GgCO2 Eq) that is derived from the general eco-efficiency ratio developed by European Environment Agency (EEA) as in Equation (3), where more welfare states the human need completion in a broad sense and less nature refers to less environmental impact (WBCSD, Citation2000). Derived from ISFA ratio in Equation (1), food availability (FA) is formulated as net cereal available or cereal production (CP) divided by population (Desimone, Popoff, & WBCSD, Citation1997), as in Equation 2 in year (t) (WFP et al., Citation2015).(3)
(3)
Food availability (FA) is a completion of human need in Equation (3), while farming emission (FE) states the lower nature by less emission of the farming activity. Minimum score of FA which is set as 109.5 kg/capita/year also required for the policies. This score is derived from the Indonesian normative consumption rate per day, 300 g/capita/day (300 g × 365 days × 1000−3 kg/capita/year) (WFP et al., Citation2015).
Farming emission (FE) score is formulated in Equation (4) that consists of land-used emission (LE) and fertiliser emission (FerE). Land-used emission (LE) in Equation (5) refers to CH4 emission caused by farming activity in CO2 equivalent unit determined for specific land used, which the cropland category is according to IPCC (Intergovernmental Panel on Climate Change). It is quantified by sown area (SA) and duration of cereal growing days (GD) variables. Fertiliser emission (FerE) refers to CO2 emission from urea fertiliser consumption (FerC) for certain sown area, which is formulated in Equation (5) (KemenLH, Citation2012). In Figure , these equations are illustrated in circles that represent rates of variables or constants that are connected by circular arrows.(4)
(4)
(5)
(5)
(6)
(6)
where
25 = CH4 emission conversion factor for CO2 equivalent
0.2 = urea emission factor
t = set of year period (2004, 2005, …, 2025).
Rectangular boxes in Figure refer to stocks which are accumulated flows to that level and which are formulated in Equation (7) (Bala, Citation1999). The accumulations begin from the initial value of data in 2004, as listed in Table . These variables accumulate as rising flows that appear as straight arrows. They represent information flows and the flow is controlled by a flow rate with circular arrow. Straight arrows that flow into stocks are called inflows, and outflows flow out of stocks.(7)
(7)
Table 3. Initial value for stock variables
The source and sink of the structure are represented as a cloud that denotes infinity and marks the boundary of the model (Bala, Citation1999). Referring to Table and Figure , some stocks are developed from Equations (8)–(10).(8)
(8)
(9)
(9)
(10)
(10)
where
t = set of year period (2004, 2005, …, 2025).
Equation 8 explains that stock of irrigated sown area (Ir) grows and accumulates along the period (t) according to inflow of irrigated area growing. It also shrinks according to outflow of irrigated area shrinking. In baseline condition simulation, it is set that irrigated sown area begins with initial value of 4,867,165 hectare (Table ) grows at 0 ha/year (not growing) and shrinks at 2% shrink rate per year, as in Equation (9). Similarly, Equation (10) explains stock of population (pop) that grows and accumulates according to inflow of population growing along the period (t) at 1.3% of population growth rate.
4. Validity and sensitivity test
Validity and sensitivity tests are series of tests to assure that the built model is applicable in representing the real world. The validity of the ISFA system simulation model has been performed for the simulation model. The test has been done by comparing the simulation result with historical data shown in Table , using the two-independent sample Mann Witney U test in Minitab 16 software. Using null hypothesis (Ho): P1 = P2, significance level (α): 0.05, the test resulted in p-value: 0.7642. For p-value > α, it failed to reject Ho, by which it can be concluded that the null hypothesis of simulation result and historical data are similar. This indicates that the simulation model is valid or successfully represents the real world.
Table 4. Historical data and simulation result of population
Sensitivity analysis is done to ascertain how sensitive the model is to the changes of one or more parameters. When the model behaves as the real world does under extreme conditions, it can be concluded that it is applicable in representing the real world (Breierova & Choudhari, Citation2001). Sensitivity analysis in model behaviour also addresses the parameters uncertainty test in the real system (Sterman, Citation2004). Extreme conditions for food availability have been represented in three extreme population values: 1 × 10⁸, 3 × 10⁸ and 5 × 10⁸. The result of sensitivity analysis is described in Figure .
Figure 3. Result of sensitivity test on food availability at three stages of population.
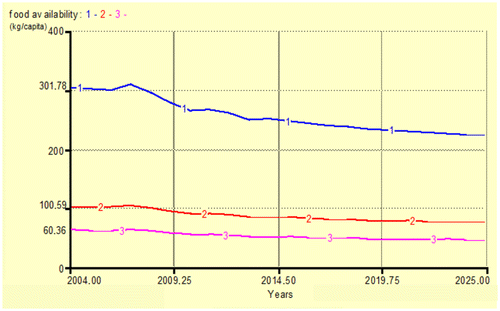
Figure describes changing of food availability. At 2004, curves 1 (blue), 2 (red) and 3 (pink) show the food availability value at 301.78, 100.59, and 60.36 kg/capita for population level at 1 × 10⁸, 3 × 10⁸ and 5 × 10⁸ people, respectively. These curves show that higher population value results in lower food availability, as the real world behaves. It can be concluded that the model is sufficient to represent the real world and is robust to any extreme conditions.
5. Simulation-running and result discussion
Simulation answers “what if” questions related to strategy adjustment. This study simulated the system dynamics model of Indonesian sustainable food availability to evaluate baseline condition and seven determined scenarios based on best performance of sustainable food availability for the year period of 2004–2025. The model was simulated in three simulation-stages for highest ISFA ratio and highest food availability score, with minimum food availability score requirement of 109.5 kg/capita/year (Equations 1 and 2). The higher score of ISFA ratio is the better sustainable performance of the system.
Baseline condition is existing condition at year period 2004–2013 and simulated for year period 2004–2025 (22 year). In this baseline condition, food availability is influenced by:
| • | Shrinking sown area was a result of land conversion into road infrastructure (1%), housing (5%), industrial area (2%) and fertiliser degrading factor (10%). | ||||
| • | Shrinking of irrigated sown area for 2% per year, and | ||||
| • | Fertiliser consumption increased 5% per year. | ||||
| • | Decreasing population growth rate from 1.5 to 1.4% at year 2014 (BPS, Citation2014). | ||||
| • | Increasing agricultural investment for 5% per year. | ||||
| • | Decreasing agricultural employment for 0.8% per year. | ||||
The scenario condition is simulated baseline condition with some policy-treatments at year 2015–2019, as stated by the Indonesian Ministry of Agriculture. Scenarios were developed to represent these policies. As it is assumed that the policy implemented is a combination of two policies, simulations were done for seven single scenarios and a combined scenario. The best performance of single scenario was combined with other scenarios for the next stage of simulation. Those three stages are:
| • | Stage 1: Baseline condition simulation | ||||
| • | Stage 2: Seven single scenarios simulations | ||||
| • | Stage 3: Combination of two scenarios simulation | ||||
All the simulation results are evaluated by the end of the period, year 2025.
5.1. Scenarios for ISFA system simulation
Scenarios were developed to represent Indonesian government policies for sustainable food availability achievement in year 2015–2019. The scenarios developed are:
| • | Scenario 1 is increasing sown area (SA) variable during 2015–2019 for 40,000; 130,000; 250,000; 280,000 and 300,000 hectares. According to the Indonesian Ministry of Agriculture during 2015–2019 (Panudju et al., Citation2013), it was expected that the scenario would increase cereal production and food availability. | ||||
| • | Scenario 2 is increasing fertiliser consumption (FC) variable during 2015–2019 by 1.2, 1.4, 1.6, 1.8 and 2.0-fold. It refers to the urea fertiliser subsidising policy to increase cereal productivity This scenario represents the intensification that is accomplished by giving subsidised fertiliser to farmers (Julianto, Citation2017). | ||||
| • | Scenario 3 is increasing bio-fertiliser composition of the fertiliser consumption during 2015–2019 by reducing the urea fertiliser consumption (FC) variable for 0.9; 0.7; 0.5; 0.3 and 0.3-fold. According to Haroon, Krishnasamzy, Velu, Jawahar, and Ramazaswami (Citation1992), decreasing composition of urea fertiliser and increasing composition of bio-fertiliser, productivity will fall to 0.87% and will increase to 106%, respectively, when the composition of urea and bio-fertiliser reaches 30:70%. Therefore, in this scenario, the cereal productivity (CPy) variable is multiplied by 0.93, 0.90, 0.87,1.06 and 1.06 during 2015–2019. This scenario refers to the subsidising bio-fertiliser policy that represents the government commitment to prevent land degradation. | ||||
| • | Scenario 4 is increasing agricultural investment (AI) variable for 5%; 7%; 9%; 11%; 11% during period 2015–2019. This scenario refers to the agricultural investment policy 2015–2019 by reducing loan interest for agricultural investment from 4.5 to 4.25% per year (Setiawan, Citation2017). It is expected that growth of agricultural investment will grow 11%. | ||||
| • | Scenario 5 is expanding the irrigated sown area (Ir) variable 500,000 Ha/year during 2015–2019 by irrigation facilities improvement. It refers to the irrigation canals and pumps regeneration policy to expand the irrigated area that has been decreasing at 2% per year at baseline condition (Pertanian, Citation2015). | ||||
| • | Scenario 6 is decreasing the potential factor shrinking parameter from housing, industrial area and road infrastructure area for 50% of baseline condition value during period 2015–2019. This scenario refers to controlling the land conversions policy by performing the land protection constitution accurately. | ||||
| • | Scenario 7 is decreasing population growth at 2019 from 1.3% at baseline condition to 1.2%. This scenario refers to the controlling population policy that undertaken by the Indonesian government since the 90s and which has resulted in 0.1% declining population growth for the past ten years (Panudju et al., Citation2013). In 2015, the government published a health guarantee card for parents and three children and population-growth is expected to decline faster, to 0.1% by 2019. | ||||
5.2. Stage-one simulation result
At this stage, simulation was done for baseline condition. Figure describes the result in food availability, farming emission and ISFA ratio. It is seen that ISFA ratio (line-3/green) has a linear-increasing trend, while farming emission (line 2/pink) and food availability (line-1/red) have exponential-declining trends.
Figure 4. Simulation result of ISFA system for baseline condition.
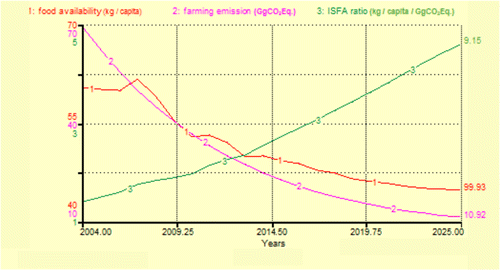
Concerning ISFA ratio, decreasing farming emission below the food availability margin could cause the increasing trend of the ISFA ratio. From the increasing ISFA ratio scores and decreasing farming emission trends, it can be inferred that the system is in a desirable trend for environmental performance. However, despite these desirable trends, an exponential-declining trend for food availability endangers the food security. For year 2025, the food availability score is 99.93 kg/capita, this doesn’t meet the minimum requirement of a food availability score of 109.5 kg/capita. Farming emission is 10.92 GgCO2 Eq and ISFA ratio is 9.15 kg/capita/GgCO2 Eq.
Analysing this result without further evaluation in a systemic view may cause misperception of these favourable environmental performance scores. These increasing ISFA ratio and declining food availability scores should be evaluated through analysing cause-effect relationships in the Causal Loop Diagram (CLD) in Figure . There, it is illustrated that declining food availability scores are affected by declining cereal production as a cause of shrinking the sown area.
5.3. Stage-two simulation result
Stage-two simulations were done for all seven single scenarios. The results are illustrated at Figure . Baseline condition is in the blue area while seven scenario-conditions are in coloured lines. It is seen that, at year period 2004–2014, the ISFA ratio of all scenarios have the same score and start to vary at year 2015 for the scenarios starting to be implemented. Table lists the scores of ISFA ratio and food availability at the end of the period, 2025.
Figure 5. Simulation result in ISFA ratio (a) and food availability (b) for all scenarios condition.
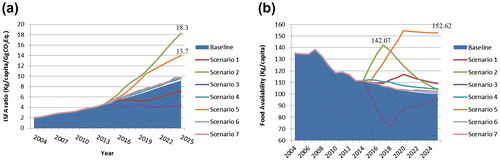
Table 5. Stage-two simulation result in ISFA ratio and Food Availability at year 2025
Figure (a) shows that the scenarios at the end of period, scenarios 2, 4, 5, 6 and 7 reach a high ISFA ratio beyond the baseline condition. The highest ISFA ratio is reached by scenario 2, which is increasing fertiliser consumption; however, this scenario doesn’t meet the minimum score of food availability (109.5 kg/capita/year) as listed in Table . Despite a high achievement food availability at year 2017 for 142.07 kg/capita (see Figure (b)), at the next year it decreases until the end of the period to 103.89 kg/capita (see Table ).
The degrading condition can be explained by the CLD of ISFA system in Figure in that fertiliser consumption is negatively related to sown area and then positively related to farming emission, which means higher fertiliser consumption decreases sown area. A high ISFA ratio is caused by decreasing farming emission, since there is decreasing sown area. Subsidising urea fertiliser for scenario 2 tends to raise excessive fertiliser consumption. According to Ye and Van Ranst (Citation2009), Dong et al. (Citation2012) and Delang (Citation2017), excessive urea fertiliser consumption will degrade soil quality by 50–100% in four years. This explains degradation of sown area at year 2018 and the rest of the period. This condition means that scenario 2 is unsustainable.
An unsustainable result also occurs at scenario 1 and scenario 3, which fall under the baseline condition. CLD at Figure explains that low ISFA ratio for scenario 1 is for increasing land-used emission, since sown area is increasing. Despite a sustainable policy by substituting chemical fertiliser by bio-fertiliser, decreasing ISFA ratio and food availability below baseline condition at the end-period makes scenario 3 an undesirable choice. However, Ye and Van Ranst (Citation2009), Dong et al. (Citation2012) and many other researchers have stated that bio-fertiliser is a long-term policy and will reach high performance after more than ten years, but that is out of the simulation period.
In 2025, highest food availability score is reached by scenario 5 at 152.62 kg/capita (see Table ) and meets the minimum score of 109.5 kg/capita/year. Considering these results, the selected scenario for first stage simulation is scenario 5 (expanding irrigated sown area). For the next stage simulation, combinations of scenario 5 with other scenarios were simulated for best performance of combined scenarios according to food availability and ISFA ratio.
5.4. Stage-three simulation result
Stage three simulated combinations of scenario 5 (expanding irrigated sown area) with other scenarios. The combination scenarios are:
| (1) | Scenario 5–1, a combination of scenarios 5 and 1, which are expanding irrigated sown area (Ir) and expanding sown area (SA) variables, respectively. | ||||
| (2) | Scenario 5–2, a combination of scenarios 5 and 2, which are expanding irrigated sown area (Ir) and increasing fertiliser consumption (FC) variables, respectively. | ||||
| (3) | Scenario 5–3, a combination of scenarios 5 and 3, which are expanding irrigated sown area (Ir) and increasing bio-fertiliser into fertiliser composition, respectively. | ||||
| (4) | Scenario 5–4, a combination of scenarios 5 and 4, which are expanding irrigated sown area (Ir) and increasing agricultural investment (AI) variables, respectively. | ||||
| (5) | Scenario 5–6, a combination of scenarios 5 and 6, which are expanding irrigated sown area (Ir) and decreasing potential factor shrinking parameter from housing, industrial area and road infrastructure area, respectively. | ||||
| (6) | Scenario 5–7, a combination of scenarios 5 and 7, which are expanding irrigated sown area (Ir) and decreasing population growth at 2019 from 1.3% at baseline condition into 1.2%, respectively. | ||||
Simulation results in ISFA ratio and food availability are described at Figure and Table . It is seen in Figure (a) that the ISFA ratios of all combined scenarios are higher than baseline condition except for scenario 5–3. At year 2025, the highest ISFA ratio and food availability is scenario 5–2 for 29.13 kg/capita/GgCO2 Eq and 165.36 kg/capita above the minimum food availability requirement 109.5 kg/capita (see Figure and Table ). However, as explained in the previous section, this combination is not desirable for unsustainable scenario 2. Figure (b) and Table also illustrated that decreasing trend in food availability of scenario 5–2 will most likely continue after year 2025 and tends to endanger overall food security condition.
Figure 6. Stage-three simulation results in ISFA ratio (a) and food availability (b).
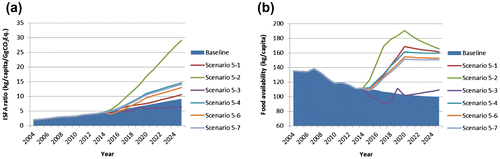
Table 6. Stage-three simulation result at year 2025
Second place for ISFA ratio and food availability is combined scenario 5–4 for 14.61 kg/capita/GgCO2 Eq and 159.6 kg/capita, as listed at Table . It is also shown in Figure (b) that scenario 5–4 has increasing food availability trend until 2025 and will most likely continue after 2025. CLD at Figure also explains that increasing agricultural investment will increase agricultural employment. This social-aspect effect affords benefit of unemployment decreasing to the Indonesian government as a developing country.
These conditions describe that scenario 5–4 is more preferable for sustainable food availability. Consequently, it is decided that the best selected scenario for sustainable food availability is scenario 5–4, a combination of expanding irrigated sown area by irrigation facilities improvement and increasing agricultural investment by lowering loan interest for agricultural investment.
Selecting scenario 5–4 out of scenario 5–2 also causes ISFA ratio and food availability trade-off between scenario 5–2 and 5–4. Higher ISFA ratio and food availability scores than scenario 5–4 are traded by lower decreasing trend of food availability in 2020–2025. Table list simulation results in food availability at period 2015–2025 where scenarios 5–2 and 5–4 are implemented at 2015–2019. Year 2020, when scenarios are not implemented, trend of food availability decreases as illustrated in Figure (b) and quantified as -0.01045 and -0.00201 for scenario 5–2 and 5–4 (see Table ). Lower decreasing trend makes scenario 5–2 is assumed to endanger broader food security system.
Table 7. Simulation result (2015–2025) in food availability trend (kg/capita)
6. Conclusions
This paper aims to assist policy adjustment by conducting a system dynamics simulation model for Indonesian Sustainable Food Availability (ISFA). System dynamics methodology is used to handle complexities that have arisen as ISFA problems since there are complex relationships between socioeconomic and environment aspects. Although complexities in food availability and food security have been realised and the need of a holistic system approach has been discussed, most previous research assumed economic, social and environment aspects as independent factors. This independent factor assumption or partial consideration and the complex relations abandonment on these aspects may create unimplemented policies due to imbalanced socioeconomic conditions, sustainability deceleration and incompatibility with the real problem.
Food availability was measured legally and evaluated for the sustainability in Food security and vulnerability atlas of Indonesia 2015 by WFP et al. (Citation2015). However, the evaluation is completed without indicators relationships consideration, complexities are simplified by assuming indicators as independent variables, and sustainability assessments are completed through ecological footprint that does not occupy related farming process. Without indicators relationships exploration, results cannot be further evaluated to analyse root causes and how the results occur.
Being different with previous studies in food availability policy assessment (see Table ), relationships between indicators are considered in this study. Complexities in relationships are handled using system dynamics by conducting the integration of all elements of the socioeconomic and environment aspects as a holistic system. Beginning from CLD, all indicators in these aspects are connected as causal relationships and then converted into mathematical equation relations in SFD.
Simulations have been run for a 22-year period of 2004–2025 representing the long-term strategies of the Indonesian Ministry of Agriculture. Scenarios representing government policies were performed for the period 2015–2019 and were then simulated until 2025. There are three simulation stages, (1) baseline condition simulation, (2) seven single designed scenarios, and (3) combination of two designed scenarios that were evaluated for their relative highest ISFA ratio and minimum requirement food availability score at 109.5 kg/capita/year at year 2025.
Regarding to all simulation-stage calculations, it is decided that scenario 5–4, a combination of expanding irrigated sown area and increasing agricultural investment policy, is the best policy for ISFA. To achieve sustainable food availability, Indonesian government should develop a new system of ISFA by implementing this selected policy. Adding and maintaining irrigation pipes, pumps and channels periodically can expand irrigated sown area for 500,000 ha/year. Without creating new sown area which causes increasing CO2 emission, this new system can increase cereal production. Lowering agricultural loan interest into 4.25% can increase agricultural investment at 11%. By combining these policies into real system of ISFA, 159.6 kg/capita of food availability and 14.61 kg/capita/GgCO2 Eq of ISFA ratio will be achieved at year 2025.
It is also our finding that best performance of ISFA ratio, food availability and lower CO2 emission do not always mean the best performance in sustainability. It needs further evaluation by analysing the relationships and complexities between economic, social and environment aspects to assess how the policies can be implemented sustainably in the real system. Implementing highest performance ISFA ratio and food availability scores in simulation, scenario 5–2, a combination of expanding irrigated sown area and increasing fertiliser consumption policy, into the real system without further evaluation on CLD will make the ISFA system more unsustainable.
It is a necessary assumption that the final simulation result for scenario 5–4 is valid for year period 2004–2025. The solution might not be applicable for a year period that is not addressed in this simulation period. In spite of a significant exploration in variable relations complexities, it is a weakness of the system-dynamics simulation in that it might not can be applied into long-term policies (more than 25 years) on account of bias risk-result in the real system.
Further research for broader system of food security that include food access, food utility and food stability might be needed to evaluate holistic food security system in more comprehensive assessment.
Funding
The authors received no direct funding for this research.
Cover Image
Source: Weny Findiastuti.
Additional information
Notes on contributors
Weny Findiastuti
Weny Findiastuti is a doctor candidate in Department of Industrial Engineering at Institut Teknologi Sepuluh Nopember, Indonesia and lecturer in Department of Industrial Engineering at Universitas Trunojoyo, Indonesia. Her research interest is in macro-level quality and sustainability include eco-efficiency and food security. Currently she is working on eco-efficiency of sustainable food security.
Moses Laksono Singgih
Moses Laksono Singgih is professor of productivity and quality in Department of Industrial Engineering at Institut Teknologi Sepuluh Nopember. He has Master at Industrial Engineering, Institut Teknologi Bandung, Indonesia and PhD from Industrial Economics, University of Queensland, Australia. His current research interest is in regional productivity.
Maria Anityasari
Maria Anityasari is researcher at the same institute. Her research interest includes in socio engineering, green and sustainability practices, management of change, system design and risk management. She has Master and PhD from UNSW Sydney, Australia. Her current research focuses on sustainable manufacturing and sustainable oriented communities.
References
- Abiyev, H. R., Uyar, K., Ilhan, U., & Imanov, E. (2016). Assessment of food security risk level using type 2 fuzzy system. Procedia Computer Science, 102, 547–554.10.1016/j.procs.2016.09.441
- Anand, S., Vrat, P., & Dahiya, R. P. (2006). Application of a system dynamics approach for assessment and mitigation of CO2 emissions from the cement industry. Journal of Environmental Management, 79(4), 383–398.10.1016/j.jenvman.2005.08.007
- Antunes, P., Santos, R., Cosme, I., Osann, A., Calera, A., Ketelaere, D. D., … Alberto, L. (2017). A holistic framework to assess the sustainability of irrigated agricultural systems. Cogent Food & Agriculture, 95(1).
- Atkinson, S. J. (1995). Approaches and actors in urban food security in developing countries. Habitat International, 19(2), 151–163.10.1016/0197-3975(94)00063-8
- Bala, B. K. (1999). Energy and environment: Modelling and simulation. New york: Nova science publisher.
- Bala, B. K., Alias, E. F., Arshad, F. M., Noh, K. M., & Hadi, A. H. A. (2014). Modelling of food security in Malaysia. Simulation Modelling Practice and Theory, 47, 152–164.10.1016/j.simpat.2014.06.001
- Bala, B. K., & Hossain, M. A. (2010). Food security and ecological footprint of coastal zone of Bangladesh. Environment, Development and Sustainability, 12(4), 531–545.10.1007/s10668-009-9209-0
- Banos-González, I., Martínez-Fernández, J., & Esteve-Selma, M. Á. (2015). Dynamic integration of sustainability indicators in insular socio-ecological systems. Ecological Modelling, 306, 130–144.10.1016/j.ecolmodel.2014.08.014
- Boratyńska, K., & Huseynov, R. T. (2017). An innovative approach to food security policy in developing countries. Journal of Innovation & Knowledge, 2, 39–44.10.1016/j.jik.2016.01.007
- BPS, B. P. S. (2014). Laju pertumbuhan penduduk 1980–2014.
- Breierova, L., & Choudhari, M. (2001). An introduction to sensitivity analysis Retrieved from https://ocw.mit.edu/courses/sloan-school-of-management/15-988-system-dynamics-self-study-fall-1998-spring-1999/readings/sensitivityanalysis.pdf
- Caruso, R., Petrarca, I., & Ricciuti, R. (2016). Climate change, rice crops, and violence. Journal of Peace Research, 53(1), 66–83.10.1177/0022343315616061
- Coyle, R. G. (1996). System dynamics modelling: A practical approach. Boca Raton: Chapman & Hall/CRC.10.1007/978-1-4899-2935-8
- Dang, A. N., & Kawasaki, A. (2017). Integrating biophysical and socio-economic factors for land-use and land-cover change projection in agricultural economic regions. Ecological Modelling, 344, 29–37.10.1016/j.ecolmodel.2016.11.004
- Delang, C. O. (2017). China’s soil pollution and degradation problems. New York: Routledge Focus.
- Deng, X., Huang, J., Rozelle, S., & Uchida, E. (2006). Cultivated land conversion and potential agricultural productivity in China. Land Use Policy, 23(4), 372–384.
- Deng, X., Huang, J., Rozelle, S., & Uchida, E. (2008). Growth, population and industrialization, and urban land expansion of China. Journal of Urban Economics, 63(1), 96–115.10.1016/j.jue.2006.12.006
- Desimone, L. D., & Popoff, F., & WBCSD. (1997). Eco-efficiency: The business link to sustainable development. London: MIT Press.
- Dong, W., Zhang, X., Wang, H., Dai, X., Sun, X., Qiu, W., & Yang, F. (2012). Effect of different fertilizer application on the soil fertility of paddy soils in red soil region of southern China. Public Library of Science, 7(9). doi:10.1371/journal.pone.0044504
- FAO. (2008). An introduction to the basic concepts of food security [Press release]. Retrieved from www.foodsec.org/docs/concepts_guide.pdf
- Fera, M., Fruggiero, F., Lambiase, A., Macchiaroli, R., & Miranda, S. (2017). The role of uncertainty in supply chains under dynamic modeling. International Journal of Industrial Engineering Computations, 8, 119–140.10.5267/j.ijiec.2016.6.003
- Flor, R. J., Singleton, G., Casimero, M., Abidin, Z., Razak, N., Maat, H., & Leeuwis, C. (2015). Farmers, institutions and technology in agricultural change processes: Outcomes from Adaptive Research on rice production in Sulawesi, Indonesia. International Journal of Agricultural Sustainability, 14(2), 166–186.
- Fruggiero, F., Riemma, S., Ouazene, Y., Macchiaroli, R., & Guglielmi, V. (2016). Incorporating the human factor within manufacturing dynamics. Paper presented at the 8th IFAC Conference on Manufacturing Modelling, Management and Control MIM 2016, Troyes, France.
- Gravelsins, A., Blumberga, A., Blumberga, D., & Muizniece, I. (2017). Economic analysis of wood products: System dynamics approach. Energy Procedia, 128, 431–436.10.1016/j.egypro.2017.09.023
- Gribaldi, Nurlaili, & Rahim, S. E. (2016). Effects of fertilization and submersion on morphological changes and production of two rice varieties with submersion stress conditions. Paper presented at the Engineering Technology International Conference, Malaysia.
- Griggs, D., Stafford-Smith, M., Gaffney, O., Rockström, J., Öhman, M. C., Shyamsundar, P., … Noble, I. (2013). Sustainable development goals for people and planet. Nature, 495, 305–307.10.1038/495305a
- Hall, A., & Carter, L. (2014). Taking complexity in food systems seriously: An interdisciplinary analysis. World Development, 61, 85–101.
- Haroon, A. R. M., Krishnasamzy, R., Velu, V., Jawahar, D., & Ramazaswami, P. P. (1992). Integrated nitrogent management for irrigated low land rice. International Rice Research Newsletter, 17.
- Hubeau, M., Marchand, F., Coteur, I., Mondelaers, K., Debruyne, L., & Van Huylenbroeck, G. V. (2017). A new agri-food systems sustainability approach to identify shared transformation pathways towards sustainability. Ecological Economics, 171, 52–63.10.1016/j.ecolecon.2016.08.019
- Iftikhar, S., & Mahmood, Z. (2017). Ranking and relationship of agricultural credit with food security: A district level analysis. Cogent Food & Agriculture, 3(1333242).
- Inam, A., Adamowski, J., Prasher, S., Halbe, J., Malard, J., & Albano, R. (2017). Coupling of a distributed stakeholder-built system dynamics socio-economic model with SAHYSMOD for sustainable soil salinity management – Part 1: Model development. Journal of Hydrology, 551, 596–618.10.1016/j.jhydrol.2017.03.039
- Jin, X., Xu, X., Xiang, X., Bai, Q., & Zhou, Y. (2016). System-dynamic analysis on socio-economic impacts of land consolidation in China. Habitat International, 56, 166–175.10.1016/j.habitatint.2016.05.007
- Julianto, P. A. (2017). Pemerintah Alokasikan Rp 31,3 Triliun untuk Subsidi Pupuk, Kompas.
- Kc, K. B., Fraser, E. D. G., Kc, K. B., & Fraser, E. D. G. (2017). Strategies to boost global food production : Modelling socioeconomic policy scenarios Strategies to boost global food production : Modelling socioeconomic policy scenarios. Cogent Food & Agriculture, 16.
- KemenLH, K. L. H. (2012). Pedoman penyelenggaran inventarisasi gas rumah kaca nasional. Indonesia: KemenLH.
- Khanal, A. R., & Mishra, A. K. (2017). Enhancing food security: Food crop portfolio choice in response to climatic risk in India. Global Food Security, 12, 22–30.10.1016/j.gfs.2016.12.003
- Khanal, A. R., & Regmi, M. (2018). Financial constraints and production efficiency. Agricultural Finance Review, 78(1), 25–40.10.1108/AFR-07-2016-0068
- Kirono, D. G. C., Butler, J. R. A., McGregor, J. L., Ripaldi, A., Katzfey, J., & Nguyen, K. (2016). Historical and future seasonal rainfall variability in Nusa Tenggara Barat Province, Indonesia: Implications for the agriculture and water sectors. Climate Risk Management, 12, 45–58.10.1016/j.crm.2015.12.002
- Koning, N. B. J., Van Ittersum, M. K., Becx, G. A., Van Boekel, M. A. J. S., Brandenburg, W. A., Van Den Broek, J. A., … Smies, M. (2008). Long-term global availability of food: Continued abundance or new scarcity? NJAS – Wageningen Journal of Life Sciences, 55(3), 229–292.10.1016/S1573-5214(08)80001-2
- Kotir, J. H., Smith, C., Brown, G., Marshall, N., & Johnstone, R. (2016). A system dynamics simulation model for sustainable water resources management and agricultural development in the Volta River Basin, Ghana. Science of the Total Environment, 573, 444–457.10.1016/j.scitotenv.2016.08.081
- LANDac. (2016). Food security and land governance factsheet.
- Larson, D. F. (2013). Introducing water to an analysis of alternative food security policies in the Middle East and North Africa. Aquatic Procedia, 1, 30–43.10.1016/j.aqpro.2013.07.004
- Li, H., & Zhang, X. (2017). A spatial explicit assessment of food security in Africa based on simulated crop production and distribution. Journal of Cleaner Production, 147, 628–636.10.1016/j.jclepro.2017.01.124
- Ma’ruf, A. Z., & Safruddin, C. (2017). Rice estate development as state owned enterprises (SOEs) to self supporting for food. European Academic Research, 4(12).
- Maltsoglou, I., Kojakovic, A., Rincón, E.L., & , Felix, E., Branca, G., Valle, S., … Thofern, H. (2015). Combining bioenergy and food security: An approach and rapid appraisal to guide bioenergy policy formulation. Biomass and Bioenergy, 79, 80–95.10.1016/j.biombioe.2015.02.007
- Melkonyan, A., Krumme, K., Gruchmann, T., & De La Torre, G. D. L. (2017). Sustainability assessment and climate change resilience in food production and supply. Energy Procedia, 123, 131–138.10.1016/j.egypro.2017.07.236
- Mock, N., Morrow, N., & Papendieck, A. (2013). From complexity to food security decision-support: Novel methods of assessment and their role in enhancing the timeliness and relevance of food and nutrition security information. Global Food Security, 2, 41–49.10.1016/j.gfs.2012.11.007
- Panudju, T., Bahar, I., Nendi, Yafas, F., Rahmawati, H., B, S. R., … Sulaiman, M. (2013). Cetak Sawah Indonesia
- Pertanian, K. (2015). Rencana strategis Kementerian Pertanian Tahun 2015–2019.
- Pradhito, N. H., Chou, S. Y., Dewabharata, A., & Wirjodirdjo, B. (2013). Rice fulfillment analysis in system dynamics framework (study case: East java, Indonesia). Paper presented at the The Institute of Industrial Engineers Asian Conference 2013, Taipei
- Rutten, M., Achterbosch, T. J., De Boer, I. J., Cuaresma, J. C., Geleijnse, J. M., Havlík, P., … Van Meijl, H. (2016). Metrics, models and foresight for European sustainable food and nutrition security: The vision of the SUSFANS project. Agricultural Systems. doi:10.1016/j.agsy.2016.10.014
- Sayaka, B., & Tarigan, H. (2011). Efektivitas peraturan dalam mengendalikan konversi lahan pertanian. In S. M. Pasaribu, H. P. Saliem, H. Soeparno, E. Pasandaran, & F. Kasryno (Eds.), Konversi dan Fragmentasi Lahan: Ancaman terhadap Kemandirian Pangan (pp. 279–292). Bogor: PT Penerbit Press IPB.
- Schindler, J., Graef, F., König, H. J., Mchau, D., Saidia, P., & Sieber, S. (2016). Sustainability impact assessment to improve food security of smallholders in Tanzania. Environmental Impact Assessment Review, 60, 52–63.10.1016/j.eiar.2016.04.006
- Secretariat, A. (2016). ASEAN Agricultural Commodity outlook No. 17 Dec 2016 ASEAN Agricultural Commodity outlook. Thailand.
- Setiawan, S. R. D. (2017). BI Minta Bank Turunkan Suku Bunga Kredit. Retrieved from Kompas.com
- Sterman, J. D. (2004). Systems thinking and modeling for a complex world. Mc Graw-Hill.
- Sun, Y., Liu, N., Shang, J., & Zhang, J. (2017). Sustainable utilization of water resources in China: A system dynamics model. Journal of Cleaner Production, 142, 613–625.10.1016/j.jclepro.2016.07.110
- Surahman, A., Soni, P., & Shivakoti, G. P. (2018). Reducing CO 2 emissions and supporting food security in Central Kalimantan, Indonesia, with improved peatland management. Land Use Policy, 72, 325–332.10.1016/j.landusepol.2017.12.050
- Thibert, J., & Badami, M. G. (2011). Estimating and communicating food system impacts: A case study in Montreal, Quebec. Ecological Economics, 70, 1814–1821.10.1016/j.ecolecon.2011.05.008
- Tsolakis, N., & Srai, J. S. (2017). A system dynamics approach to food security through smallholder farming in the UK. Chemical Engineering Transactions, 57.
- Van der Laan, C. V. d. & Wicke, B., Verweij, P. A., & Faaij, A. P. C. (2017). Mitigation of unwanted direct and indirect land-use change - an integrated approach illustrated for palm oil, pulpwood, rubber and rice production in North and East Kalimantan, Indonesia. GCB Bioenergy, 9(2), 429–444.10.1111/gcbb.2017.9.issue-2
- WBCSD. (2000). Eco-efficiency: Creating more value with less impact.
- Wei, S., Yang, H., Song, J., Abbaspour, K. C., & Xu, Z. (2012). System dynamics simulation model for assessing socio-economic impacts of different levels of environmental flow allocation in the Weihe River Basin, China. European Journal of Operational Research, 221(1), 248–262.10.1016/j.ejor.2012.03.014
- WFP, W. F. P., Pangan, D. K., & Pertanian, K. (2015). Food security and vulnerability atlas of Indonesia 2015.
- Wossen, T., & Berger, T. (2015). Climate variability, food security and poverty: Agent-based assessment of policy options for farm households in Northern Ghana. Environmental Science & Policy, 47, 95–107.10.1016/j.envsci.2014.11.009
- Xu, Y., & Szmerekovsky, J. (2017). System dynamic modeling of energy savings in the US food industry. Journal of Cleaner Production, 165, 13–26.10.1016/j.jclepro.2017.07.093
- Ye, L., & Van Ranst, E. (2009). Production scenarios and the effect of soil degradation on long-term food security in China. Global Environmental Change, 19(4), 464–481.