
 ?Mathematical formulae have been encoded as MathML and are displayed in this HTML version using MathJax in order to improve their display. Uncheck the box to turn MathJax off. This feature requires Javascript. Click on a formula to zoom.
Abstract
This study uses primary data collected from 522 farm households in the Collines region in Benin and Fractional Multinomial Logit to access and analyse the factors affecting cropland allocation in rural Benin, considering four groups of crops: cereals, root and tuber, legumes and other industrial crops. We found that land allocation between crops is a challenging process for rural household who have to consider many factors when choosing the size of cropland. Household size, access to extension services and fertilizer play an important role in allocating land for cereal crops while the type of labour use, the membership to farmer-based association and total land size affect household land allocation to industrial crops. The study recommends that the ongoing crop diversification policy in the country should be more inclusive and provide realistic support to every categories of farmers based on cropping pattern and also consider the agricultural land reforms.
PUBLIC INTEREST STATEMENT
In subsistence agriculture, farmer seldom focuses on growing a single crop. With market imperfection, climate variability and poor policy, many farmers try to diversify their production with the aim to meet the minimum need and mitigate risks. At the same time, resources such as land are very scarce and need to be well managed. Allocating the limited land to the different crops gowned by the farmer may be challenging. Understanding drivers of land allocation between crops is an important component of policy formulation in rural areas. The study found that household size, access to extension services and fertilizer play an important role in allocating land for cereal crops while the type of labour use, the membership to farmer-based association and total land size affect household land allocation to industrial crops.
Competing interests
The author declares no competing interests.
1. Introduction
Achieving the second objective of the sustainable development goals, which is zero hunger, requires finding a way to increase the income and assets of rural people living in sub-Saharan Africa countries. Yet, reducing poverty, food and nutrition insecurity in the developing countries continues to be a major public policy issue (Babatunde & Qaim, Citation2010). The structural transformation paradigm has shown that in countries where 70–80% of the rural population like in Benin derive the main part of their income from agriculture, poverty and food insecurity reduction depends on agricultural productivity growth (Jayne et al., Citation2003).
Agriculture in Benin is dominated by smallholder farming system and many communities depend largely on agricultural products for their livelihoods. It is mainly a family activity based on small farms (less than 2 ha) and oriented towards multi-crop associated with traditional small livestock. This system allows farmers to diversify risks and helps to deal with yield and farm income variability. Although crop diversification was an old form of farming system, it received a lot of attention and has been extensively developed in Benin from 2002 after the cotton sector failure. Still, small-scale farmers in Benin remain vulnerable to many factors that negatively affect their production and income. These factors are climate change, poor access to inputs, lack of adequate policies, soil degradation, low use of technologies and poor infrastructures (MAEP, Citation2011). In 2006, the government of Benin through its Minister of Agriculture lunched the strategic plan for the revitalization of agricultural sector. The aim of this plan was the promotion of agricultural diversification through large participatory approach and institutional support. One of the most important objectives of diversification in agricultural activities is to decrease the overall production risks by selecting a set of crops whose risks profiles are different and uncorrelated and can also help to increase food availability in the household.
Land allocation and exploitation have long been identified as having a fundamental influence on agricultural development paths and poverty reduction (Jayne, Chamberlin, & Headey, Citation2014). As the key factor of agricultural production, land remains a critical input. Like in many developing countries, agricultural intensification in Benin depends on efficient land management and use, and other resources reallocation (Edet, Sunday, Akpan, & Raphael, Citation2011). Although the crops diversification objective is to alleviate risk and uncertainty, access to resources such as land, labour, fertilizer, credits and other inputs remained challenging in Benin where only cash crops receive support from the government. Like in many developing countries, securing access to agricultural land is critical for farmers in rural Benin. Modern, efficient and transparent land tenure system is important in alleviating poverty and reduces food insecurity in countries where agriculture remains the main source of rural livelihood.
In Benin, modern law which establishes the registration of land leading to land title remains inaccessible to the majority of the population, due to the cost and complexity of the procedure (less than 1% of the land is registered in Benin). Almost all the land remains under the customary status governed by secular rules and practices. The current land tenure system is characterized by insecurity, particularly in areas of high agro-land pressure. Given the population pressure, land use is becoming a source of challenge and many conflicts. In the context of agriculture, diversification is regarded as the reallocation of some of a farming’s productive resources, such as land, capital, labour and farm equipment, into new farm activities (Sichoongwe, Mapemba, Tembo, & Ng’ong’ola, Citation2014). According to Kruseman, Ruben, Kuyvenhoven, Hengsdijk and Van Keulen (Citation1996), efficient land utilization and management practices ensure achievement of farm-level objectives in terms of economic viability, food security and risk aversion. The need to understand household decision in terms of resource allocation such as land is critical for agricultural policies since land is the fundamental input in agricultural production. For example, how much land a household allocates to a specific crop depends on several economic, environmental and social factors. The aim of this study is to determine and analyse the factors affecting household cropland allocation. The following sections are organized as follows. We first present the literature review which summarized previous studies, followed by the methodology and the results. The paper ended with the conclusion and policy recommendations.
2. Literature review
Agricultural land-allocation decision is derived from the basic economic theory of household utility related to farm production and management. These decisions necessitate crop choices and cropland allocation with implications for farm household’s crops diversification level (Nkonya, Pender, Kaizzi, Edward, & Mugarura, Citation2005). Land use is linked with many human activities and environment. It is a complicated process induced by nature and human together, so the study on land allocation can covers many aspects for different purposes (Styers, Chappelka, Marzen, & Somers, Citation2010). Many researchers (Chakir & Lungarskay, Citation2015; Moore, Gollehon, & Carey, Citation1994a; Seppelt & Voinov, Citation2002, Citation2003) have already taken land allocation as an effective means to reach various achievements, economic benefits in particular. Many of the studies that tried to understand the drivers of agricultural land allocation have weaknesses in linking their results with some policy recommendations. Dhakal (Citation2016) focuses on allocating land to different varieties of a particular crop. Producing reliable crop budgets and enterprise cost of production estimates requires sound estimation of land allocations among crops, because farmers are involved in several crops production and do not record input use by crop. According to Hornbaker, Dixon and Sonka (Citation1989), land allocation is the main element of the farmer’s production plan. Van Meijl, Van Rheenen, Tabeau and Eickhout (Citation2006) introduced a land allocation methodology using land supply curves to facilitate the conversion of idle land to productive land in economic way.
Estimating a land-use shares model in France, Chakir and Lungarskay (Citation2015) assume that the landowner derives the optimal land allocation from his profit-maximization problem and focuses on the landowner’s decision to allocate land to five possible uses: crop production, pastures, forest, urban and other uses. The situation in rural areas in Benin is quite different since farmers decision to allocate land is mainly focused on the different crops grow by the farmers.
Many approaches have been used in modelling agricultural land allocation. One simulated land-use decision making by farmers faced with climatic uncertainties (Domptail & Nuppenau, Citation2010) and other applies in agricultural production, economy, policy, landscape, transportation and social welfare (Leroux & Creedy, Citation2007; Subbaiah, Annepu, & Kandukuri, Citation2010; Svoray, Bar, & Bannet, Citation2005; Vold, Citation2005). Most case studies in land allocation are focused on solving either socio-economic or environmental problems, but some researchers fix their attentions on the impacts of multiple factors on land allocation, including economic, social and environmental objectives and implications (Hajehforooshnia, Soffianian, Mahiny, & Fakheran, Citation2011; Mohaddes, Ghazali, Rahim, Nasir, & Kamaid, Citation2008).
Agricultural land allocation decisions comprise a subset of spatial optimization models and involve efficient distribution of activities over feasible sites in order to meet current farm household’s demands in relation to physical, economic, environmental or social constraints. Researchers use a range of methods for land-use allocation. The models applied for land allocation include linear model, system dynamics model, multi-objective model, multi-agent system model, grey prediction model and GIS (Geographic Information System)-based model (Cao, Huang, Wang, & Lin, Citation2012; Kang, Yao, & Liu, Citation1999; Le, Park, Vlek, & Cremers, Citation2008). Studying agricultural land-use pattern in Pulwama district in India, Bhat (Citation2013) found that the physical factors determine plots size, while socio-economic factors determine the extent of diversification.
On the specific case, the multi-output model has been used to evaluate the land allocation in the multi-crops environment. Moore, Gollehon and Carey (1994b) applied the model of multi-outputs firm to a farm enterprise engaged in irrigation production. The study found that in the context of irrigated field crop production, producers respond to water price at the extensive margin of water use (crop-choice and land allocation decisions) rather than the intensive margin (short-run water use decisions).
It is obviously important to treat multi-crop outputs on the production side since farmers in developing countries are seldom specialized in cultivating a single crop; instead they grow a variety of outputs, some mainly to meet family consumption needs, and others for the market. Linear programming models (Chakir & Lungarskay, Citation2015; Seppelt & Voinov, Citation2003) have been used to analyse the allocation of resources between various competing crops on the farm, but these generally neglect the interdependence between production and consumption decision that characterize smallholder farmers.
3. Methodology
3.1. Methods of analysis
To examine how a household chooses to allocate its land between multiple crops, we assume a rational household striving to maximize his expected utility which is a function of consumption of agricultural goods (Ca), consumption of non-agricultural goods (Cm) and leisure (Cl). The utility of the household derives from various consumption combinations and levels depends on the preferences of its members (X), shaped by the characteristics of the household. These decisions are constrained by a fixed production technology that combines purchased inputs (Z), labour (L) and allocation of a fixed land area (A) among the crops:
where w, Pa, Pz, Pm are, respectively, the market wage, price of output, price of input and price of non-agricultural purchased goods. Qj is a farm output for the crop j, αj is the risk associated with crop j, Y is the off-farm income. T, H, F and O are total time available, farm production time, leisure time and off-farm activities time.
The production and consumption decisions of the household cannot be separated when markets for labour, other inputs or products are imperfect. In a country like Benin where there is no agricultural intensification policy, land allocation is the main determinant of agricultural production. While others household’s choices can affect total production, most supply response models use land area as a proxy for total production since the two are highly correlated and because agricultural production is difficult to measure in developing countries (Askari & Cummings, Citation1977). With this understanding, the variable Q can represent the share of land allocated to each crop category.
The choice of Q will then depend on some variables such as inputs, labour, total land available, household’s socio-economic characteristics, prices, income generating activities, physical conditions. The general form of the equation can be expressed as follows:
where P is a vector of the expected prices. Because all household do not grow all types of crop, the study groups the crops by categories. We consider four categories such as cereals, root and tubers, legumes, industrial crops. We assume that technology, inputs and outputs prices and time allocation are homogeneous within crop groups. It is important to clarify that the industrial crops are exclusively cotton and cashew.
In practice, many farmers may actually combine two or more crops on the same plot. Determining the share of land allocated to a specific crop in that context may be challenging and confusing. In order to solve this issue, we approximated the cropland size using the seed quantity used by the household. With the seed quantity standard per hectare, we estimate share of land allocated to a specific crop in the context of multi-cropping.
Q is the dependent variable, representing a vector of cropland shares for the portfolio of crops chosen by a household. We used the fractional multinomial logit as the estimation technique which combines two variations on the standard logit model: the fractional logit and the multinomial logit. The outcome (the fractional multinomial logit) is that the explained variable Q is able to represent the different shares of various types of Q, all of which sum to 1. For this reason, the model is in the category of multivariate fractional logit models (Mullahy, Citation2011). It measures the changes in shares of multiple variables simultaneously as a result of some explanatory variables. In other words, it allows one to ask how the slices of a pie chart change between observations as a result of differences in a certain set of related factors. In this case, the whole pie chart is a household’s total number of cultivated land, meaning that the fractional multinomial logit model can help to see how changes in household socio-economics characteristics affect the share of land devoted to cereals, roots and tuber, legumes and industrials crops.
Following Papke and Wooldridge (Citation1996), we assume that the variable Q, 0 ≤ Q ≤ 1, is to be explained by a 1 × K vector of independent variables.
W ≡ (w1, w2, …, wk), with the convention that w1 ≡ 1. The final model will therefore be in the form of
where β is a K × 1 vector, which cannot guarantee the best description of E(Q/W). The principal reason is because the value of y is between 0 and 1, and therefore, the effects of the explanatory variables cannot remain constant throughout the range of w (unless the range of Wj is very limited). This problem can be solved by increasing a linear model with a nonlinear function of x, but the predicted values from an ordinary least square regression cannot be guaranteed to remain in the unit interval. Thus, the consequences of using linear estimations for fractional analysis are similar to those of the linear probability model for binary data.
The alternative ways of applying Equation (1) have been to model the log-odds ratio as a linear function (Papke & Wooldridge, Citation1996). If w is strictly between 0 and 1 then a linear model for the log-odds ratio is
By fitting the fractional logit function into the multinomial logit quasi-likelihood function, the econometric model can measure shares of outcomes in what is a simplified form of the log likelihood function (Mullahy, Citation2011). The approach employed the linear exponential family uses a quasi-maximum likelihood estimator (QMLE) and is efficient and consistently normally distributed, provided the fractional logit function holds true (Ye & Pendyala, Citation2005). The QMLE approach maximizes this new function and, with the assistance of a fractional multinomial logit STATA package, runs until it has converged and is able to predict crop shares. Table provides details on the variables used for the estimation.
Table 1. Independent variables
3.2. Location of the study
Benin is a coastal country located in West Africa. It is divided into 12 regions including the region of Collines. Located in the centre of Benin, Collines region covers an area of 13,931 km2, which represents 12% of the total land area of Benin. According to the last general population census in 2013, it has 716,558 inhabitants, representing 7.2% of the total population of Benin. The region is divided into six municipalities: Bante, Dassa-Zoume, Glazoue, Ouessè, Savalou and Save. The economic activities of the area are primarily agriculture (71%). The region is the largest producer of roots and tubers in Benin and usually ranks between second and third position for cereal production. Yet, as stated by the National Statistics Institute, it remains one of the poorest regions of Benin, with an incidence of poverty estimated at 46% in 2011 (INSAE, Citation2013). The food situation in the region of Benin is also critical despite the amount of agricultural production that comes from that region.
3.3. Data source and sampling technique
The data used for this study are exclusively from primary sources and have been collected from five municipalities in the Collines region in Benin. A questionnaire was designed and administrated at the household’s level to the head of household with face-to-face interviewed. The study used the multistage sampling procedure where it started with a purposive selection of the Collines region. We choose the region because the crops diversification level is very high and households are engage in growing on average more than three crops. There are six municipalities within the region. Based on the importance of agricultural activities in the municipalities, five municipalities out of six served as the study area: Bante, Dassa-Zoume, Glazoue, Ouessè, Savalou. Multi-stage sampling technique was employed for this study. First, we compute a sample size using (Cochran, Citation1977) approach:
n is the required sample size, z is the confidence level, p is the estimated prevalence of farm attribute in the area, m is the margin of error.
In our specific case, in order to minimize the error, we will use the confidence level of 95% with the standard value of 1.96, the margin of error (m) is 1%. The population study is meant for all the farm households in the Collines region, and they represent 65% of the total household in the region (INSAE, Citation2013). Therefore, p = 0.65.
The sample size was increased by 50% to account for contingencies such as non-response or recording error.
Finally, the study retained 522 household because of two incomplete questionnaires. The next stage consisted of distributing the 522 respondents among the five municipalities according to the percentage of farm household in the municipalities and that is shown in Table .
Table 2. Sampling distribution
Each municipality is divided into districts, and in each municipality, the study randomly selected 50% of the districts. The household’s selection has been done based on the information provided by the agricultural extension officers and the farmer-based organization. The sampling was distributed among the selected districts based on the number of the agricultural households. The farm households that were enumerated were randomly selected from the total farm household list of the district.
4. Results and discussions
4.1. Socio-economics and demographics characteristics
Table presents the summary descriptive statistics of the data. As stated in Section 3, data were collected from 522 farm households. Most of our household heads are male (77%) against 23% female. Most of the female-headed households have been interviewed in the absence of their husbands generally migrated to Nigeria. On average, the age of the men-headed households is 45 years against 38 years for female-headed households. The level of standard deviation also shows that there is a wide variation within the age groups. Regarding the household’s size, Table shows that on average the household’s size is composed of 7 persons, although some households have up to 16 members. The average land size is 13 ha for men-headed households and 11 ha for female-headed households. There is a high dispersion among the land size regarding their standard deviation. Table also shows that households in Collines region seldom grow one crop; at least, each household is involved in two crops to a maximum of six different crops. The crops produced varied from cereals to industrial crops.
Table 3. Socio-economics and demographics characteristics
Figure describes the different modes of land access in the region. We observe that most of the agricultural lands are accessed through inheritance. Up to 77% of the land cultivated by farmers is accessed through inheritance, and the rest is accessed through gift (14%), rent (5%) and purchased (3%). Land is an essential factor for the revival of agriculture in Benin. It becomes necessary to initiate, develop and implement measures for assisting in the establishment of better agricultural land security.
Figure 1. Mode of land access.
Source: Survey data, 2015.
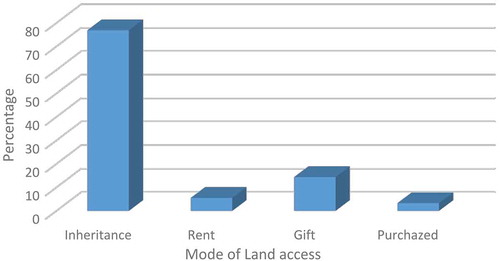
Table provides details on the share of crops land size per municipality. Except for the municipality of Savalou, the industrial crops represent up to 50% of the crops land area. The highest proportion of land size allocated to cash crops is for cashew. Collines region is the largest cashew producer in the country. Cereal crops occupy the second place in terms of land allocated except the municipality of Glazoue where roots and tuber are the second crops in terms of the size of land use. Cereal crops are dominated exclusively by maize and rice. On average, Table shows that cash crops (Cashew and Cotton) represent the most cultivated crops in terms of land use followed by cereals, roots and tuber and legumes.
Table 4. Share of crop land size per municipality
4.2. Estimation results
Table presents the estimated marginal effects from the fractional multinomial logit model. The study uses the industrial crops land share as base variable. This has been chosen because it gives a more consistent result compared to the other crop groups’ categories. The model is globally significant as shown by the chi-square result with a probability of 0.0000. From the result in Table , the variable sex is significant for cereals, legumes and industrial crops land allocation. The coefficients show that compared to women-headed households, men-headed household has on average 2.6% and 12.4% more land devoted, respectively, to cereals and industrial crops (cotton and cashew). On the other hand, the results show that women-headed households allocate on average 1.5% land to legumes crops than men-headed households. This is in line with Doss (Citation2006), who found that women’s access to land still remains a challenge in most developing countries and women ability to produce certain crops is limited by the land-access status.
Table 5. Average marginal effects derived from the fractional multinomial logit
From Table , age of the households’ head is negatively associated with the share of land devoted to cereal crops, which suggest that one additional year of the households’ head will decrease the share of land allocated to cereals by about 5.5%. It means that as the age of the household head increases, he tempts to reduce the share of land allocated to cereals and to a less extent, to legume. Almost every household grows cashew in the region and therefore, as the age of the household head increased, they prefer to rely on that perennial crops instead of increasing the size of land allocated to the other crops. This is in line the results found by Perz (Citation2002) which established that old household heads seem to have less resources and capability to invest into intensive crops.
The variable, primary education, is also significant for cereals crops land share. Compared to those who did not attend school, household heads that reach primary school are more likely to increase the share of land devoted to cereals crops by 2.1% and reduce the share of land devoted to industrial crops by 4.0%. This may be due to the fact that educated households head are more aware about the food security issues and try to secure more food for household consumption.
The result also shows that the household size is significant with positive relation for cereals and negative for industrials crops and one additional household member on average increased the share of land allocated to cereals by 3.7% and decreased that of industrial crops by 11.4%. It is in accordance with the results of Brandt, Huang, Li and Rozelle (Citation2002) who found that the land allocated to cereal crops in many developing countries is in relation to the household size in order to ensure enough food for the consumption of the household. This also explains why the household size is negatively associated with cash crops land size. As the household size increases, the demand for food consumption increases and therefore farmers attempt to reduce the land allocated to industrial crops.
The hired labour coefficient indicates that one additional unit of hired labour man/day will increase the share of land devoted to root and tuber by 4.7% and that of industrial crops by 3.2%. The type of labour is significant with positive relationship for roots and tubers and industrial crops. Indeed, industrial crops (cashew and cotton) and roots and tubers are labour intensive and therefore, it become difficult for the household to use only family labour for these crops. This is true since most of the household interviewed seldom use only family labour, and according to Kokoye, Tovignan, Yabi and Yegbemey (Citation2013), industrial crops such as cotton require more labour force and so households who are able to combine domestic labour force and hired labour are more likely to allocate more land to cash crops.
Access to fertilizer has a positive effect on the share of land allocated to cereals, legumes and negative relationship with industrial crops. Households that have access to fertilizer are more likely to increase the share of land allocated to cereals and legumes crops respectively by 13% and 3.6% and reduce that of industrial crops by 21%. It is important to note that industrial crop here make reference exclusively to cotton. Because of soil degradation problems and low productivity, fertilizer is very important for crops production in Benin. Access to fertilizer in the region is mostly conditional to cotton production, and many farmers declare a higher amount of their cotton land size just in order to get fertilizer for the other crops such as cereals and legumes. Access to fertilizer itself is a big challenge in Benin especially for households that are not involved in cotton production and who are not members of producer organizations. Considering the industrial crops (cotton and cashew), fertilizer is exclusively used for cotton production and access to fertilizer in the Collines region depends entirely on the household willingness to grow cotton.
Access to extension services is also significant, negatively related to the share of land allocated to legumes and cereal crops and positively related to the land allocated to industrial crops. Compared to those who did not have access to extension services, households who have access are more likely to reduce the share of land allocated to legumes and cereals respectively by 2.0% and 6.7% and increase the share of land allocated to industrial crops by 3.9%. The explanation for this is that extension officers tend to put more emphasis on promoting industrials crops especially cotton, and in the Collines region where cotton production has been very low since 2004, the objective of government through the extension officers is to revitalize the sector by promoting cotton.
Land size and land ownership are positively significant only for industrial crops, and households increase the share of land devoted to industrial crops by 42.3% if the size of land cultivated increases by 1 ha. Cashew is the most cultivated industrial crop in the region and owning the land is important since cashew is a perennial crop that can hold the land for up to 30 years. Additionally, the result shows that households that own land are more likely to reduce the share of land allocated to legume crops by 6.1%. The rational is to first ensure land for cereals and then allocate land to industrial crops as many of household are subsistent farmers.
The results indicated that household location also influence land allocation decision. From Table , comparing households living in Savalou municipality (which is the reference) with households living in Ouesse is more likely to reduce the share of land devoted to cereals and legumes crops respectively by 4.7% and 1.8% and increase the share of industrial crops by 7.2%. According to Todkari, Suryawanshi, Suryawanshi and Patil (Citation2010), land allocation decisions can also be influenced by geo-climatic and historical differences from one region to another.
Participation in non-farm activities is negatively associated with the share of land allocated to cereals and roots and tubers but positively related with industrial crops. Households that participate in these activities are more likely to reduce the share of land allocated to cereals and roots and tubers respectively by 3.1% and 3.9% and increase that of industrial crops by 7.7%. It can be explained by the fact that the income gained from non-farm activities is used to purchase food and therefore concentrate on industrial crop which is mainly cashew.
5. Conclusion and policy implication
This study investigated the crops land allocation issues under crop diversification. The findings suggest that many factors affect households’ choice in terms of how much land are allocated to a specific crop group and these choices are interrelated. We realized that the factors affecting land allocation depend on the types of crops cultivated by the household. In the subsistence agriculture, producing enough food for household consumption is very important and the result shows that households tend to allocate more land to cereals as the household size is increasing. Also, household’s choice to allocate a certain amount of land to a specific crop depends on the importance of that crop for the household. This also shows how much household demographic characteristics have diverse and complex effects on cropland allocation in rural Benin. Finally, the results show the role of extension services in promoting industrial crops especially cotton; households with access to extension services tend to increase the share of land devoted to cotton while decrease the share devoted to cereals. Access to fertilizer is mostly conditional to cotton production and most of farmers use this method to get fertilizer in order to redistribute to other crops. In designing agricultural policy support for a specific crop such as cotton in Benin, policy makers should bear in mind that household decisions towards other crops are very important and this policy may lead to other result instead of the expected. The study recommends that the ongoing crops diversification policy in the country should be more inclusive and provide realistic support to every category of farmers based on cropping pattern and also consider agricultural land reforms as part of all the strategy. It is the only way to achieve both food self-sufficiency for households and promote less-produced crops such as cotton in the region. The current land policy in Benin does not distinguish between agricultural and non-agricultural land. Regarding the farmers cropland allocation, land fragmentation is commonly practised in the Collines region and that is mainly due to the challenges in getting right land for a specific crop.
Competing interests
The author declares no competing interests.
Additional information
Funding
Notes on contributors
Gilbert Onionkiton Adjimoti
Gilbert Onionkiton Adjimoti is currently research assistant in the Department of Economics of the University of Abomey-Calavi (Benin). He got a PhD from the University of Ghana, Legon in Applied Agricultural Economics and Agribusiness in 2016. Gilbert was a PhD Candidate at the time this article was produced. His areas of interest include agricultural policy analysis, food security, rural development and social protection.
References
- Askari, H., & Cummings, J. T. (1977). Estimating agricultural supply response with the Nerlove model: A survey. International Economic Review, 18(2), 257–292. doi:10.2307/2525749
- Babatunde, R. O., & Qaim, M. (2010). Impact of off-farm income on food security and nutrition in Nigeria. Food Policy, 35(4), 303–311. doi:10.1016/j.foodpol.2010.01.006
- Bhat, M. M. (2013). Agricultural land-use pattern in Pulwama district of Kashmir Valley. International Journal of Economics, Business and Finance, 1(5), 80–93.
- Brandt, L., Huang, J., Li, G., & Rozelle, S. (2002). Land rights in rural China: Facts, fictions and issues. The China Journal, 47, 67–97. doi:10.2307/3182074
- Cao, K., Huang, B., Wang, S., & Lin, H. (2012). Sustainable land use optimization using boundary-based fast genetic algorithm. Computers, Environment and Urban Systems, 36(3), 257–269. doi:10.1016/j.compenvurbsys.2011.08.001
- Chakir, R., & Lungarskay, A. (2015). Agricultural land rents in land use models: A spatial econometric analysis. Paper prepared for presentation at the 150th EAAE seminar. Edinburgh: Scotland’s Rural College, Edinburgh, Scotland October 22-23, 2015.
- Cochran, W. G. (1977). Sampling techniques (3rd ed.). John Willey and Sons. NY: New York.
- Dhakal, B. (2016). Can we get better information by any alternative to conventional statistical approaches for analysing land allocation decision problems? A case study on lowland rice varieties. Land Use Policy, 54, 522–533. doi:10.1016/j.landusepol.2016.03.006
- Domptail, S., & Nuppenau, E.-A. (2010). The role of uncertainty and expectations in modeling (range) land use strategies: An application of dynamic optimization modeling with recursion. Ecological Economics, 69(12), 2475–2485. doi:10.1016/j.ecolecon.2010.07.024
- Doss, C. (2006). The effects of intrahousehold property ownership on expenditure patterns in Ghana. Journal of African Economies, 15(1), 149–180. doi:10.1093/jae/eji025
- Edet, J., Sunday, U., Akpan, B., & Raphael, E. (2011). Economic analysis of land allocation use and intensification among arable crop farmers in Uruan local government area of Akwa-Ibom State, Nigeria. Journal of Economics and Sustainable Development, 2(11), 1–11.
- Hajehforooshnia, S., Soffianian, A., Mahiny, A. S., & Fakheran, S. (2011). Multi objective land allocation (MOLA) for zoning Ghamishloo Wildlife Sanctuary in Iran. Journal for Nature Conservation, 19(4), 254–262. doi:10.1016/j.jnc.2011.03.001
- Hornbaker, R. H., Dixon, B. L., & Sonka, S. T. (1989). Estimating production activity costs for multioutput firms with a random coefficient regression model. American Journal of Agricultural Economics, 71(1), 167–177. doi:10.2307/1241785
- INSAE. (2013). Evaluation de la pauvreté au Bénin. Cotonou, Institut National de Statistique et d'Analyse Economique, Benin.
- Jayne, T. S., Chamberlin, J., & Headey, D. D. (2014). Land pressures, the evolution of farming systems, and development strategies in Africa: A synthesis. Food Policy, 48, 1–17. doi:10.1016/j.foodpol.2014.05.014
- Jayne, T. S., Yamano, T., Weber, M. T., Tschirley, D., Benfica, R., Chapoto, A., & Zulu, B. (2003). Smallholder income and land distribution in Africa: Implications for poverty reduction strategies. Food Policy, 28, 253–275. doi:10.1016/S0306-9192(03)00046-0
- Kang, M. Y., Yao, H. R., & Liu, S. (1999). Land use structure optimization for Guanzhong Region, Shaanxi Province. Journal of Natural Resources, 14(2), 363–367.
- Kokoye, S. E. H., Tovignan, S. D., Yabi, J. A., & Yegbemey, R. N. (2013). Econometric modeling of farm household land allocation in the municipality of Banikoara in Northern Benin. Land Use Policy, 34, 72–79. doi:10.1016/j.landusepol.2013.02.004
- Kruseman, G., Ruben, R., Kuyvenhoven, A., Hengsdijk, H., & Van Keulen, H. (1996). Analytical framework for disentangling the concept of sustainable land use. Agricultural Systems, 50(2), 191–207. doi:10.1016/0308-521X(94)00074-2
- Le, Q. B., Park, S. J., Vlek, P. L. G., & Cremers, A. B. (2008). Land-Use Dynamic Simulator (LUDAS): A multi-agent system model for simulating spatio-temporal dynamics of coupled human-landscape system. I. Structure and theoretical specification. Ecological Informatics, 3(2), 135–153. doi:10.1016/j.ecoinf.2008.04.003
- Leroux, A. D., & Creedy, J. (2007). Optimal land conversion and growth with uncertain biodiversity costs. Ecological Economics, 61(2–3), 542–549. doi:10.1016/j.ecolecon.2006.05.005
- MAEP. (2011). Plan stratétique de Relance du Secteur Agricole. Republique Du Benin: Ministere de l’Agriculture, de l’Elevage et de La Peche, Cotonou-Benin.
- Mohaddes, S. A., Ghazali, M., Rahim, K. A., Nasir, M., & Kamaid, A. V. (2008). Fuzzy environmental-economic model for land use planning. American-Eurasian Journal of Agriculture & Environmental Science, 3(6), 850–854.
- Moore, M. R., Gollehon, N. R., & Carey, M. B. (1994a). Alternative models of input allocation in multicrop systems: Irrigation water in the Central Plains, United States. Agricultural Economics, 11, 143–158. doi:10.1016/0169-5150(94)00025-5
- Moore, M. R., Gollehon, N. R., & Carey, M. B. (1994b). Multicrop production decisions in western irrigated agriculture: The role of water price. American Journal of Agricultural Economics, 76(4), 859–874. doi:10.2307/1243747
- Mullahy, J. (2011). Multivariate fractional regression estimation of econometric share models, Department of Population Health Science, University of Wisconsin-Madison.
- Nkonya, E., Pender, J., Kaizzi, C., Edward, K., & Mugarura, S. (2005). Policy options for increasing crop productivity and reducing soil nutrient. International Food Policy Research Institute. Washington, DC.
- Papke, L. E., & Wooldridge, J. M. (1996). Econometric methods for fractional response variables with an application to 401(k) plan participation rates. Journal of Applied Econometrics, 11(6), 619–632. doi:10.1002/(SICI)1099-1255(199611)11:6<619::AID-JAE418>3.0.CO;2-1
- Perz, S. G. (2002). Household demography and land use allocation among small farms in the Brazilian Amazon. Human Ecology Review, 9(2), 1–16.
- Seppelt, R., & Voinov, A. (2002). Optimization methodology for land use patterns using spatially explicit landscape models. Ecological Modelling, 151(2–3), 125–142. doi:10.1016/S0304-3800(01)00455-0
- Seppelt, R., & Voinov, A. (2003). Optimization methodology for land use patterns—Evaluation based on multiscale habitat pattern comparison. Ecological Modelling, 168(3), 217–231. doi:10.1016/S0304-3800(03)00138-8
- Sichoongwe, K., Mapemba, L., Tembo, G., & Ng’ong’ola, D. (2014). The determinants and extent of crop diversification among smallholder farmers: A case study of Southern Province Zambia. Journal of Agricultural Science, 6(11), 150–159. doi:10.5539/jas.v6n11p150
- Styers, D. M., Chappelka, A. H., Marzen, L. J., & Somers, G. L. (2010). Developing a land-cover classification to select indicators of forest ecosystem health in a rapidly urbanizing landscape. Landscape and Urban Planning, 94(3–4), 158–165. doi:10.1016/j.landurbplan.2009.09.006
- Subbaiah, K. V., Annepu, G., & Kandukuri, N. R. (2010). Economic and ecological based land allocation in fuzzy environment-a case study. In Proceedings of the twenty-fifth Indian engineering congress, Kochi (pp. 16–19). Royal Asiatic Society of Bengal, Kochi.
- Svoray, T., Bar, P., & Bannet, T. (2005). Urban land-use allocation in a Mediterranean ecotone: Habitat Heterogeneity Model incorporated in a GIS using a multi-criteria mechanism. Landscape and Urban Planning, 72(4), 337–351. doi:10.1016/j.landurbplan.2004.05.001
- Todkari, G. U., Suryawanshi, S. P., Suryawanshi, M. V., & Patil, B. D. (2010). Agriculture landuse pattern in Solapur district of Maharashtra. International Journal of Agriculture Sciences, 2(2), 1–8. doi:10.9735/0975-3710.2.2.1-8
- Van Meijl, H., Van Rheenen, T., Tabeau, A., & Eickhout, B. (2006). The impact of different policy environments on agricultural land use in Europe. Agriculture, Ecosystems and Environment, 114(1), 21–38. doi:10.1016/j.agee.2005.11.006
- Vold, A. (2005). Optimal land use and transport planning for the Greater Oslo area. Transportation Research Part A: Policy and Practice, 39(6), 548–565. doi:10.1016/j.tra.2005.02.007
- Ye, X., & Pendyala, R. M. (2005). A model of daily time use allocation using fractional logit methodology. In H. S. Mahmassani (Ed.), Transportation and traffic theory, flow, dynamics and human interaction. 16th international symposium on transportation and traffic theory (pp. 507–524). Park Maryland, Pergamon, Elsevier Science Ltd., Oxford, UK, pp. 507-524.