
 ?Mathematical formulae have been encoded as MathML and are displayed in this HTML version using MathJax in order to improve their display. Uncheck the box to turn MathJax off. This feature requires Javascript. Click on a formula to zoom.
Abstract
Physicochemical properties, nutrient concentrations, microbial properties and concentrations of heavy metals in water and sediments from the Owabi reservoir and its tributaries, namely Atafua, Sukobri and Owabi rivers as well as the outflow of the reservoir, were determined as indicators of the extent of pollution of the reservoir. The samples were collected in December 2015, which falls within the dry season in Ghana. Nutrient concentrations in water and sediments were within permissible limits. The heavy metals (Cu, Mn, Cd, Pb and Fe) in sediments were determined using X-ray fluorescence and that in water using flame atomic absorption spectrometer. Water from the reservoir and its feeder tributaries was heavily polluted with faecal coliforms, Escherichia coli and faecal enterococci. Physicochemical properties were within the World Health Organisation’s (WHO) permissible concentrations for drinking water except for turbidity, which was significantly higher (P < 0.05). The pH of the water samples ranged from 7.68 to 7.84 in the tributaries whilst that of the dam water ranged from 8.87 to 9.01. The turbidity of the Owabi dam and its tributaries ranged from 5.98 to 42.25 NTU. The turbidity of all the water samples was significantly higher (P < 0.05) than the WHO’s threshold for potable water (5 NTU). Manganese was detected in all the water samples and ranged from 0.19 to 0.61 mg L−1. Lead concentrations in the water samples ranged from below detection limit to 0.3 mg L−1. Cd was present in only one water sample from the Sukobri River. Cu and Fe were below detection limit in all the water samples. Geo-accumulation index of Cu, Mn and Pb was less than 1 with their enrichment factors also being less than 0.5. The geo-accumulation index and enrichment factor for Cd in Sukobri River sediment were 6.41 and 11.41, respectively. Sediments from the Owabi reservoir recorded no Cd geo-accumulation indices and enrichment factors, indicating no Cd contamination in it. The reservoir was chemically unpolluted but had high levels of pathogens which pose a health risk.
PUBLIC INTEREST STATEMENT
The Owabi reservoir since its establishment in 1926 has been one of the two major sources of drinking water for the people of Kumasi in the Ashanti region of Ghana. Currently, it supplies about 20% of the water needs of the indigenes in Kumasi. Because of heavy industrial activities along the tributaries of the reservoir, there is a likelihood that the quality of the reservoir would be compromised. This study sought to assess the impact of the anthropological activities along the tributaries of the Owabi reservoir on the quality of the reservoir. The results from this study will inform stakeholders such as policymakers, water treatment companies and the indigenes on the measures to take to remedy the situation and also provide baseline information for further research.
Competing interests
The authors declare no competing interests.
1. Introduction
The state of freshwater bodies with respect to their heavy metal and nutrient pollution is of primary global concern (Brönmark & Hansson, Citation2002; Kondratyev, Citation2002). Heavy metal residues in water may accumulate in microorganisms and other aquatic living organisms, and eventually enter the food chain, which will pose health hazards (Varol, Citation2011). Heavy metals in water affect the rate of uptake or release by sediments through changes that negatively affect living organisms because of the water–sediment chain (Du Laing, Rinkelbe, Vandecasteele, Meers, & Tack, Citation2009). Heavy metals are released into rivers by natural or anthropogenic means during their transport and distributed between the water and bed sediments (Varol, Citation2011). Adsorption, hydrolysis and co-precipitation are factors that affect the release of metal ions in water. High adsorption of metals on the sediment bed would cause only a small portion of free metal ions to stay dissolved in water (Gaur, Gupta, Pandey, Gopal, & Misra, Citation2005). Untreated and unregulated effluent discharges into freshwater bodies are a source of heavy metal pollution in water (Olden & Naiman, Citation2010).
Nitrogen and phosphorus contribute to the determination of the ecological status of aquatic systems (Jarvie et al., Citation1998 ). Excess of these nutrients may cause varied problems such as the explosion of algal blooms, deoxygenation, changes in taste and odour, the death of fish and other aquatic living organisms as well as loss of biodiversity (Varol & Şen, Citation2012). Nutrient enrichment reduces the quality of water, making it unwholesome for drinking, industry, agriculture, recreation and other purposes (Carpenter et al., Citation1998). Nitrogen and phosphorus enrichment cause eutrophication in rivers, lakes and reservoirs (Carpenter et al., Citation1998; Varol & Şen, Citation2012). Agricultural and urban activities are considered to be major sources of N and P to the aquatic ecosystems (Conley et al., Citation2009; Duan, Lou, Wang, & Xue, Citation2007).
The Owabi reservoir is the second major source of drinking water for the Kumasi Metropolis and its surrounding communities. About 20% of the water supplied to the metropolis is derived from the reservoir, serving mainly the northern part of Kumasi (Akoto et al., Citation2008). The reservoir’s tributaries flow through some urban areas, as well as some farming communities (McGregor, Thompson, & Simon, Citation2000). Its major tributaries are Owabi, Sukobri, Atafua, Akyeampomene, Pumpunase and Afu (Akoto & Abankwa, Citation2014; Akoto, Bruce, & Darko, Citation2010). These rivers carry waste from human activities such as car repair works, washing bays and refuse dumps (Akoto et al., Citation2008; Badu, Wemegah, Boadi, & Brown, Citation2013).
The Owabi River, the main tributary of the reservoir, is infested with bloodworms (Badu et al., Citation2013; Maoulidi, Citation2010). This reduces the water quality of the reservoir as it flows into it (Maoulidi, Citation2010). Agrochemicals and fertilizers used by farmers within the catchment of the reservoir are sources of pollution to the reservoir (Ntow, Citation2001). Studies of heavy metals and nutrient concentrations in the reservoir have been reported (Akoto et al., Citation2008, Citation2010, Citation2017; Akoto & Abankwa, Citation2014; Badu et al., Citation2013). Algae bloom is observed in the dry season and high turbidity in the rainy season (Badu et al., Citation2013), which tends to increase the cost of water treatment.
The state of the reservoir at present poses a threat to water resource management. The tributaries may filter naturally as they flow into the reservoir; however, this may not be enough to reduce the extent of pollution significantly (Dammo & Sangodoyin, Citation2014). The study sought to assess the quality of the Owabi reservoir and its tributaries.
2. Methodology
2.1. Study area
Owabi Reservoir is located in the Ashanti Region of Ghana, in the Kumasi Metropolis. It was established in 1926 with a depth of 7.4 m along its spillway and 11.5 m across the embankment (Akoto & Abankwa, Citation2014). The reservoir covers an area of about 69 km2 with an approximate volume of 26,000,000 m3 and is surrounded by a forest reserve (Akoto & Abankwa, Citation2014). There are several rivers and streams that feed the Owabi reservoir. These include the Rivers Owabi, Sukobri, Akyeampomene, Pumpunase and Atafua (Figure ). The Owabi River flows through agricultural lands such as Maase and joins other tributaries from Atafua (Akoto et al., Citation2010). River Akyeampomene flows through Breman and Suame, which are densely populated urban towns and carries waste from human activities along the way. These include liquid waste that drains directly from homes within the Breman township (Akoto & Abankwa, Citation2014). River Pumpunase also flows through Bohyen from Ampabame to the Owabi reservoir and feeds from several small streams as it moves (Akoto et al., Citation2008, Citation2010, Citation2017; Akoto & Abankwa, Citation2014; Badu et al., Citation2013).
Figure 1. Map of the study area showing the Owabi reservoir and its tributaries.
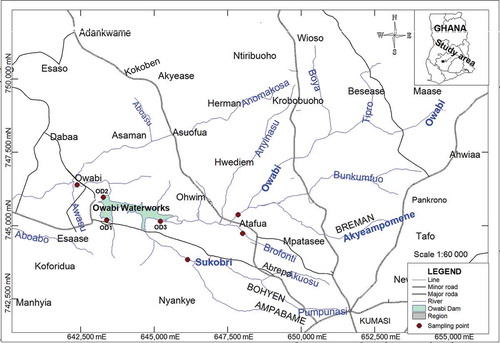
The map of the Owabi reservoir with its tributaries is shown in Figure .
2.2. Sampling
Water and sediment samples were collected from rivers Atafua, Owabi and Sokobri. Sampling was done in December, which begins the dry season in Ghana. Water and sediments were also sampled from three sites of the Owabi dam (OD1, OD2 and OD3) and its outflow channel (Figure ). In all, 14 water and 14 surface sediment samples from 7 different sampling points were collected. Surface sediments were taken from the bed of the river with a pre-cleaned stainless steel scoop into sterilized transparent polyethene bags, tied and labelled. They were then put in an ice chest. The water samples were collected into clean white transparent plastic containers that have been sterilized with 10% (v/v) nitric acid, dilute potassium permanganate solution and rinsed with a lot of distilled water and properly labelled. The pH and temperature measurements were done on site with a portable waterproof PCSTestr 35 multi-parameter (Oakton Instruments, USA).
2.3. Determination of physicochemical properties
The water samples each were analysed for temperature, pH, turbidity, salinity, total dissolved solids (TDSs), alkalinity, electrical conductivity, hardness, Mg2+, Ca2+ and Cl−. The pH and total organic content of the surface sediments were also determined. The temperature, pH, salinity, TDSs and electrical conductivity of water were determined by potentiometry using a pH/conductivity meter. The turbidity was determined with a turbidimeter. The alkalinity, hardness, Mg2+, Ca2+ and Cl− ion concentrations were determined by titrimetric methods. Total organic content in the sediment samples was determined by wet digestion of the samples with potassium dichromate and concentrated sulphuric acid. The digest obtained was filtered and the filtrate titrated with iron(II) sulphate, using ferroin as an indicator.
2.4. Determination of nutrient load
Water samples were analysed for, NO3− NO2−, PO42−, SO42−, NH3, K+ and Na+ while the sediments were analysed for N, P, Na and K. The NO3−, NO2−, PO42−, SO42−, NH3 were determined using a photometer (Primelab 1.0 multitest photometer, Wagtech, UK). A 10-mL aliquot of the water was placed into a cuvette and an appropriate tablet for the anion to be determined or ammonia added to develop a colour. The cuvette containing the sample was placed in the photometer and the concentration (mg L−1) of the anion or ammonia on a display was recorded. For the determination of sodium and potassium, 1, 5, 10, 15 and 20 ppm standard were prepared from 1,000 ppm spectrosol standards (Merch, Germany). The emission values of the standards were determined using a Jenway PFP7 flame photometer (Wagtech, UK) and a calibration curve of emission against concentration was established. The water and sediment samples to be analysed were then digested with concentrated hydrochloric acid and analysed with the flame photometer to determine the concentrations of sodium and potassium in each sample.
The sediment nitrogen content was determined using the micro-Kjeldahl technique (AOAC, Citation1990). A 1-g portion of sediment was transferred to a Kjeldahl digestion flask. An amount of 3.1 g of catalyst mixture made of potassium sulphate and copper sulphate was added and followed by the addition of 10 mL concentrated H2SO4. The flask with its content was heated at 150°C on a digestion hotplate in a fume hood until a clear green solution was obtained (Nwalo, Citation2010). The solution was further heated for 45 min, after which it was allowed to cool. The cooled digest was topped up with 10 mL distilled water and shaken. The digest was transferred into 100 mL volumetric flask and diluted with distilled water to the 100-mL mark. The Markham distillation apparatus was purged with steam. A receiver flask containing 10 mL of 2% boric acid indicator was placed under the condenser of the distillation apparatus. Ten millilitre aliquot of the diluted digest was drawn from the volumetric flask and poured into the distillation unit and 10 mL 40% NaOH solution was added slowly (Nwalo, Citation2010). Distillation was stopped and the distillate was titrated with 0.01 M HCl until the first pink colouration observed (Nwalo, Citation2010). The end point obtained was then used to calculate the nitrogen content of the water.
Phosphorus in sediments was determined using the spectrophotometric method. To 5 g of the sample was added 35 mL Bray’s extracting solution in a beaker. The mixture was swirled and transferred into centrifuge tubes. The centrifuge tubes were then stoppered and shaken for 1 min. They were transferred to the centrifuge and span at 6,000 rpm for 5 min. To 2.50 mL aliquot of the supernatant was added 10 mL of ammonium molybdate/ascorbic acid reagent in a colourimetric tube and allowed to react for 30 min for colour development. One millilitre aliquot was then drawn from the colourimetric tube into a cuvette and its absorbance was taken at 882 nm. The concentration of phosphorus was determined by means of a standard calibration curve (Bray & Kurtz, Citation1945; Department of Sustainable Natural Resources, Citation1995).
2.5. Determination of heavy metals
Water samples were digested with concentrated nitric acid (Akoto et al., Citation2008). A 5-mL aliquot of concentrated nitric acid was added to 50 mL of water in a 100-mL digestion flask. It was then heated on a digestion hot plate at 150°C and allowed to boil until its volume reduced to about 20 mL. A further 5 mL of concentrated nitric acid was added and heating continued for about 10 min, after which the digest was allowed to cool to room temperature. The digest was topped up with 10 mL distilled water filtered through a sintered glass funnel into a 50-mL volumetric flask and the filtrate topped up with distilled water to the 50-mL mark (Akoto et al., Citation2008). A blank solution was prepared by digesting distilled water in a manner similar to the sample. Heavy metals in the water samples were determined using the flame atomic absorption spectrometer (Analytik Jena novAA 400 P, Germany). Standard metal solutions of five varying concentrations (1, 2, 3, 4 and 5 ppm) for each metal were analysed and the data obtained used to plot calibration curves that were used to determine heavy metal concentrations in the water samples. The mean values of three replicates were taken for each determination. The blank solution was analysed before the samples. The heavy metals determined in the water samples were Fe, Cu, Pb, Mn and Cd.
Heavy metals in the sediments were determined using the Niton XL3 X-ray fluorescence spectrometer (Thermo Scientific, UK). The samples were air-dried and sieved into a fine powder using a 5-µm pore sieve. Two gram of each of the sieved samples was put into the instruments sample container and analysed without any further preparation.
2.6. Data analysis
Triplicate determinations were done and the results reported as their mean ± standard deviation. Analysis of variance was employed to ascertain how significant data sets were from each other and Pearson’s correlation used to study parameter interactions.
2.7. Geo-accumulation index and enrichment factor
The index of geo-accumulation (I-geo) of heavy metal is a calculation of the base 2 logarithm of the measured total concentration of the metal against its background concentration using Equation 1 (Howari & Banat, Citation2001; Muller, Citation1969; Ntekim, Ekwere, & Ukpong, Citation1993; Ntekim & Okon, Citation1993; Shafie et al., Citation2013):
where Cn is the measured total concentration of the element n in <63 µm fraction of sediment; Bn is the average (crystal) concentration of element n in the shale (background) and 1.5 is the factor compensating the background data (correction factor) due to lithogenic effects. The I-geo can be classified into seven grades (Ghrefat, Abu-Rukah, & Rosen, Citation2011; Howari & Banat, Citation2001).
Enrichment factor is the ratio of metal and Fe concentration in a sample to that in the background (Equation 2).
The world average shale was used as the concentrations of background metal. Data on the regional geochemical background values for these metals are not available. Background concentrations of Pb, Cd, Cu, Mn and Fe in the average shale (Ghrefat et al., Citation2011) were therefore used in this study. EF between 0.5 and 1.5 indicates that the metal is entirely from crustal materials or natural processes, whilst EF greater than 1.5 suggests that their sources are from human activities (Ghrefat et al., Citation2011). The EF values are interpreted as the concentrations of metal pollution suggested by Chen, Kao, Chen and Dong (Citation2007). Chen et al. (Citation2007) suggested that EF <1 shows no enrichment, EF = 1–3 shows minor enrichment, EF = 3–5 shows moderate enrichment, EF = 5–10 shows moderately severe enrichment, EF = 10–25 shows severe enrichment, EF = 25–50 shows very severe enrichment and EF >50 shows extremely severe enrichment. EF is calculated in the current study following the method of Chen et al. (Citation2007).
3. Results and discussions
3.1. Physicochemical properties of water
Physicochemical properties of water are shown in Table . The temperature of all the water samples ranged from 27 to 30°C with Owabi outflow having the highest temperature of 29.9°C. These temperatures are conducive for bacterial growth in the water bodies (Baranyi & Roberts, Citation1994; Kirchman, Citation2016; Ratkowsky, Lowry, McMeekin, Stokes, & Chandler, Citation1983; Ratkowsky, Olley, & McMeekin, Citation1982; Ross, Citation1996). The pH of the water samples ranged from 7.68 to 7.84 in the tributaries whilst that of the dam water ranged from 8.87 to 9.01. The pH of the dam water samples was generally higher than the WHO’s permissible concentrations (6.5–8.5) for drinking water (WHO, Citation2011). The pH of the dam may affect the growth of aquatic living organisms (Hansen, Citation2002). The outflow from the dam, however, had a pH of 7.88. There was no significant variation in pH for the different sites (P > 0.05). The pH is inversely proportional to the solubility of metal salts and compounds in that, as pH increases, solubility decreases (Miao, DeLaune, & Jugsujinda, Citation2006). This can be observed from Table that pH and concentration of heavy metals in water correlated negatively. Heavy metal concentrations in the water were low due to their insolubility at high pH, hence precipitating easily and accumulating in the sediments (Varol, Citation2011). The conductivity of the Owabi Reservoir ranged from 290.0 to 320.3 µS cm−1 and that of its tributaries from 176.3 to 416.5 µS cm−1. The outflow from the dam had a conductivity of 139.0 µS cm−1. These conductivity values were all within the WHO (Citation2011) permissible concentration for drinking water of 1,000 mg L−1. They are similar to those reported in the literature for the Owabi reservoir and its tributaries (Akoto & Abankwa, Citation2014; Badu et al., Citation2013). TDSs for the Owabi dam and its tributaries ranged from 97.7 to 294.2 mg L−1. The lowest TDS concentration was recorded in the dam’s outflow whereas the highest TDS value was recorded in Owabi River at Ohwim. Turbidity for Owabi dam and its tributaries ranged from 5.98 to 42.25 NTU. The turbidity of the dam was relatively lower than its tributaries. This suggests that as the river flows towards the reservoir, it becomes clearer due to low human activities in the forest reserve. The turbidity of the reservoir water can be attributed to suspended organic and inorganic matter, as well as microbial substances from the tributaries (Akoto et al., Citation2008; Akoto & Abankwa, Citation2014; Sawyer, McCarty, & Parkin, Citation2003). The turbidity of all the water samples was significantly higher (P < 0.05) than the WHO’s threshold for potable water (5 NTU).
Table 1. Physicochemical properties of water samples from the Owabi reservoir and its tributaries (n = 14)
Table 2. Concentrations of ammonia and anions in water samples
The hardness of water is characteristic of the presence of magnesium and calcium carbonates in the water (Akoto & Abankwa, Citation2014). Hard water does not have adverse health effects on human beings. However, it is not recommended for industrial and domestic use because it does not lather easily with soap. Sawyer et al. (Citation2003) classified water as soft, moderately hard and hard when their total hardness is <75, 75–150 and 151–300 mg L−1, respectively. The total hardness of the Owabi Reservoir and its tributaries ranged from 101.58 to 176.58 mg L−1. Based on Sawyer’s classifications, it can be said that water from the Owabi reservoir and its tributaries is moderate to hard. Alkalinity is a measure of the capacity of water to neutralize acids (Hemond, Citation1990). It is a function of the presence of the salts of weak acids such as carbonates and bicarbonates in the water (Akoto & Abankwa, Citation2014). Alkalinity is also affected by the presence of ammonia and hydroxides in the water. The alkalinity of water in the Owabi Reservoir and its tributaries ranged from 68.68 to 147.80 mg L−1. This range corroborates the hardness of the water.
Salinity for the reservoir and its tributaries ranged from 69.55 to 153.10 mg L−1. Salinity affects the chemical conditions of water bodies, particularly, concentrations of dissolved oxygen and dissolved inorganic phosphorus (Levinton, Citation2001). The solubility of water and amount of oxygen that can dissolve in it decrease with increase in salinity. Phosphorus in water is released as salinity increases and therefore increases phytoplankton production in water. Many bottom-dwelling aquatic organisms such as oysters and crabs can tolerate changes in salinity to some extent. However, high salinity concentrations will limit their growth, reproduction and survival (Brylawski & Miller, Citation2003).
3.2. Aquatic nutrients
Phosphates and nitrates can accelerate algal growth, which reduces the water quality and changes the odour and colour of water (Anderson, Glibert, & Burkholder, Citation2002). Nitrate, nitrite and ammonia concentrations in natural waters need to be checked because of the health implications they have on humans (Kempster, Van Vliet, & Kuhn, Citation1997) and aquatic life (Squires & Lesack, Citation2003). The concentrations of nitrate, nitrite and ammonia in the Owabi reservoir (Table ) were below the WHO limit of 50, 3.0 and 35 mg L−1, respectively (WHO, Citation2011). The concentration of nitrate in the water samples ranged from 3.7 to 8.4 mg L−1. Nitrate is a noncumulative toxic substance (Huang et al., Citation2007). Nitrates in high concentrations cause methemoglobinemia or “blue-baby-syndrome”, in pregnant women and infants (Badu et al., Citation2013; Nkansah, Boadi, & Badu, Citation2010). High concentrations of Nitrates may also cause cyanosis in infants (Badu et al., Citation2013; Nkansah et al., Citation2010).
Phosphate concentrations in the samples ranged from 0.40 to 0.72 mg L−1. The highest concentration was recorded in Atafua and the lowest in Owabi OD3. Eutrophication in water is caused by high phosphorus concentrations and cause weeds to grow in the reservoir (Akoto et al., Citation2008; Akoto & Abankwa, Citation2014; Carpenter et al., Citation1998; Varol & Şen, Citation2012). Phosphate concentration in the Reservoir may result from the use of phosphate-based fertilizers by farmers along the banks of its tributaries.
Nitrogen and phosphorus pollute water when in high concentrations. This leads to explosive algae blooms that cloud the water and deplete oxygen, which is critical for the growth and life in the aquatic ecosystem (Badu et al., Citation2013; Diaz & Rosenberg, Citation1995).
The concentration of chloride in the water samples ranged from 61.06 to 103.66 mg L−1. The ions in the water samples decreased in the order Cl− > >
>
>
. Chloride position in the anionic pattern of the Owabi reservoir may be as a result of the discharge of untreated wastewater into the tributaries that feed the reservoir by human settlers within the catchment (Karikari & Ansa-Asare, Citation2006).
The ammonia concentrations in the samples ranged from 0.06 to 6.63 mg L−1. The ammonia concentrations were within the WHO permissible (WHO, Citation2011). The odour concentration of ammonia at alkaline pH has a threshold of approximately 1.5 mg L−1 and a taste threshold of 35 mg L−1 (WHO, Citation2011). The highest ammonia concentration of 6.63 mg L−1 was recorded for Ohwim and the lowest was recorded for Sukobri, OD1 and the Outflow samples at 0.06 mg L−1 (Table ). Ammonia at these concentrations does not have any known health-related problems and no health-based guideline value has been proposed. However, ammonia reacts with chlorine to reduce free chlorine and to form chloramines (WHO, Citation2011). Ammonia is obtained as a breakdown product of nitrogen-containing materials in natural waters (Conley et al., Citation2009). Ammonia may cause harm to fish and other aquatic living organisms. Concentrations of ammonia must be controlled in aquatic ecosystems to reduce or eradicate hazardous effects (Conley et al., Citation2009).
The sulphate () in the samples ranged from below detectable limits (<LOD) to 2.00 mg L−1 (Table ). The values recorded for all the anions were below the WHO permissible limits.
3.3. Microbial tests
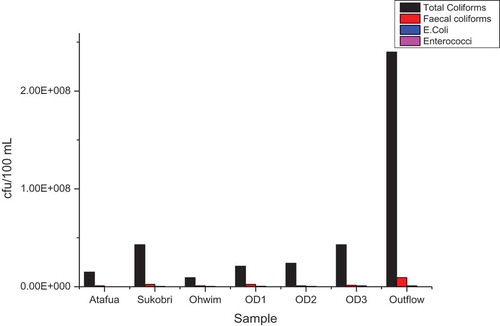
Potable drinking water must be free from faecal coliform and E. coli (WHO, Citation2011). Faecal coliforms and E. coli in rivers may be as a result of untreated organic waste discharge into the rivers. The faecal coliforms in the samples ranged from 9.3 × 10⁵ to 9.3 × 10⁶ cfu/100 mL (Figure ). The high faecal coliform and E. coli counts show that the reservoir and its tributaries are polluted by pathogenic organisms and will increase the cost of treatment for human consumption.
Figure 2. Concentrations of microbes in the water samples.
3.4. Concentrations of heavy metals in Owabi reservoir and its tributaries
The concentrations of heavy metals have been summarized in Table . Copper and cadmium were below detection limit in all the water samples. Manganese was detected in all the water samples and ranged from 0.19 to 0.61 mg L−1. The manganese content in the tributaries of the reservoir was generally higher than that in the dam. The difference in Mn concentration was, however, not significant (P > 0.05). The concentration of Mn in the outflow from the reservoir was higher than that in the dam. This may come from human activities such as farming. Lead concentrations ranged from below detection limit to 0.3 mg L−1. The highest lead concentration was found in Atafua. The lead was below detection limit in the reservoir water. There were no strong correlations between the metal concentrations and the physicochemical properties of all the water samples analysed.
Table 3. Concentrations of heavy metals in water
3.5. Physicochemical properties of sediments
The pH of the sediment samples ranged from 5.56 to 7.27 (Table ). The pH values were slightly acidic to neutral and were lower than those obtained in the water. This may be attributed to the nature of the sediments and minerals present in the sediments. The pH, however, decreased as nitrogen and phosphorus content increased, showing a negative correlation between pH and phosphorus and nitrogen at R2 = −0.572 and R2 = −0.942, respectively.
Table 4. Physicochemical properties of sediments
The total organic content of the sediments ranged from 0.30% to 2.59%. The total organic content had a strong positive correlation (R2 = 0.996) with nitrogen. It also correlated positively with phosphorus (R2 = 0.578). The total organic content in the sediments is as a result of dead organisms and plants that have decayed on the sediment bed. Sodium concentrations in the sediments ranged from 89.50 to 195.36 mg kg−1 and potassium from 14.16 to 51.88 mg kg−1. Sodium and potassium concentrations in the reservoir sediments and tributaries are as a result of dissolved salts and minerals in the water as well as decayed organic matter (Pal, Chakraborty, Datta, & Mukhopadhyay, Citation2018).
3.6. Concentrations of heavy metals in sediments
The concentrations of Cu, Mn, Cd and Pb in sediment samples collected from the Owabi reservoir and its tributaries have been reported in Table .
Table 5. Concentrations of heavy metals in sediments
Cadmium was below detection in all the sediment samples except Sukobri which recorded 6.77 ± 4.14 mg kg−1. Copper concentrations ranged from below detection to 25.02 mg kg−1. Concentrations of copper in Atafua, Ohwim and Sukobri sediments were below detection limit. Copper was however recorded in the Owabi dam and the outflow from the dam in significant concentrations. The presence of copper in the dam sediments is as a result of its natural occurrence in the sedimentary bedrock. Manganese concentrations ranged from 62.75 to 380.83 mg kg−1. The minimum concentration was recorded in Atafua whilst the maximum was recorded in Owabi OD2. Generally, the Mn concentrations in the Owabi dam were higher than its tributaries and outflow. This observation is, however, different from that observed for the water samples. Pb concentrations in the sediment samples studied ranged from 3.91 to 21.23 mg kg−1. The minimum concentration was found in Sukobri and the maximum in the Owabi outflow. Lead concentration in the dam may result from the feed of contaminated water from its tributaries and deposition of atmospheric lead particles in the river. The lead concentrations in the sediments may result from accumulation over a long period of time. There were generally poor correlations between the heavy metals concentrations in the sediments and their physicochemical properties. However, there were strong correlations between Cd and Na (R2 = 0.969), Cu and Mn (R2 = 0.832) and Cu and Pb (R2 = 0.799) which may suggest a common pollution source or a similar geochemical behaviour for these metals.
The ratio of total iron to total phosphorus (Fe:P) in the surface sediment is an indicator of the adsorption capability of oxidized sediments. It provides a measure of free sorption sites for orthophosphates in sediments that are oxidized (Jensen, Kristensen, Jeppesen, & Skytthe, Citation1992). High Fe:P ratio (>20) indicates lower phosphorus release from sediment into water while low Fe:P ratio (<20) indicates high phosphorus release from sediments. The Fe:P ratio reflects the capacity of the sediment to adsorb orthophosphates on oxidized sediments. It is a factor that relates to the magnitude of gross internal phosphorus loading in lakes and reservoirs. The Fe:P ratio obtained for all the sediment samples was above 20, which indicates very low release of phosphorus in the water as a result of high adsorption of phosphorus on the sediment surface (Jensen et al., Citation1992).
3.7. Geo-accumulation index and enrichment factor
The geo-accumulation indices (I-geo) of Pb, Mn, Cu, Cd and Fe in the sediment samples are shown in Table .
Table 6. Geo-accumulation indices and enrichment factors heavy metals in sediment samples
The I-geo values for all the heavy metals except Cd were below 1, which indicates that the sediments are not contaminated with the metals. Although Cd was not found to contaminate most samples, sediment samples form Sukobri showed extreme Cd contamination, I-geo > 6. The extent of cadmium contamination in the sediment indicates that the sources of pollution are anthropogenic.
The EF for Pb, Cu and Mn for all the sediment samples was generally below 0.5 and suggests that they are mainly from natural sources. EFs for Cd concentrations were below 0.5 in all the sediment samples except Sukobri which was 11.41. The EF for Cd in Sukobri was the highest among the metals and it has a severe enrichment. The EF also indicates that Pb, Cu and Mn had no enrichment. The differences in enrichment factor for the metals in the sediments may be due to the level of input for each metal in the sediment and the differences in the rate of removal of each metal from the sediment. Metals in the sediment can be released into the water when conditions such as pH, redox potential, ionic strength and the concentration of organic complexing agents change (Ghrefat et al., Citation2011).
4. Conclusion
The extent of water and sediment pollution in the Owabi reservoir and its tributaries, together with the outflow from the reservoir, has been assessed. The parameters measured include physicochemical properties, heavy metals, nitrogen and phosphorus concentrations in both water and sediment samples, as well as microbial loading in water samples. The concentrations of coliforms and enterococci in the water samples were higher than the WHO guidelines for drinking water. This indicates that the water bodies are contaminated with disease-causing microbes. All the physicochemical properties tested in the water samples were within the WHO’s guidelines for potable water except turbidity, which was significantly higher (P < 0.05) than the WHO threshold of 5 NTU. The Fe:P ratio of sediments from the Owabi reservoir and its tributaries was all above 20, which indicates a low release of phosphorus into the water due to high adsorption on the sediment surface. The extent of heavy metal pollution of the sediments was assessed using enrichment factor and geo-accumulation index geochemical approaches. The EF results demonstrate that except sediments from Sukobri which had a high cadmium enrichment, sediments from the study area were not enriched with the metals determined. Although the Owabi reservoir is not contaminated with heavy metals, it is heavily polluted with disease-causing microbes. It is therefore not suitable in its current form for drinking purposes.
Competing interests
The authors declare no competing interests
Acknowledgements
The authors would like to acknowledge the support of the Kwame Nkrumah University through the Building Stronger University’s pilot project initiative under BSU II-WP1 Climate Smart Agriculture package.
Additional information
Funding
Notes on contributors
Nathaniel Owusu Boadi
Nathaniel Owusu Boadi is a senior lecturer at the Department of Chemistry, KNUST. His research areas cut across environmental monitoring, food toxicology, synthetic inorganic chemistry and nanotechnology.
Lawrence Sheringham Borquaye
Lawrence Sheringham Borquaye is a chemical biologist and natural product chemist. He is a lecturer at the Department of Chemistry, KNUST.
Godfred Darko
Godfred Darko is a senior lecturer at the Department of Chemistry, KNUST. His research is focused on heavy metals and xenobiotics in the environment.
David Dotse Wemegah
David Dotse Wemegah is a geophysicist and hydrogeologist. He is a senior lecturer at the Department of Physics, KNUST.
Dodzi Agorsor
Dodzi Agorsor and Randy Akrofi are research assistants at the Department of Chemistry, KNUST.
References
- Akoto, O., & Abankwa, E. (2014). Evaluation of Owabi reservoir (Ghana) water quality using factor analysis. Lakes and Reservoirs: Research and Management, 19(3), 174–182. doi:10.1111/lre.12066
- Akoto, O., Bruce, T. N., & Darko, G. (2008). Heavy metals pollution profiles in streams serving the Owabi reservoir. African Journal of Environmental Science and Technology, 2(11), 354–359.
- Akoto, O., Bruce, T. N., & Darko, G. (2010). Chemical and biological characteristics of streams in the Owabi watershed. Environmental Monitoring and Assessment, 161(1–4), 413–422. doi:10.1007/s10661-009-0757-4
- Akoto, O, Gyamfi, O, Darko, G, & Barnes, V. R. (2017). Changes in water quality in the Owabi water treatment plant in Ghana. Applied water science, 7(1), 175–186.
- Anderson, D., Glibert, P., & Burkholder, J. (2002). Harmful algal blooms and eutrophication: Nutrient sources, compositions, and consequences. Estuaries, 25(4), 704–726. doi:10.1007/BF02804901
- AOAC. (1990). Official methods of analysis (15th Edn, Vol. 1). Arlington, Virginia: Association of Official Analytical Chemists Inc.
- Badu, M., Wemegah, D. D., Boadi, N. O., & Brown, F. A. (2013). Assessment of the nutrient load and selected heavy metals in the Owabi reservoir and its feeder waters. American Journal of Scientific and Industrial Research, 4(4), 337–343.
- Baranyi, J., & Roberts, T. A. (1994). A dynamic approach to predicting bacterial growth in food. International Journal of Food Microbiology, 23(3–4), 277–294. Elsevier. doi:10.1016/0168-1605(94)90157-0
- Bray, R. H., & Kurtz, L. T. (1945). Determination of total, organic, and available forms of phosphorus in soils. Soil Science, 59(1), 39–46. doi:10.1097/00010694-194501000-00006
- Brönmark, C., & Hansson, L.-A. (2002). Environmental issues in lakes and ponds: Current state and perspectives. Environmental Conservation, 29(3), 290–307. doi:10.1017/S0376892902000218
- Brylawski, B. J., & Miller, T. J. (2003). Bioenergetic modelling of the blue crab (Callinectes sapidus) using the fish bioenergetics (3. 0) computer program. Bulletin of Marine Science, 72(2), 491–504.
- Carpenter, S., Caraco, N., Correll, D., Howarth, R., Sharpley, A., & Smith, V. (1998). Nonpoint pollution of surface waters with phosphorus and nitrogen. Ecological Applications, 8(3), 559–568. doi:10.1890/1051-0761(1998)008[0559:NPOSWW]2.0.CO;2
- Chen, C.-W., Kao, C.-M., Chen, C.-F., & Dong, C.-D. (2007). Distribution and accumulation of heavy metals in the sediments of Kaohsiung Harbor, Taiwan. Chemosphere, 66(8), 1431–1440. doi:10.1016/j.chemosphere.2006.09.030
- Conley, D. J., Paerl, H. W., Howarth, R. W., Boesch, D. F., Seitzinger, S. P., Havens, K. E., Lancelot, C., et al. (2009). Controlling eutrophication: Nitrogen and phosphorus. Science, 323(5917), 1014–1015. (New York, N.Y.). doi:10.1126/science.1167755
- Dammo, M. N., & Sangodoyin, A. Y. (2014). Socio-economic activities around Alau Dam and the quality of raw water supply to Maiduguri Treatment Plant, Nigeria. Water Practice and Technology, 9(3), 386–391. doi:10.2166/wpt.2014.042
- Department of Sustainable Natural Resources. (1995). Soil survey standard test method: Available phosphorus: Bray No 1 Extract, No. 1. pp. 1–4.
- Diaz, R. J., & Rosenberg, R. (1995). Marine benthic hypoxia: A review of its ecological effects and the behavioural responses of benthic macrofauna. Oceanography and Marine Biology. An Annual Review, 33, 203–245.
- Du Laing, G., Rinkelbe, J., Vandecasteele, B., Meers, E., & Tack, F. M. (2009). Trace metal behaviour in estuarine and riverine floodplain soils and sediments: A review. Science of the Total Environment, 407(13), 3972–3985. doi:10.1016/j.scitotenv.2008.07.025
- Duan, T., Lou, W., Wang, X., & Xue, Q. (2007). Size-controlled synthesis of orderly organized cube-shaped lead sulfide nanocrystals via a solvothermal single-source precursor method. Colloids and Surfaces A: Physicochemical and Engineering Aspects, 310(1–3), 86–93. doi:10.1016/j.colsurfa.2007.06.006
- Gaur, V. K., Gupta, S. K., Pandey, S. D., Gopal, K., & Misra, V. (2005). Distribution of heavy metals in sediment and water of river Gomti. Environmental Monitoring and Assessment, 102(1–3), 419–433. doi:10.1007/s10661-005-6395-6
- Ghrefat, H. A., Abu-Rukah, Y., & Rosen, M. A. (2011). Application of geoaccumulation index and enrichment factor for assessing metal contamination in the sediments of Kafrain Dam, Jordan. Environmental Monitoring and Assessment, 178(1–4), 95–109. doi:10.1007/s10661-010-1675-1
- Hansen, P. J. (2002). Effect of high pH on the growth and survival of marine phytoplankton: Implications for species succession. Aquatic Microbial Ecology, 28(3), 279–288. doi:10.3354/ame028279
- Hemond, H. F. H. F. F. (1990). Acid neutralizing capacity, alkalinity, and acid-base status of natural waters containing organic acids. Environmental Science & Technology, 24(10), 1486–1489. doi:10.1021/es00080a005
- Howari, F. M., & Banat, K. M. (2001). Assessment of Fe, Zn, Cd, Hg, and Pb in the Jordan and Yarmouk river sediments in relation to their physicochemical properties and sequential extraction characterization. Water, Air and Soil Pollution, 132, 43–59. doi:10.1023/A:1012062814873
- Huang, B., Zhao, Y., Shi, X., Yu, D., Zhao, Y., Sun, W., … Öborn, I. (2007). Source identification and spatial variability of nitrogen, phosphorus, and selected heavy metals in surface water and sediment in the riverine systems of a peri-urban interface. Journal of Environmental Science and Health. Part A, Toxic/Hazardous Substances & Environmental Engineering, 42(3), 371–380. England. doi:10.1080/10934520601144675
- Jarvie, H. P, Whitton, B. A, & Neal, C. (1998). Nitrogen and phosphorus in east coast british rivers: speciation, sources and biological significance. Science Of The Total Environment, 210, 79-109.
- Jensen, H. S., Kristensen, P., Jeppesen, E., & Skytthe, A. (1992). Iron: Phosphorus ratio in surface sediment as an indicator of phosphate release from aerobic sediments in shallow lakes. Hydrobiologia, 235-236(1), 731–743. doi:10.1007/BF00026261
- Karikari, A. Y., & Ansa-Asare, O. D. (2006). Physico-chemical and microbial water quality assessment of Densu River of Ghana. West African Journal of Applied Ecology, 10(1), 1–12.
- Kempster, P. L., Van Vliet, H. R., & Kuhn, A. (1997). The need for guidelines to bridge the gap between ideal drinking-water quality and that quality which is practically achievable and acceptable. Water South Africa, 23(2), 163–167.
- Kirchman, D. L. (2016). Growth rates of microbes in the Oceans. Annual Review of Marine Science, Annual Reviews, 8, 285–309. doi:10.1146/annurev-marine-122414-033938
- Kondratyev, S. (2002). Assessment of the present state of water resources of Lake Ladoga and its drainage basin using sustainable development indicators. Ecological Indicators, 2(1–2), 79–92. doi:10.1016/S1470-160X(02)00049-3
- Levinton, J. S. (2001). Marine biology. In Chapter 4–The chemical and physical environment. New York, NY: Oxford University Press.
- Maoulidi, M. (2010). A Water and Sanitation Needs Assessment for Kumasi, Ghana, pp. 1–32.
- McGregor, D., Thompson, D., & Simon, D. (2000). Water quality and management in peri-urban Kumasi, Ghana. In Land-Water Linkages in Rural Watersheds Electronic Workshop (Case study16, p.66. Rome: FAO Land and Water Development Division.
- Miao, S., DeLaune, R. D., & Jugsujinda, A. (2006). Influence of sediment redox conditions on release/solubility of metals and nutrients in a Louisiana Mississippi River deltaic plain freshwater lake. Science of the Total Environment, 371(1–3), 334–343. doi:10.1016/j.scitotenv.2006.07.027
- Muller, G. (1969). Index of geoaccumulation in sediments of the Rhine River. Geo Journal, 2(3), 108–118.
- Nkansah, M. A., Boadi, N. O., & Badu, M. (2010). Assessment of the quality of water from hand-dug wells in Ghana. Environmental Health Insights, 4, 7–12.
- Ntekim, E. E. U., Ekwere, S. J., & Ukpong, E. E. (1993). Heavy metal distribution in sediments form Calabar River, southeastern Nigeria. Environmental Geology, 21, 237–241. doi:10.1007/BF00775913
- Ntekim, E. E. U., & Okon, G. A. E. (1993). Trace metal distribution in the sediments of the Bight of Bonny, South Eastern Nigeria. Eighth Symposium on Coastal and Ocean Management, New Orleans, Louisiana, July 19-23.
- Ntow, W. J. W. J. (2001). Organochlorine pesticides in water, sediment, crops, and human fluids in a farming community in Ghana. Archives of Environmental Contamination and Toxicology, 40(4), 557–563. doi:10.1007/s002440010210
- Nwalo, F. (2010). Rate of water absorption and proximate analysis of different varieties of maize cultivated in Ikwo Local Government Area of Ebonyi State, Nigeria. African Journal of Biotechnology, 9(52), 8913–8917.
- Olden, J. D., & Naiman, R. J. (2010). Incorporating thermal regimes into environmental flows assessments: Modifying dam operations to restore freshwater ecosystem integrity. Freshwater Biology, 55(1), 86–107. doi:10.1111/fwb.2009.55.issue-1
- Pal, S., Chakraborty, S., Datta, S., & Mukhopadhyay, S. K. (2018). Spatio-temporal variations in total carbon content in contaminated surface waters at East Kolkata Wetland Ecosystem, a Ramsar Site. Ecological Engineering, 110(April 2017), 146–157. Elsevier. doi:10.1016/j.ecoleng.2017.11.009
- Ratkowsky, D., Olley, J., & McMeekin, T. (1982). Relationship between temperature and growth rate of bacterial cultures. Journal of Bacteriology, 149(1), 1–5.
- Ratkowsky, D. A., Lowry, R. K., McMeekin, T. A., Stokes, A. N., & Chandler, R. E. (1983). Model for bacterial culture growth rate throughout the entire biokinetic temperature model for bacterial culture growth rate throughout the entire biokinetic temperature range. Journal of Bacteriology, 154(3), 1222–1226.
- Ross, T. (1996). Indices for performance evaluation of predictive models in food microbiology. Journal of Applied Bacteriology, 81(5), 501–508. Wiley Online Library. doi:10.1111/jam.1996.81.issue-5
- Sawyer, C. N., McCarty, P. L., & Parkin, G. F. (2003). Chemistry for environmental engineering and science. New York, USA: McGraw-Hill.
- Shafie, N. A., Aris, A. Z., Zakaria, M. P., Haris, H., Lim, W. Y., & Isa, N. M. (2013). Application of geoaccumulation index and enrichment factors on the assessment of heavy metal pollution in the sediments. Journal of Environmental Science and Health. Part A, Toxic/Hazardous Substances & Environmental Engineering, 48(2), 182–190. doi:10.1080/10934529.2012.717810
- Squires, M. M., & Lesack, L. F. W. (2003). The relation between sediment nutrient content and macrophyte biomass and community structure along a water transparency gradient among lakes of the Mackenzie Delta. Canadian Journal of Fisheries and Aquatic Sciences, 60(September), 333–343. doi:10.1139/f03-027
- Varol, M. (2011). Assessment of heavy metal contamination in sediments of the Tigris River (Turkey) using pollution indices and multivariate statistical techniques. Journal of Hazardous Materials, 195(July), 355–364. doi:10.1016/j.jhazmat.2011.08.051
- Varol, M., & Şen, B. (2012). Assessment of nutrient and heavy metal contamination in surface water and sediments of the upper Tigris River, Turkey. Catena, 92(July), 1–10. doi:10.1016/j.catena.2011.11.011
- WHO. 2011. Guidelines for drinking-water quality. WHO Chronicle, 38. doi:10.1016/S1462-0758(00)00006-6