
 ?Mathematical formulae have been encoded as MathML and are displayed in this HTML version using MathJax in order to improve their display. Uncheck the box to turn MathJax off. This feature requires Javascript. Click on a formula to zoom.
Abstract
The objective of this study was to determine the functional and pasting properties of yellow maize (M)-soya bean (S)-pumpkin (P) composite flours and the sensory attributes of breakfast cereals prepared from the flour formulations. Two forms of soya bean seeds; un-soaked (USB) and soaked, dehulled and boiled soya bean (SSB) were used for this study. Four blends of composite flours in the proportions 65:35:0, 60:35:5, 55:35:10 and 50:35:15 (M: USB/SSB: P) were formulated. Results of the functional properties revealed that, water absorption capacity, swelling power and solubility, were in the range of 161.06–269.46%, 400.00–480.29% and 6.80–13.43% respectively and increased pumpkin pulp flour substitution resulted in an increase in the functional properties and viscosities. Sensory evaluation showed that significant differences (p < 0.05) existed in the taste, aftertaste and overall acceptability of the breakfast cereals with panellists preferring formulations developed from un-soaked soya bean flours. There was no significant difference (p > 0.05) between the control (USB) and the 10% pumpkin-substituted breakfast cereals in terms of the overall mean values. The addition of pumpkin pulp to maize–soya bean blend significantly improved the functional and pasting properties of the flour blends and sensorial properties of breakfast cereals were acceptable by panellists.
PUBLIC INTEREST STATEMENT
Pumpkin is rich in several bioactive compounds and essential minerals. In Ghana, it is grown mostly in the Northern part of the country, in backyard gardens and has very limited uses in food preparation. Breakfast cereals are well-patronized in Ghana but are mostly formulated from common staples, mainly grains and root tubers which are predominantly rich in macronutrients. In this study, we have demonstrated the feasibility of utilizing flour from pumpkin pulp as a composite with yellowmaize and soya beans for breakfast cereal preparation. This is essential in promoting food diversity and value addition of the breakfast cereals. The 10% pumpkin-substituted breakfast cereal was not significantly different from the control in terms of the sensory properties. This highlights the potential commercialization of pumpkin-incorporated breakfast cereals. Efforts should now be geared towards promoting large scale pumpkin cultivation for food product development and overall food security in Ghana.
1. Introduction
In recent times, there has been an increased patronage of ready-to-eat breakfast cereals. A survey report by Brazil Institute of Geography and Statistics [IBGE] (Citation2010) revealed that the consumption of industrialized foods such as breads have increased (from 5.7% to 6.4%) and ready-to-eat meals (from 3.3% to 4.6%). Changes in social structure is one of the factors that has stimulated this pattern as a result of the increase in the number of mothers spending less time in their homes and the lack of time for food preparation in modern times (Omwamba & Mahungu, Citation2014). Breakfast cereals are mostly processed from cereals by roasting, flaking, rolling or milling and found in a pre-cooked or ready-to-eat state (Sharma & Caralli, Citation2004). Many developing countries in Africa consume breakfast meals prepared from native staples such as cereals, legumes, roots and tubers such as potatoes (Okafor & Usman, Citation2014). In Ghana, common traditional breakfast cereals include ‘Tom Brown’ (rice–maize–groundnut mix or rice–soya bean–maize mix), rice porridge and corn porridge.
Yellow maize is a pro-vitamin A fortified maize that has the potential of addressing vitamin A deficiency which is an issue of great public health concern in Africa (Pillay, Derera, Siwela, & Veldman, Citation2011). Soya bean is a legume which has its proteins closely relating with animal protein and with a high-protein quantity, close to 40–45% of the total solids (Goyal, Sharma, & Gill, Citation2012). Pumpkin pulp is rich in minerals and vitamins, suggesting that it has an important health-protecting effect for human consumption, but its use is unexploited in food product development in Ghana. Lack of commercial recognition, underutilization and market potential limits the cultivation of pumpkin on a large scale (Adubofuor, Amoah, & Agyekum, Citation2016). Many researchers have reported on the nutritional potential of the supplementation of nutritious fruits into cereal-based breakfast meals to fortify them with some mineral elements, fibre, antioxidants and vitamins (Ezeokeke & Blessing Onuoha, Citation2016; Tiencheu et al., Citation2016). Development of an accepted pumpkin-flour incorporated breakfast meal would promote increased utilization and diversification of use of the pumpkin fruit and enhance the nutritional value of ready-to-eat cereal breakfast meal. The objective of this research was to determine the functional and pasting properties of yellow maize–soya bean–pumpkin composite flour and to evaluate the sensory characteristics of breakfast cereal from the flour formulations.
2. Material and methods
2.1. Source of raw materials
Yellow maize (abontsem) and Soya bean (namgbaar) varieties were obtained from Council for Scientific and Industrial Research (CSIR) (Fumesua, Kumasi, Ghana). Pumpkin fruits with round and cylindrical shape forms were obtained from the Upper West Region of Ghana. Yellow maize and Soya bean samples were sorted, cleaned and solar dried to a constant weight.
2.2. Preparation of flours
2.2.1. Production of pumpkin pulp flour
The pumpkins were washed thoroughly with tap water, cut in half to remove both fibres and the white seeds and afterwards peeled. A hand grater was used to grate the pulp after which the pulps from the cylindrical and round fruits were equally combined and dried in the sun for 10 h. The dried pulp was solar-dried to a constant weight to obtain a crispy texture and to facilitate milling into flour. The milling was done by using a hammer mill (Retsch Technology Haan, Germany) and sieved with 425 µm sieve size. Samples were packaged in polythene bags and kept in a cool and dry place prior to laboratory analyses.
2.2.2. Production of soya bean flours
A quantity of 1320 g of soya beans was divided into two equal parts with one part (660 g) soaked in 1 L of distilled water for 24 h, dehulled, boiled in 1 L distilled water for 30 min and solar dried for 72 h to a constant weight. The dried soya beans were roasted at 120 °C for 30 min and cooled. The second part of the soya beans (660 g) was roasted in a hot air oven (Binder Drying Heating Oven, Tuttlingen, Germany) at 180 °C for 25 min and allowed to cool. The two forms of the soya beans were separately milled with the hammer mill and sieved with a 425 µm sieve size to obtain the flour.
2.2.3. Production of maize flour
The maize grains were sorted to remove unwanted materials and were solar dried to a constant weight. The grains (960 g) were roasted in the hot air oven at 180 °C for 30 min and allowed to cool. The cooled sample was milled using the hammer mill and sieved with a 425 µm sieve size to obtain maize flour.
2.3. Product formulations and preparation of breakfast cereal
The formulation blends of the yellow maize, soya bean and pumpkin flours are shown in Table . The breakfast gruels from the various flour blends were prepared using 500 mL of water, 30 g of sugar to 100 g of the formulated flour and heated while stirring for 7 min under moderate heat. The cooked food samples were allowed to cool and then served in plastic disposable cups in equal amounts of 5 g for sensory evaluation.
Table 1. Formulations of maize–soya bean–pumpkin flour
2.4. Determination of functional properties of formulated flours
The properties determined were bulk density, water absorption capacity, swelling power, solubility and dispersibility. The procedures were carried out in duplicate.
2.4.1. Bulk densities
Bulk density was determined by using the procedure (Akpapuimam & Markakis, Citation1981). A total of 10 g of maize–soya bean–pumpkin flour blends were measured into a 50 mL cylinder. The volume of the sample was determined before and after gently tapping the base of the measuring cylinder on a laboratory bench for 20 times. This was duplicated for each sample for consistency. The loose and tapped bulk densities were calculated and expressed as g/mL.
2.4.2. Water absorption capacity (WAC)
Water absorption capacities of flour samples were determined according (Sosulski, Garratt, & Slimkard, Citation1976). One gram of each flour sample was weighed into 15 mL centrifuge tube and mixed with 10 mL of distilled water. The mixture was allowed to stand undisturbed in a test tube racket at room temperature for 30 min and then centrifuged (Hettich Zentrifugen, Tuttlingen, Germany) at 2200 rpm for 15 min. The supernatant was carefully decanted. The mass of the flour sediment in each centrifuge tube was determined. The analysis was duplicated and the water absorption capacity was calculated as follows;
2.4.3. Swelling power and solubility
The swelling power and solubility of the flours were determined according to Leach, McCowen, and Scoch (Citation1959). One gram of each flour sample was weighed into 15 mL centrifuge tubes and thoroughly mixed with 10 mL of distilled water and mixed by shaking manually. The mixture was heated in a water bath (Clifton Shaking Bath, England) at 85 °C for 30 min, then cooled to room temperature and centrifuged with the centrifuge at 2200 rpm for 15 min. The clear supernatant was carefully decanted into clean, dried pre-weighed petri-dishes. The contents of the petri-dishes were evaporated in the hot air oven at 100 °C for 30 min, then removed, cooled and weighed. The mass of soluble substances in the supernatants was calculated by difference. The mass of each flour paste in the centrifuge tubes was also recorded. The swelling power and the solubility of the flour samples were calculated as follows;
2.4.4. Dispersibility
The method described by Kulkarni, Kulkarni, and Ingle (Citation1991) was used. Dispersibility of flour was determined by placing 10 g of the sample in a 100 mL stoppered measuring cylinder. Distilled water was added to reach a volume of 50 mL mark and stirred vigorously, allowing it to settle for 3 h. The volume of settled particles was noted and percentage dispersibility was calculated as follows:
2.4.5. Pasting properties of flour samples
Rapid Visco-Analyzer (RVA) General Pasting Method (STD1) was used and the properties were all carried out in duplicate. The moisture content of the flour was predetermined. Approximately 3.00 g of flour was mixed with about 25 g of distilled water in a canister. The amount of water added to each sample was based on the moisture content of the sample. The paddle was placed into the canister containing the sample. The sample was then inserted in the RVA. The total running time was 13 min and the viscosity values were recorded as the temperature increased from 50 °C to 95 °C before cooling to 50 °C again. Rotation speed was set to 960 rpm for the first 10 s and to 160 rpm until the end. The pasting properties were determined using the Rapid Visco-Analyzer (RVA Model 4500, Perten Instrument, Australia) according to Eriksson (Citation2013).
2.4.6. Sensory evaluation
Sensory evaluation was carried out using 47 panellists. The semi-trained panellists evaluated the samples based on the 7-point hedonic scale where 1-dislike very much, 2-dislike moderately, 3-dislike slightly, 4-Neither like nor dislike, 5-like slightly, 6-like moderately, 7-like very much. To avoid the possibility of sensory fatigue among the panellists in evaluating the 8 samples, the sensory evaluation was conducted on composite flours possessing high water absorption capacity, swelling power, solubility and the controls. These were 6 samples namely A, C, D, E, G and H. Samples B and F were therefore not part of the sensory evaluation. Panellists were provided with water to rinse the palate between tasting sessions. Sensory parameters evaluated were appearance, aroma, colour, taste, aftertaste, thickness and overall acceptability.
2.4.7. Data analysis
One-Way Analysis of Variance (ANOVA) was used to establish significant differences among means at 95% confidence interval using the Tukey’s test. All the analyses were done with Statistical Package for Social Scientist (SPSS) version 20.0 software.
3. Results and discussion
3.1. Functional properties of composite flours
The functional properties of the composite flours are shown in Table . Significant differences (p < 0.05) existed in all the functional properties except loose bulk densities, tapped bulk densities and the porosity.
Table 2. Functional properties of maize–soya–pumpkin flour formulations
3.1.1. Water absorption capacity
From Table , water absorption capacities of the composite flours formulated from un-soaked soya beans (USB) increased from 161.06% to 269.46% and that for soaked soya beans (SSB), from 169.61% to 261.02%. The highest water absorption capacity was found in formulation D which was not significantly different (p > 0.05) from formulation H, but differed significantly (p < 0.05) from formulations, A, B, C, E, F and G. The lowest water absorption capacities were the controls (A and E) which showed no significant difference (p > 0.05) but were significantly different (p < 0.05) from the other composite flours. The results showed that water absorption capacity of the flours increased as pumpkin pulp flour substitution increased. Pumpkin contains high-insoluble dietary fibre (cellulose, hemicellulose and lignin) which strongly absorb water (Pla, Delbon, Rojas, & Gerschenson, Citation2006). Flours with high-absorption capacities for water may also contain high-hydrophilic constituents such as starches and polar amino acid residues which influence their gelation and hydrophilicity capacity (Kaur & Singh, Citation2005; Odoemelam, Citation2003). Composite flours with low water absorption produce thin meals which are also desirable for infant formulations (Onweluzo & Nwabugwu, Citation2009).
3.1.2. Swelling capacity
The swelling power of USB and SSB composite flours ranged from 400.00% to 472.65% and 440.78% to 480.29% respectively. Formulation H had the highest swelling capacity and was significantly different (p < 0.05) from the rest of the formulations. The lowest swelling capacities were the controls (A and E) which differed significantly (p < 0.05). It was observed that an increase in pumpkin pulp flour substitution increased the swelling capacity of the flours. Swelling capacity of flours from the SSB were significantly higher than the corresponding flours from USB. Swelling capacity is related to protein and starch contents in foods (Woolfe, Citation1992). It is further related to the amylose–amylopectin ratio of the starch where low amylose content leads to a high swelling power (Adebowale et al., Citation2005). Amylopectin is responsible for granule swelling (Tester & Morrison, Citation1990). Pumpkin has about 20–25% amylose and 75–80% amylopectin (Irving, Shingleton, & Hurst, Citation1999). Thus, an increased substitution of pumpkin pulp flour in the composite flours promoted a higher swelling power. Differences in swelling maybe due to differences in molecular organization within the starch granules (Adebowale et al., Citation2005).
3.1.3. Solubility
The solubility of the USB composite flours increased from 9.13% to 13.43%, and from 6.80% to 10.85% in SSB composite flours. Formulation D recorded the highest solubility and differed significantly (p < 0.05) from the other formulations. The controls (A and E) were the lowest. Generally, the solubility of USB flours were higher compared to the SSB flours and the solubility increased with increase in the level of pumpkin substitution. Solubility of flours are influenced by the extent to which water is absorbed and retained within starch granules and the increase in solubility values could be attributed to increase leaching of solubilized amylose molecules from swelled starch granules promoted by destruction of the starches (Pomeranz, Citation1991). Lower values of flour solubility indicate the existence of strong bonding forces within the flour granules arising from coagulated protein or fat that form complexes with amylose preventing it from leaching from the granules (Sung & Stone, Citation2003). Factors capable of influencing the solubility of flours include flour composition and particle size, density and pH, processing conditions and storage conditions (Mirhosseini & Amid, Citation2013).
3.1.4. Dispersibility
Dispersibility measures how individual molecules of flours, disperse and homogenize with a medium of dispersion (Olapade, Babalola, & Aworh, Citation2014). The percentage dispersibility of the composite flours USB and SSB ranged from 56% to 66% and 56% to 65% respectively. The highest values were the controls A and E and the lowest were the D and H which had the highest pumpkin substitutions. Significant differences (p < 0.05) existed among the flours samples. However, no significant differences (p > 0.05) existed among B, E and F formulations as well as between C and G. Flour with a higher dispersibility indicates its ability to reconstitute better in water (Kulkarni et al., Citation1991). Thus, formulations A and E would have a good reconstitution behaviour in water than the other samples. Generally, the dispersibility of all the flour formulations decreased as the percentage of pumpkin pulp flour increased indicating that pumpkin pulp flour did not enhance the re-constitutability of the flours in water.
3.1.5. Bulk densities
Bulk density is a determinant of flour expansion and an indicator of the porosity of food products (Kraithong, Lee, & Rawdkuen, Citation2018). There were no significant differences (p > 0.05) in the porosity, loose bulk density and tapped bulk density amongst the composite flours. Loose bulk density (LBD) ranged from 0.40 to 0.44 g/mL. A higher LBD is undesirable in packaging of foods because it results in a large oxygen reservoir (Otegbayo, Samuel, & Alalade, Citation2013). Tapped bulk density (TBD) was found to be in the range 0.61–0.67 g/mL. TBD represents the compressed state of a poured flour by vibration or tapping and this influences appearance of a product (Barbosa-Canovas, Ortega-Rivas, Juliano, & Yan, Citation2005). The tapped bulk densities of the composite flours were found to be higher than the value of 0.35 g/mL for maize–bambara groundnut flour blend by Mbata, Ikenebomeh, and Ezeibe (Citation2009). Formulations with a higher tapped bulk density (0.67 g/mL) will be the densest and those with the lowest tapped bulk densities would be less dense hence would occupy more space per unit weight requiring more packaging material or space. Presence of fibres also contributes to bulkiness in a flour sample (Akinjayeju & Ajayi, Citation2011). An increase in bulk density offers better packaging advantage since more flour can be kept in a given space (Fagbemi, Citation1999).
3.2. Pasting properties
The results of the pasting characteristics of the flour formulations are shown in Table .
Table 3. Pasting properties of maize–soya–pumpkin flour formulations
3.2.1. Peak viscosity
Peak viscosity (PV) is the ability of starches to swell freely before their physical breakdown and indicates the strength of the pastes formed during gelatinization (Sanni, Kosoko, Adebowale, & Adeoye, Citation2004). The peak viscosities of the composite flours were found to be in the range 67.50–86.00 RVU (for USB) and 65.00–129.00 RVU (for SSB). Formulation H had the highest PV value and was significantly different (p < 0.05) from the remaining formulations except G. Formulation E had the lowest PV and was not significantly different (p > 0.05) from formulation A. The relatively low-PV of the composite flours A and E indicates that the flour will not form a very thick paste hence, may be suitable for products requiring low gel strength and elasticity (Abioye, Ade-Omowaye, Babarinde & Adesigbin, Citation2011). Generally, the peak viscosities increased as the level of substitution of pumpkin flours increased. This could be attributed to the high-carbohydrate content of 94.07% in dry pumpkin pulp as reported by Fila, Itam, and Johnson (Citation2013). Differences observed in the peak viscosities of the composite flours indicates that there were differences in the rate of water absorption and starch granule swelling during heating (Ragaee & Abdel-Aal, Citation2006).
3.2.2. Trough viscosity (holding period)
Trough viscosity (TV) is the minimum viscosity value in the constant temperature phase of the RVA profile measuring the ability of paste to withstand breakdown during cooling (Tharise, Julianti, & Nurminah, Citation2014). TV results for (USB) and (SSB) formulations ranged from 61.50 to 79.00 RVU and 60.00 to 113.50 RVU respectively. In both formulations TV increased with increase in the level of pumpkin flour substitution. High-holding periods were relatively exhibited by formulations G and H with no significant differences (p > 0.05) between them. This indicates that these formulations can withstand high-heat treatments during processing than the formulations A and E which had the lowest trough viscosities. High trough values may represent low cooking losses and superior eating quality (Bhattacharya, Zee, & Corke, Citation1999). TV values for formulations B, C and F were not significantly different (p > 0.05).
3.2.3. Breakdown viscosity
The breakdown viscosity of the flours ranged from 4.50 to 7.00 RVU (USB) and 5.00 to 15.50 RVU (SSB) with formulations B and H recording the lowest and highest values respectively. Significant differences (p < 0.05) existed between them. The breakdown viscosity of flour is regarded as a measure of the degree of disintegration of starch granules or its paste stability during heating (Dengate, Citation1984). A higher breakdown viscosity value indicates a lower ability of the sample to withstand heating and shear stress during cooking (Adebowale et al., Citation2005). Thus, formulation H with the highest breakdown viscosity is less resistant to heat and shearing during heating. Lower breakdown viscosities suggest that pastes are more stable under hot conditions resulting from lower concentrations of starch in a sample (Ayernor, Citation1985).
3.2.4. Final viscosity
From Table , the final viscosity of the flour formulations ranged from 115.50 to 168.50 RVU (USB) and 116.50 to 228.00 RVU (SSB) with formulations G and H having the highest values with no significant difference (p > 0.05) between them. Formulations G and H were significantly different (p < 0.05) from all the other pumpkin composite flours and controls A and E which gave the lowest values. A high-value of final viscosity has been attributed to the aggregation of amylose and a low final viscosity indicates the resistance of the paste to shear stress during stirring. A less stable starch paste is commonly accompanied with high-values of breakdown and could indirectly give a clue of how resistant starch is formed via retrogradation of starch (Liu, Citation1997).
3.2.5. Setback viscosity
Setback viscosity is an index of retrogradation tendency of a paste prepared from a starchy food (Sandhu, Singh, & Malhi, Citation2006). Higher setback values were recorded for formulations G and H which were 114.50 and 118.50 RVU respectively. No significant differences (p > 0.05) existed between them. Formulations with high setback values would produce breakfast meals with less retrogradation, which is beneficial since retrogradation will produce adverse effects on the properties of food products, especially the sensory properties. Lower setback values of 54.00 and 56.50 RVU were recorded for formulations A and E which were not significantly different (p > 0.05). This indicates that, formulations without pumpkin flour substitutions had a higher possibility of retrograding than those with pumpkin pulp flours. Fibre is known to be a good water absorption food component that gives good stabilizing effects on foods. (Adebowale et al., Citation2005) reported a high-amount of fibre in pumpkin pulp (11.46%) and the increasing set back viscosity in the composite flours with pumpkin pulp flour substitutions could be attributed to high-fibre content.
3.2.6. Peak time and pasting temperature
The pasting temperature gives an indication of the minimum temperature required to cook or gelatinize flour and it is also important in managing energy costs and other food components’ stability in a product (Kaur & Singh, Citation2005; Shimelis, Meaza, & Rakshit, Citation2006). The results showed that, pasting temperatures of the various composite flours ranged from 72–78°C with no significant differences (p > 0.05) amongst the formulations. This could be attributed to the similar particle size of the flours (Akinjayeju & Ajayi, Citation2011). The pasting temperature of the cooked breakfast cereals were lower than the boiling temperature of water; hence it can form a paste in hot water below boiling point. The formulations will also have the same cooking time since pasting temperature depicts onset of rise in viscosity and gelatinization temperature of the sample (Otegbayo et al., Citation2013).
Peak time represents the total time taken by each blend to attain its respective peak viscosity. The highest peak time recorded was 7 min and the lowest 6.80 min with no significant differences (p > 0.05) existing between them. Thus, the breakfast cereal blends would require approximately the same cooking time.
The pasting properties of pumpkin–maize–soya bean blends in this study were generally higher than values reported for maize–soybean flour blends (peak 27.71–31.16, trough 23.82–26.19, breakdown 5.31–5.41, final 55.65–56.69, setback viscosity 29.95–31.39 RVU, peak time 4.28–4.49 min) by Edema, Sanni, and Sanni (Citation2005). This indicates that, substitution of pumpkin pulp flour affected the pasting viscosities of maize–soya bean blends in this present study.
3.3. Sensory properties of breakfast cereals from composite flours
The results of the sensory evaluation on the reconstituted breakfast cereals are shown in Table . Sensory evaluation also revealed significant differences (p < 0.05) in the taste, aftertaste and overall acceptability of the breakfast cereals.
Table 4. Sensory evaluation of maize–soya bean–pumpkin composite breakfast meal
3.3.1. Appearance
Mean scores for appearance of the eight formulations ranged from 4.84 to 5.56 with formulations A and C rating the highest and lowest respectively. No significant differences (p > 0.05) existed between all the formulations. Panellists scored neutral and slightly liked the appearance of the breakfast meal. Appearance considers the size, shape, colour, temperature and texture of a given food which influence the reactions or the impressions of the consumer (Molnár, Citation2009).
3.3.2. Colour
The mean scores from 5.09 to 5.75 were ranked by Panellists which indicate that the colour of the formulations were slightly liked. Breakfast cereal A (control) had the highest ranking for colour. In the formulations group, product G was highly rated followed by D. There was no significant different (p > 0.05) existing between them. Variations in the rating could be attributed to the chemical composition of the raw materials, the drying temperature and duration, as well as ratio of substitution of the individual flours (Belitz, Grosch, & Schieberle, Citation2009; Fellows, Citation2009). McDonough, Floyd, Waniska, and Rooney (Citation2004) also reported that browning reactions can occur during roasting of cereal grains which can impart on the colour of cereal flours and meals prepared from them.
3.3.3. Aroma
In terms of aroma, product A was rated highest (5.66) and H (4.94) was the lowest as shown. No significant difference (p > 0.05) existed between the formulations. The aroma of breakfast meals from USB formulations were slightly liked by the panellists and they neither liked nor disliked breakfast meals from SSB formulations. The mean scores indicated that, the panellists were found to like more breakfast meals without pumpkin flour substitution. This may be due to panellists’ familiarity with the smell of maize and soya bean blends. As reported by Enwere (Citation1998) meals prepared from un-dehulled beans may possess a beany aroma which may be disliked by consumers. However, panellists did not detect any beany aroma in the products, which indicates that the processing of the soybean seeds was able to remove the undesirable beany aroma associated with soya bean products (Ampofo, Citation2009).
3.3.4. Taste
The taste ratings for USB and SSB ranged from 4.84 to 5.34 and 4.22 to 4.34 which indicates that neither liked nor disliked to like slightly. Formulation A had the highest rating with breakfast meals from all the blends differing significantly (p < 0.05) from A. Breakfast meals from SSB flours were not significantly different (p > 0.05) from each other and were neither liked nor disliked by the panellists. Differences in taste can be attributed to molecular changes in the flour due to the different processing conditions (soaking, dehulling, drying and roasting) that the raw materials were subjected to (Fellows, Citation2009).
3.3.5. Aftertaste and thickness
The mean scores for aftertaste ranged from 4.84 to 5.22 USB and 4.34 to 4.53 SSB. A had the highest score whilst meal E had the lowest. Breakfast meals prepared from formulations A and E were significantly different (p < 0.05) from each other and the rest. However, mean scores for breakfast meals prepared from formulations C, D, G and H were not significantly different (p > 0.05). The results revealed that an increased pumpkin pulp substitution had an impact on the aftertaste of the products.
Mean score for thickness of the breakfast meal prepared from the flour formulations was within the range of 5.03 to 5.13 for USB and 4.34 to 4.56 for SSB. There were no significant differences (p > 0.05) amongst the formulated breakfast meals. This indicates that, panellists neither liked nor disliked the thickness of the meal. Thickness of the breakfast meal could be attributed to the high-fibre content in pumpkin.
3.3.6. Overall acceptability
The overall acceptability of the formulations ranged from 5.00 to 5.47 and 4.63 to 4.78 for USB and SSB respectively. The highest overall acceptability rating was recorded for A which was significantly different (p < 0.05) from the others. No significant differences (p > 0.05) were recorded for formulations E and G. Breakfast meals prepared from formulations C and D were not significantly different (p > 0.05) from H. The results revealed that addition of pumpkin pulp to breakfast cereals formulated from SSB flours significantly improved their overall acceptability. High overall acceptability values indicate that the product has good chances of being patronized by consumers when launched on the market (Asante, Citation2015). Thus, formulation C and D can compete with formulation A (control) on the market. Similar results were observed in the work of Usha, Lakshmi, and Ranjani (Citation2010) on pumpkin flour incorporated into weaning mix, in which 10% incorporation of pumpkin flour was rated highest by the panellists.
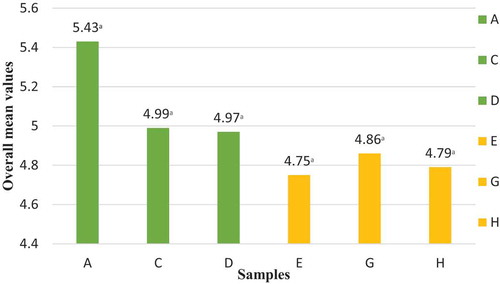
3.3.7. Overall mean values
The overall mean values represent the average values of all the sensory attributes evaluated and are shown in Figure . They indicate the overall sensory impression or perception of the panellists in terms of the acceptability of accepting the breakfast cereals. The highest calculated mean value was for formulation A (control) and the lowest for formulation E. Even though there were no significant differences (p > 0.05) amongst the overall mean values of the breakfast cereals, the values of USB formulations were higher than those of SSB. This implies that the sensory quality of breakfast cereals with un-soaked soya beans were more acceptable to the panellists than those with soaked soya bean flour as composite. (Luckow, Sheehan, Delahunty, & Fitzgerald, Citation2005) revealed in their study that the habitual consumption and familiarity of a food increases its acceptability. Hence the higher mean value for formulation A could be attributed to the fact that it is the well-known maize–soya bean blends (Tom Brown) commonly found on the market and therefore, panellists were more familiar and accustomed to it.
Figure 1. Overall mean values of sensory attributes of the formulated breakfast cereals.
4. Conclusion
This research showed that formulation with the highest substitution (15%) pumpkin pulp flour obtained relatively the highest values amongst the functional properties (Water absorption capacity, swelling capacity, solubility and bulk density) and pasting properties (peak, trough, breakdown, final and setback viscosities). An increase in pumpkin pulp flour substitution decreased the dispersibility of the flour blends. Sensory evaluation indicated that significant differences (p < 0.05) existed in the taste, aftertaste and overall acceptability of the breakfast cereals with panellists generally preferring meals developed from un-soaked soya bean flours to that from soaked soya bean flours. The overall mean values showed that the control (USB) was the most preferred sample with the highest value of 5.43 and was not significantly different (p > 0.05) from the 10% pumpkin pulp substitution with an overall mean value of 4.99. It can be concluded that pumpkin pulp flour enhanced the functional and pasting characteristics of the composite flour and the prepared breakfast cereals from the flours had acceptable sensory properties.
Additional information
Funding
Notes on contributors
Joseph Adubofuor
Esumaba Serwa Asaam was a student of the Kwame Nkrumah University of Science and Technology, at the Department of Food Science and Technology during this study. She recently finished her role as a Teaching Assistant in the same university.
Joseph Adubofuor is a Senior Lecturer at the Department of Food Science and Technology, KNUST. He was the supervisor for this study and he is currently engaged on his PhD research at the same university.
Isaac Amoah has a BSc. Biochemistry and MPhil Human Nutrition and Dietetics degrees with experience and interest in food product development. He was involved in the conceptualization of the objectives of this study and also played a role in the supervision of the study. He is currently a PhD student with the Auckland University of Technology.
Osborn-Jnr Doetser Apeku was a Teaching Assistant at the Department of Food Science and Technology, KNUST at the time of this study.
References
- Abioye, V. F., Ade-Omowaye,B. I. O., Babarinde, G. O., & Adesigbin, M. K. (2011). Chemical, physico-chemical and sensory properties of soy-plantain flour. African Journal of Food Science, 5(4), 176–180.
- Adebowale, Y. A., Adeyemi, A., & Oshodi, A. A. (2005). Variability in the physicochemical, nutritional and antinutritional attributes of six Mucuna species. Food Chemistry, 89(1), 37–48. doi:10.1016/j.foodchem.2004.01.084
- Adubofuor, J., Amoah, I., & Agyekum, P. B. (2016). Physicochemical properties of pumpkin fruit pulp and sensory evaluation of pumpkin-pineapple juice blends. American Journal of Food Science and Technology, 4(4), 89–96.
- Akinjayeju, O., & Ajayi, O. F. (2011). Effects of Dehulling on Functional and Sensory Properties of Flours from Black Beans. doi:10.4236/fns.2011.24049
- Akpapuimam, M. A., & Markakis, P. (1981). Physicochemical and nutritional aspects of cowpea flour. Journal of Food Science, 46(3), 972–973. doi:10.1111/j.1365-2621.1981.tb1540
- Ampofo, V. (2009). Production and sensory analysis of soybean and wheat flour composite cake. HND Dissertation, Cape Coast Polytechnic, Cape Coast, Ghana, pp. 1, 5–7.
- Asante, F. A., (2015). Process development and evaluation of tiger nut based chocolate products, [dissertation]. Kumasi: Kwame Nkrumah University of Science and Technology, pp. 57.
- Ayernor, G. S. (1985). Effects of the retting of cassava on product yield and cyanide detoxication. International Journal of Food Science & Technology, 20(1), 89–96. doi:10.1111/j.1365-2621.1985.tb01907
- Barbosa-Canovas, G. V., Ortega-Rivas, E., Juliano, P., & Yan, H. (2005). Food powders. Physical properties, processing, and functionality (Vol. 86, pp. 71–75). New York: Kluwer Academic/Plenum Publishers.
- Belitz, H. D., Grosch, W., & Schieberle, P. 2009. Food chemistry. Springer, 4th. Springer-Verlag: Berlin, Vol. 173, 959–966. doi: 10.1007/978-3-540-69934-7.
- Bhattacharya, M., Zee, S. Y., & Corke, H. (1999). Physiochemical properties related to rice noodles. Cereal Chemistry, 76(6), 861–867. doi:10.1094/CCHEM.1999.76.6.861
- Dengate, H. N. 1984. Swelling, pasting and gelling of wheat starch. USA Advances in Cereal Science and Technology;49–82.
- Edema, M. O., Sanni, L. O., & Sanni, A. I. (2005). Evaluation of maize-soybean flour blends for sour maize bread production in Nigeria. African Journal of Biotechnology, 4(9), 911–918.
- Enwere, N. J. (1998). Foods of plant origin: Processing and utilization (pp. 224–232). Nsukka: Afro-Orbis Publications Ltd.
- Eriksson, E. (2013). Flour from three local varieties of cassava (Manihot esculenta crantz): physico-chemical properties, bread making quality and sensory evaluation. [ Master’s thesis]. Uppsala: Swedish University of Agricultural Science, pp. 17, .
- Ezeokeke, C. T., & Blessing Onuoha, A. (2016). nutrient composition of cereal (maize), legume (soybean) and fruit (banana) as a complementary food for older infants and their sensory assessment. Journal of Food Science and Engineering, 6, 139–148. doi:10.17265/2159-5828/2016.01.004
- Fagbemi, T. N. (1999). Effect of blanching and ripening on functional properties of plantain (Musa aab) flour. Plant Foods for Human Nutrition, 54(3), 261–269. doi:10.1023/A:1008153404357
- Fellows, P. J. 2009. 15 - Extrusion BT - food processing technology, 2nd. Woodhead publishing series in food science, technology and nutrition. pp.456–477. doi: 10.1533/9781845696344.3.456
- Fila, W., Itam, E., & Johnson, J. (2013). Comparative proximate compositions of watermelon (Citrullus Lanatus), squash (Cucurbita Pepo’l) and rambutan (Nephelium Lappaceum). International Journal of Science and Technology, 2(1), 81–88.
- Goyal, R., Sharma, S., & Gill, B. S. (2012). Variability in the nutrients, antinutrients and other bioactive compounds in soybean [Glycine max (L.) Merrill] genotypes. Journal of Food Legumes, 25(4), 314–320.
- IBGE, (Brazil Institute of Geography and Statistics). (2010). Household food acquisition per capita: Brazil and large regions. Family Budget Survey 2008–2009. Rio de Janeiro.
- Irving, D. E., Shingleton, G. J., & Hurst, P. L. (1999). Starch degradation in bu-ttercup squash (Cucurbita maxima). Journal of the American Society for Horticultural Science, 124(6), 587–590.
- Kaur, M., & Singh, N. (2005). Studies on functional, thermal and pasting properties of flours from different chickpea (Cicer arietinum L.) cultivars. Food Chemistry, 91(3), 403–411. doi:10.1016/j.foodchem.2004.06.015
- Kraithong, S., Lee, S., & Rawdkuen, S. (2018). Physicochemical and functional properties of Thai organic rice flour. Journal of Cereal Science, 79, 259–266. doi:10.1016/j.jcs.2017.10.015
- Kulkarni, K. D., Kulkarni, D. N., & Ingle, U. M. (1991). Sorghum malt-based weaning formulations: Preparation, functional properties and nutritive value. Food and Nutrition Bulletin, 13(4), 322–327.
- Leach, H. W., McCowen, L. D., & Scoch, T. J. (1959). Structure of the starch granule. I. swelling and solubility patterns of various starches. Cereal Chemistry, 36, 535–545.
- Liu, D. (1997). Maternal care, hippocampal glucocorticoid receptors, and hypothalamic-pituitary-adrenal responses to stress. Science, 277(5332), 1659–1662. doi:10.1126/science.277.5332.1659
- Luckow, T., Sheehan, V., Delahunty, C., & Fitzgerald, G. (2005). Determining the odor and flavor characteristics of probiotic, health- promoting ingredients and the effects of repeated exposure on consumer acceptance. Journal of Food Science, 70(1), 53–59. doi:10.1111/j.1365-2621.2005.tb09065
- Mbata, T. I., Ikenebomeh, M. J., & Ezeibe, S. (2009). Evaluation of mineral content and functional properties of fermented maize (Generic and specific) flour blended with bambara groundnut (Vigna subterranean L). African Journal of Food Science, 3(4), 107–112.
- McDonough, C. M., Floyd, C. D., Waniska, R. D., & Rooney, L. W. (2004). Effect of accelerated aging on maize, sorghum, and sorghum meal. Journal of Cereal Science, 39(3), 351–361. doi:10.1016/j.jcs.2004.01.001
- Mirhosseini, H., & Amid, B. T. (2013). Effect of different drying techniques on flowability characteristics and chemical properties of natural carbohydrate-protein Gum from durian fruit seed. Chemistry Central Journal, 7(1), 1–14. doi:10.1186/1752-153X-7-1
- Molnár, P. J. (2009). Food quality indices. Food Quality and Standards, 2(10), 89.
- Odoemelam, S. A. (2003). Chemical composition and functional properties of conophor nut (Tetracarpidium conophorum) flour. International Journal of Food Science and Technology, 38(6), 729–734. doi:10.1046/j.1365-2621.2003.00725.x
- Okafor, G. I., & Usman, G. O. (2014). Production and evaluation of breakfast cereals from blends of African yam bean (Sphenostylis stenocarpa), maize (Zea mays) and defatted coconut (Cocus nucifera). Journal of Food Processing and Preservation, 38(3), 1037–1043. doi:10.1111/jfpp.12060
- Olapade, A. A., Babalola, Y. O., & Aworh, O. C. (2014). Quality attributes of fufu (fermented cassava) flour supplemented with bambara flour. International Food Research Journal, 21(5), 2025–2032.
- Omwamba, M., & Mahungu, S. M. (2014). Development of a protein-rich ready-to-eat extruded snack from a composite blend of rice, sorghum and soybean flour. Food and Nutrition Sciences, 5(14), 1301–1310. doi:10.4236/fns.2014.514142
- Onweluzo, J. C., & Nwabugwu, C. C. (2009). Fermentation of millet (Pennisetum americanum) and pigeon pea (Cajanus cajan) seeds for flour production: Effects on composition and selected functional properties. Pakistan Journal of Nutrition, 8(6), 737–744. doi:10.3923/pjn.2009.737.744
- Otegbayo, B. O., Samuel, F. O., & Alalade, T. (2013). Functional properties of soy-enriched tapioca. African Journal of Biotechnology, 12(22), 3583–3589. doi:10.5897/AJB12.2654
- Pillay, K., Derera, J., Siwela, M., & Veldman, F. J. (2011). Consumer acceptance of yellow, provitamin a-biofortified maize in KwaZulu-Natal. South African Journal of Clinical Nutrition, 24(4), 186–191. doi:10.1080/16070658.2011.11734386
- Pla, M. D. E., Delbon, M., Rojas, A. M., & Gerschenson, L. N. (2006). Effect of immersion and turgor pressure change on mechanical properties of pumpkin (Cucumis moschata, Duch.). Journal of the Science of Food and Agriculture, 86(15), 2628–2637. doi:10.1002/jsfa.2663
- Pomeranz, Y. (1991). Proteins: general. Functional properties of food components (pp. 147–189). doi:10.1017/CBO9781107415324.004
- Ragaee, S., & Abdel-Aal, E. S. M. (2006). Pasting properties of starch and protein in selected cereals and quality of their food products. Food Chemistry, 95(1), 9–18. doi:10.1016/j.foodchem.2004.12.012
- Sandhu, K. S., Singh, N., & Malhi, N. S. (2006). Some properties of corn grains and their flours I: Physicochemical, functional and chapati-making properties of flours. Food Chemistry, 101(3), 938–946. doi:10.1016/j.foodchem.2006.02.040
- Sanni, L. O., Kosoko, S. B., Adebowale, A. A., & Adeoye, R. J. (2004). The influence of palm oil and chemical modification on the pasting and sensory properties of fufu flour. International Journal of Food Properties, 7(2), 229–237. doi:10.1081/JFP-120026059
- Sharma, J. L., & Caralli, S. (2004). A dictionary of food and nutrition (pp. 8). New Delhi: CBS Pub India.
- Shimelis, E. A., Meaza, M., & Rakshit, S. K. (2006). Physico-chemical properties, pasting behavior and functional characteristics of flours and starches from improved bean (Phaseolus vulgaris l.) varieties grown in East Africa. Agricultural Engineering International, 8, 1–19.
- Sosulski, F., Garratt, M., & Slimkard, A. (1976). Functional properties of ten legume flours. Canadian Institute of Food Science and Technology Journal, 9(2), 66–69. doi:10.1016/S0315-5463(76)73614-9
- Sung, W. C., & Stone, M. (2003). Characterization of various wheat starch in pasta development. Journal of Marine Science and Technology, 11(2), 61–69.
- Tester, R. F., & Morrison, W. R. (1990). Swelling and gelatinization of cereal starches. I. Effects of amylopectin, amylose, and lipids. Cereal Chemistry, 67(6), 551–557.
- Tharise, N., Julianti, E., & Nurminah, M. (2014). Evaluation of physico-chemical and functional properties of composite flour from cassava, rice, potato, soybean and xanthan gum as alternative of wheat flour. International Food Research Journal, 21(4), 1641–1649. doi:10.1002/fsn3.321
- Tiencheu, B., Achidi, A. U., Fossi, B. T., Tenyang, N., Flore, E., Ngongang, T., & Womeni, H. M. (2016). Formulation and nutritional evaluation of instant weaning foods processed from maize (Zea mays), pawpaw (Carica papaya), red beans (Phaseolus vulgaris) and mackerel fish meal (Scomber scombrus). American Journal of Food Science and Technology, 4(5), 149–159. doi:10.12691/ajfst-4-5-5
- Usha, R., Lakshmi, M., & Ranjani, M. (2010). Nutritional, sensory and physical analysis of pumpkin flour incorporated into weaning mix. Malaysian Journal of Nutrition, 16(3), 379–387.
- Woolfe, J. (1992). Sweet potato: An untapped food resource (Vol. 366–372, pp. 1–13). Cambridge: Cambridge University Press.