
 ?Mathematical formulae have been encoded as MathML and are displayed in this HTML version using MathJax in order to improve their display. Uncheck the box to turn MathJax off. This feature requires Javascript. Click on a formula to zoom.
Abstract
The mixed crop–livestock systems are acknowledged as sustainable due to its complementarity and synergy, contribution to welfare, food security, income, and poverty alleviation. The lack of efforts in the long-term impact for increased and more efficient food production, however, threatens the livelihoods and food security of smallholder producers. This paper provides a description on smallholder crop–livestock systems in the dominant system unit of crop and livestock production discretely subdividing in different agroecological zones (AEZs) into land-use land-cover class for considering factors influencing socioeconomic and agricultural intensification. A linear mixed-effects model was carried out to fit the relationship between the land-cover measurement and the corresponding farm enterprise in land use. The repeated measurements of linear predictors that fit in full and reduced model analysis were conducted in the system framework. The landscape slope (%), elevation (m) and market distance (minute) analysis were used in spatial adjustment in the specific system. The overall area of land-use system of the peasant holdings was 599.86 ha. The area covered by annual crops was 56%, which was higher (p < 0.01) compared to the area covered by natural pasturelands (17%), perennial crops (15%), vegetable (1%) and the tree or grass cover (2%). Distinct six farming systems were characterized, each being significantly different from other. The difference within a similar AEZ could probably be a result of a minor level of farm systems manipulation. The major difference associated could essentially be with a difference in agroecology and spatial variability of the farm households.
PUBLIC INTEREST STATEMENT
Human civilization is currently increasingly threatened due to climate change, growing population, biodiversity loss and various other challenges. It is essential to use existing resources to be extremely well functioning in food system. Smallholder producers attempt to increase food production and improve farm efficiency by selecting farm enterprises, which are flexible in land use over seasons, relative turnover in ecology, marketing condition, price competence, and labor requirement. A means of system interaction, output delivery, and mechanization as well as by joint producing socially for land, labor, seed, and oxen between wealth groups have enhanced their ability and capability. The degree of integration between these units, therefore, significantly controls material cycles, energy flow, flow path connection and system management in a spatial structure. Increased integration of food system could be essential to understand factors influencing both socioeconomic and biophysical potential.
Competing interests
The authors declare no competing interests.
1. Introduction
Mixed crop–livestock systems provide the majority of the cereal and livestock domestic products for households in developing countries (Tarawali, Herrero, Descheemaeker, Grings, & Blümmel, Citation2011). Mixed systems produce 65% of the beef, 75% of the milk and 55% of the lamb in the developing world and account almost 50% of global cereals production (Herrero et al., Citation2010). More than 90% of rural households in Ethiopia rely on livestock, crop production or a combination of the two as the main occupation of the family farm (Ethiopia & Headquarters World Food Program, Citation2014).
The intensification of this system, however, following the present rapid population growth, urbanization and rising income be desirable to meet the growing demands of the human population with emphasizing the increased role of livestock in smallholder farming systems (Stroebel, Swanepoel, & Pell, Citation2011). Smallholders in Sub-Saharan Africa depend largely on the use of land resources for their subsistence. It is certain that income generated from livestock is crucial addition to livelihoods together with cropping source, which is decreasing vulnerability to risk factor and reduce dependency on external inputs in smallholder systems (Behera, Yates, Kebreab, & France, Citation2008). Livestock usually has multiple purposes, it provides food, income, draught power for crop production, manure to improve soil fertility and it is an essential asset for insurance in times of scarcity (e.g., Amejo, Gebere, Kassa, & Tana, Citation2018a).
The smallholder farmers’ vulnerability to risks is increasing in the area where there are land fragmentation, climate change extremity and other supply-side challenges. With respect to a natural resource and for the improvement of farm household livelihoods, diversification is a risk management strategy that may enable the realization of complementary between different household farm activities, such as between crops and livestock. Crop–livestock integration and intensification are usually consequences of the increased population pressure for land (Foley et al., Citation2011; Lemaire, Franzluebbers, de Faccio Carvalho, & Dedieu, Citation2014). Diversified farming systems, however, means not necessarily are integrated. Integration of diverse household farming systems is often associated with sustainable and resource use efficient systems (Kremen, Iles, & Bacon, Citation2012). On the other hand, the compartments may be connected in several different ways, in an integrated and diverse farming system so that the degree of integration also varies (Rufino, Citation2008). The characteristics of intensification can also vary in the account to agroecological potential, labor opportunities, market access and costs of labor and land, and the benefits of farmers in particular production system.
Increased integration between different farm household activities can create opportunities for research and development strategies, technological alternatives, vertical integration of market channels for different household activities simultaneously and unusual intensification that occurs traditionally in mixed crop–livestock production systems. Moreover, the role and scope of rural smallholders’ livelihood activities will be recognized for policy options, for increased resource use efficiency and for development support in more intensified form. The objectives of this study were, therefore, to understand the spatial dynamics and socioeconomic characteristics of natural resource-based mixed crop–livestock systems and to give a framework for agricultural intensification in specific system unit in an agroecology. Moreover, the study aimed to evaluate and characterize smallholder crop–livestock systems discretely subdividing in different agroecological zone (AEZ) into land-use land-cover (LULC) change in south-western Ethiopia, with focus on opportunities for intensification and maximizing the benefit from crop–livestock integration.
2. Materials and methods
2.1. Description of study area
The study was conducted in two administrative zones (Gamo Gofa and Dawuro) in South Nations Nationalities Peoples’ (SNNP) regional state, Ethiopia. Gamo Gofa and Dawuro zones lie between 5° 34′ 16.31′′ N to 7° 20′ 58.01′′ N latitude and 36° 22′ 13.04′′ E to 37° 51′ 26.31′′ E longitude (Amejo, Citation2018; Amejo et al., Citation2018a). The capital town Arba Minch of Gamo Gofa zone and Tarcha of Dawuro zone is found respecting at about 490 and 505 km south of Addis Ababa. According to the Central Statistical Agency (CSA), the total human population is about 2.66 million (CitationCentral Statistical Agency [CSA], 2013) with a total coverage area of about 16,530 km2. The rural population is about 88% in Dawuro and 84% in Gamo Gofa. The study zones were selected purposively based on the diversity in the farming systems and the agroecology zones (e.g., Amejo, Citation2018; Amejo et al., Citation2018a).
2.2. Sampling and data collection procedure
2.2.1. Sampling
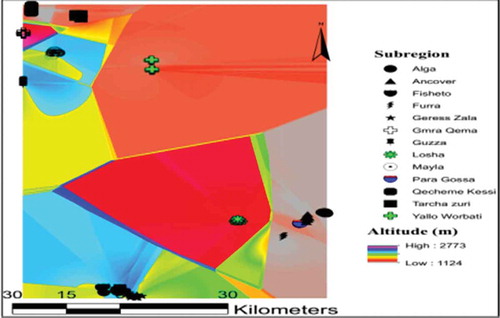
Initial in each study zone, the districts were stratified into three AEZs, the highland (>2,400 m above sea level; m.a.s.l.), the midland (1,500–2,400 m.a.s.l.) and the lowland (<1,500 m.a.s.l.) based on agroecology (Dove, Citation1890; Hurni, Citation1998; Ministry of Agriculture [MoA], Citation2000) classification in Ethiopia. Following districts were selected from the AEZ randomly, and peasant administrations (PAs) were designated based on discussion with community and secondary information to the farm production potential. The Global Positioning System (GPS) was used to track the household level baseline information during the survey. The GPS reference point was Universal Transverse Mercator zone 37N (Geographic CRC., Citation2015). The PAs selected in the Gamo Gofa administrative zone were one in wet highland (Losha) in Chencha district, two in wet upper lowland to subhumid (Fishto and Gress Zala) in Bonke district and four in dry lowland (Alga, Ancover, Furra and Para Gossa) in Mirab Abaya district. In Dawuro zone, one belongs to the wet highland (Gmra Qema) in Tocha district, two in the wet upper lowland to subhumid (Guzza and Myla) in Issara and the Mareka and three in the wet lowland (Qchem Kessi, Tarcha Zura and Yallo Worbati) in Tocha, Mareka and the Loma districts, respectively. Totally, 13 PAs (7 from Gamo Gofa and 6 from Dawuro) were selected (Figure ). The four distinct AEZs (wet highland, wet upper lowland to subhumid and wet and dry lowland) were characterized later based on GPS tracked baseline information.
Figure 1. Spatial distribution of sample peasant administration processed in Arc GIS 10.2.
2.2.2. Data collection procedure
Qualitative and quantitative information regarding socioeconomic, farm holdings, crops grown per plot, patterns of cropping, the cover area per crops, herd structures of cattle, sheep, goats, poultry and the livestock products and honeybee keeping were collected using pretested questionnaire during households interview. Generic household-level data for integrated crop–livestock system (Herrero, González-Estrada, Thornton, & Hoogenboom, Citation2005; Herrero et al., Citation2007) collection procedure were followed. The data were collected using a semi-structured questionnaire. A total of 345 (186 from Gamo Gofa and 159 from Dawuro) crops-related entries and 352 (191 from Gamo Gofa and 161 from Dawuro) livestock-related entries were interviewed and recorded. Individual household, who owned at least one ruminant (cattle, sheep, or goat) livestock in the farm, was randomly selected and interviewed for both crop and livestock entry information. The minimum sample size included in lower sample unit (PA) was also adapted from an early study (Erenstein, Citation2007).
Additional data were collected in 10 individual participatory groups for 3 types (across AEZ, the center to the consumer, and the urban center over 75,000 populations dwell) of market distance (minute) from the sample household locations. The data in distance to agricultural or local market were collected during the household interview. The data collection took place between February 2014 and December 2016. Soil type from world soil database version 1.2 (FAO/IIASA/ISRIC/ISS-CAS/JRC, Citation2012) and the landscape slope from digital elevation model in the area extent of the study zones was derived in Arc GIS 10.2, extracted to zonal statistics using the elevation point value tracked in GPS. The digital elevation model in 10 m × 10 m resolution to entire study zones was derived from global mapper 8 that in its common coordinate system was assembled to Arc GIS 10.2 working environment (Amejo, Citation2018).
2.2.3. Definition of the scenario
The scenario relates to different patterns of land use (the dual function) among households in the PA. The scenario supposes that the main characteristic of agricultural land management is similar at zonal level in the current study area. That is the land used for human settlements (local communities), agriculture (annual crops, vegetable, perennial and natural pastureland), and collecting and fishing. The agricultural system of the area is characterized by low capital-intensive power, weakly market-oriented, based on traditional mechanization and manual work, and the presence of a variety of work patterns (on-farm, off-farm, non-farm household typologies). According to Littell, Milliken, Stroup, Wolfinger, and Schabenberger (Citation2006), methods that address spatially dependent data can be divided into two basic groups, characterization and adjustment.
2.2.4. Analytical framework
The LULC change classification performed to the farming system based on household interviewed data, which are used in the characterization of the system framework and the spatial baseline information and market distance information, was used in spatial adjustment as a multi-criteria variable. The land area of the farm enterprises was compared based on their size, and agricultural system characterization based on statistical test. The supply in household total consumption and income flow, the economic and environmental performances were also taken into account. Earlier studies have collected concurrent data across a large surface area (over 40 km) that enabled researchers to investigate only spatial variability without having to control for temporal changes. Mullen and Birkeland (Citation2008) analyzed the data using a fixed effect repeated measures model, a random effect clustered data model and a spatially dependent fixed effects model using normally distributed continuous data. A general linear model provides a suitable framework for dependent response and/or categorical variables description and the model selection process that was followed in this study method.
2.3. Statistical analysis
A linear mixed-effects model (LME), which allows modeling a spatially correlated outcome (Mullen & Birkeland, Citation2008), was employed to fit the relationship between LULC measurements. A full model was fit using maximum likelihood (ML) without any random effects. A ML estimate method was used when comparing models with different random effects (West, Welch, & Galecki, Citation2014). The criterion of rejecting a predictor was that the reduced model developed by dropping that predictor was not significantly worse than the full model (Yao et al., Citation2016). This procedure was repeated until no further predictors were rejected, and the p-values for individual effects were inspected. Chi-square (χ2) test was conducted using Kruskal–Wallis multiple comparisons test (p < 0.05) for the LULC data. Exploratory statistics measurements were analyzed in the SPSS (2011) software. Mean and standard deviation were computed for farm holdings, family size, herd head, as well as elevation, landscape slope and marketing distance. One-way analysis of variance was conducted for socioeconomic and the environmental factors (elevation and slope), and test comparison was done by the Bonferroni test (p < 0.05). The spatial analysis procedure was carried out in Arc GIS 10.2 environment for soil, slope and elevation, as well as inverse distance interpolation was performed for a spatial distribution of soil at different PA. Both baseline information tracked at household level and other retrieved metadata sources were projected into World Geodetic System 1984 (WGS84) during spatial data analysis in Arc GIS 10.2. A familiar general mixed model notation is shown in Equation (1) as
where Yi is the response variable (i), Xi is the data matrix of the variable (i), β is a fixed effect covariate, Li is the random effect of observed value covariates (i), mi is the random effect for the ith subject and ɛi is the random effect error.
The random effect model to linear predictor is shown in Equation (2) as
The land-cover data in the farming system were fitted to the land-use matrix of farm enterprise of different locations in crop–livestock systems.
3. Results and discussion
3.1. Classification of agricultural LULC
The overall agricultural LULC area of the sample PAs was 599.86 ha (Table ). The area covered by annual crops was 56%, which was higher (p < 0.01) compared to the area covered by natural pasturelands (17%), perennial crops (15%), vegetable (1%) and the tree or grass cover (2%). There was no significant difference (p > 0.05) between the perennial and the natural pastureland for the agricultural land-cover area. The difference was not significant (p > 0.05) in overall LULC among the PA (Table ), while among the agroecology, there was a difference (p < 0.05).
Table 1. Land-cover area (ha) of agricultural land use in peasant administration (PA)
Table 2. Chi-square (χ2) multiple comparison tests on agricultural land-cover area of the farm enterprises in peasant administration
There was a significant difference (p < 0.05) in the land-cover area among the annual crops (Table ). Accordingly, the land-cover area was higher for maize followed by tef and wheat, compared to the other annual crops while there was no significant difference (p > 0.05) in land-cover area among groundnut/peanut, maize, tef and wheat. Similarly, the land-cover area of maize was ranked as first and accounted for 47.84% of the national and 56.27% of the regional (SNNP) private peasant production (Central Statistical Agency [CSA], Citation2016) in Ethiopia.
The LULC of wheat was significantly higher than barley in this study; however, according to CSA of Ethiopia (CSA, Citation2016), the cropland area estimate was higher for barley than the wheat. The discrepancy could probably be due to the difference margin of the yield that farmers obtain based on the decision they made for a unit of the plot. The different margins of yield for a hectare, for instance, for wheat were exceeded by 342 kg than the barley in peasant production in SNNP region (CSA, Citation2016). The market price and soil fertility situation could also contribute to the decisions of the producers. The finding was consistent with CSA (Citation2016).
Moreover, Notenbart et al. (Citation2009) reported the relative difference in importance between the regions and the cereal-dominated systems across Sub-Saharan Africa. In eastern Africa, more than 70% of the area is under cereal systems with very small areas dominated by root or tree crops (Notenbart et al., Citation2009). Garret et al. (Citation2017) were described substantial less common as a proportion of livestock area in mixed systems in Brazil and New Zealand.
The land-cover area of enset, banana, bamboo, and coffee was significantly higher (p < 0.05) compared to the other plantation crop in the perennial category but in comparison with apple fruits, the difference was not significant (p > 0.05). The land-cover area of vegetable was significant (p < 0.05) within groups (Table ), in which cabbage was significant to all except garlic (p > 0.05). There was the difference (p < 0.05) between livestock type in the land-use system (Table ). The number of equine was significantly lower (p < 0.01) than cattle and the small ruminants (p < 0.01). The land-use system was not significant (p > 0.05) between the ruminant livestock.
There was variations in cabbages, garlic, groundnut, apple fruit and potato crops production between the PAs and AEZs, which could be due to farmers preference, production objective and agroecological requirement of the crops. The way the farming system functions has a remarkable value in land-use efficiency, labor productivity, and income supplement.
3.2. Socioeconomic and environmental characteristics
The farm holdings, herd and family size of each showed significant difference (p < 0.05) among the PA (Table ). The average family members (number of head) were significantly higher in Gress Zala whereas lower in Myla, Guzza and Gmra Qema PAs (Table ). The farm size (ha/household) was higher in Gress Zala, Qchem Kessi and Tarcha Zura whereas lower in Losha, Ancover and Alga. The herd size (head in Tropical Livestock Unit, TLU/household) was significantly higher and above overall mean in the Yallo Worbati, Qchem Kessi, Guzza and Myla PAs (Table ). The herd head was low in Losha and Ancover PA. The analysis of variance was significant, (F = 8.08, p = 0.00) for farm size, (F = 6.38, p = 0.00) for family members and (F = 6.57, p = 0.00) for herd head, respectively, in the PA.
Table 3. Family and farm size, and livestock herd head of the households in peasant administration (mean and standard deviation [SD])
The overall distance (minute) of the market was significantly longer from Guzza followed by from Gmra Qema and Myla PA at p < 0.05 (Table ). The distance was shorter from Ancover, Alga, Para Gossa, Furra and the Losha PA. The analysis of variance was also significant (F = 12.76, p < 0.00) in the distance to the market types from the PA.
Table 4. Overall (mean and standard deviation [SD]) distance (minute) from the peasant administration to market type
The distance (minute) of the market observed in the dry lowland was shorter (p < 0.05) compared to the other agroecology (Table ). The distance from households was shorter for agricultural market but longer for urban market (Table ). The variation in distance from the households was significant (F = 16.33, p = 0.00) in the AEZs, as well as (F = 135.50, p = 0.00) for marketing situations.
Table 5. Overall (mean and standard deviation [SD]) distance (minute) among agroecological zone (AEZ) and market type in peasant administration
The landscape slope (%) was significantly higher (p < 0.05) in the wet upper lowland to subhumid, but lower (p = 0.000) in the dry lowland AEZ (Table ). The elevation was found significant (p < 0.05) among the AEZs. A variation in elevation (m) among the AEZs was also significant (F = 4,825.45, p = 0.00).
Table 6. Elevation (m) tracked during field survey and landscape slope (%) processed in Arc GIS 10.2 in agroecological zone (mean and standard deviation [SD])
Supporting the present study finding, five main factors limit the possible occurrence and importance of different types of crop and livestock found in any actual farm system in tropical condition was presented briefly (Ruthenberg, Citation1971). This could shape the choices of the farm household in types of crop and livestock, even similar the AEZ and climate conditions while varying in location. Agricultural potential makes certain systems predominant and is shaped significantly by agroecology, among other factors (Swanepoel, Stroebel & Moyo., Citation2010). Once market-orientated smallholder production systems have intensified to significantly close yield gaps in crop and livestock production, increases in efficiency gains and opportunity costs for the land determine their viability (Naylor et al., Citation2005).
The difference in the farming system observed in similar agroecology, for instance, between Losha and Gmra Qema farming system in wet highland PAs could be due to spatial difference between the two PAs. Practically, the urban growth has its consequence for land use and livelihood intensification on the rural–urban fringe by deriving farmers’ strategy in certain challenges, particularly in the Losha households with significant lower landholdings. One of the proximity markets to Losha is Arba Minch city with about 142,900 population (Ethiopia, Citation2015). However, numerical advantage in farm size could probably allow growing staple food crops such as enset and increasing consumption of home-based food in the Gmra Qema household (Amejo et al., Citation2018a).
The higher demographic characteristics in the highland and the lowland might reflect increased population density with an early period settlement and reducing resource potential regarding the former (Amejo, Citation2018; Amejo et al., Citation2018a), while the latter case might be indicating the shift of population movement from the highland to the lowland with depleting and scarcity of resources in the highland. The higher landscape slope, on the other hand, could probably halt either horizontal or vertical expansions of human population in the wet upper lowland to subhumid.
The other considerable factor limits the farming system, particularly in the wet highland, PAs could be a frost-related soil-crop disease problem. On frost condition in Ethiopia, a number of evidence exist (Hurni, Citation1998). A recent study (Amejo, Gebere, Kassa &Tana, Citation2018b) also determined an extreme wet event in annual scale particularly to Gmra Qema side PAs. The cultivating of added-value crops like potatoes is in far distance PA such as Gmra Qema, presumably challenged from such similar problems. Soil data analysis from FAO metadata source also determined that major soils in the PAs had problems of sodicity and salinity, and some others were very acidic and poor organic carbon content at the farm level (Amejo, Citation2018; Amejo et al., Citation2018a).
Agricultural productivity in smallholders system could chiefly aggregate an effect of interaction between elements and component, specialization and diversity in a farming system, which mainly found in food production biomass (Amejo et al., Citation2018a). Thus, it is less likely to alleviate poverty and to improve food security from landholdings alone in the smallholder family farm. Because many smallholder farm institute small plots in many developing countries that it is obvious. Hepelwa (Citation2010) suggested that the first most feasible means to increase agricultural production is via improving technical efficiency; another (Nijbroek & Andelman, Citation2016) said that a closer look at all the extension service, for example, available resources, technologies and farmer perception is needed for scaling up.
3.3. Farming system characterization
The LME modeling method was carried out in continuous data gathered on the agricultural land-cover area in smallholder crop–livestock systems. The two in the wet highland, one in wet upper lowland to subhumid, two in the wet and one in the dry lowland, total six subsystems were characterized (Table ). The three significantly dominant grain crops in the land-use area of the study households were maize, wheat and tef. Wheat significantly differentiated the land-use system in the wet highland and the wet upper lowland to subhumid whereas maize and tef in the lowland and the wet upper lowland to subhumid AEZs. The groundnut was not significantly different from maize, wheat and tef for the area covered in these crops category and unique in the Yallo Worbati farming system (Table ).
Table 7. Dominant farming system characterized in smallholder mixed crop–livestock systems in agroecological zone (AEZ) and peasant administration (PA)
In comparisons to perennial crops category such as banana, enset, coffee, bamboo and apple fruits were not significantly different from each other in the agricultural land-use system. While different spatial to characterize different systems probably due to AEZ influences (Table ). Similarly, in vegetable land-use system, cabbage and garlic were significantly higher than the other vegetable category crops. However, in existing circumstances of system intensification, adoption and adaptations of production ecology and farmers’ preferences, the market potential, flexibility in land use and the roles to household income over season not only cabbage but also other horticultural crops expansions and developments are increasingly essential in Losha and the lessons can be learnt henceforth to the other farm systems. A similar feature was reflected for garlic production in Gmra Qema. The land-use systems of the ruminant livestock had not explained a variation in PA or AEZ; however, small ruminants were varied in gradients that sheep in the highland and goats in the lowland systems were dominant. Both sheep and goats were common in wet upper lowland to subhumid zone (Table ).
Based on the system characteristics defined by the human activities performed in the area, such as income generating activities (i.e., off-farm and on-farm activities), the economic flow (i.e., the gross income generated per year) and the energy flows generated (in the case of agricultural activities), Siciliano (Citation2012) analyzed and determined the land-use change. At the same time, what the system did in labor productivity, energy use and human activity per unit of land obtained was combined as an information to explain multidimensional indicators (Siciliano, Citation2012). Time and land variables distributed for a particular purpose between several working and non-working activities, and land-use patterns, which are sequentially associated with different economic and energy performances (Pastore, Giampietro, & Ji, Citation1999).
The main elements of natural resource and asset the agrarian metabolism encompass are agroecosystems (land in the broad sense: soil, water, biodiversity etc.) and domesticated livestock, which when managed by humans, process external energy, materials and information to produce biomass that, in turn, provides a flow that feeds other dissipative structures of social metabolism (Casado & de Molina, Citation2017). The human population living within the territorial limits of a given society should, therefore, be considered the processor of the energy, materials and information required to produce work and assets.
The variability observed in the production system in the crop types in the present study could probably be associated with the area (ha) coverage of the respective crop that could also be associated with the income generated per year (Amejo et al., Citation2018a), whereas factors like the farm size, agroecology, soil condition and types, climatic and crops disease situation, weed invasion and management and seasons may determine farming situation sizeably. The form of diversity, the role in food, income and feed, plot size and scale of production and intra-seasonal base production system in bi-modal rainfall could be a possible suggestion for the largest LULC area particularly in the annual crops. In relationships to the land use, crops like groundnut, potato, cabbage, garlic, coffee and the apple fruits in one system could supposedly be as important as that of maize, tef, wheat, banana etc. in some other system (e.g., Amejo et al., Citation2018a).
Another study demonstrated that the land fragmentation is the result of several processes (including social, cultural, economic, physical and operational processes), working either together or independently (Kalantari & Abdollahzadeh, Citation2008). According to Ruthenberg (Citation1971), farming within each system is carried out in holdings, which are more or less distinct managerial units. Land fragmentation factors calculated by linear regression model indicated that the household average annual income, per capita arable land, size of land rented by household, labor force of household, family size, number of crops planted by household and size of land rented out were contributed to the land fragmentation (Kalantari & Abdollahzadeh, Citation2008). Moreover, Fernández-Rivera et al. (Citation2004), for example, within the three crop–livestock subclasses defined 13 systems based on the dominant crops such as maize-sorghum-livestock and cassava-yam-livestock in West Africa.
Swanepoel et al. (Citation2010) suggested the institution, market and policy-related constraints need to be identified and tackled along with technical constraints. Transportation, infrastructure, market and institutions are critical for establishing efficient markets but are often severely lacking in livestock-raising areas (Pica-Ciamarra, Citation2005). In another study, integrated crop–livestock systems can guarantee the sustainable intensification of agriculture, promoting increased production of foods, fibers and energy, associated with the promotion of ecosystem services, where the adoption of integrated crop–livestock systems depends on the availability of information regarding the agronomical and economic potential, the market demands and the existence of governmental policies for sustainable development (Moraes, Carvalho, Lustosa, Lang, & Deiss, Citation2014).
4. Conclusions
This study was carried out to perform a farming system classification taking into account agroecology, dominant crop and livestock types in land-use system, elevation and landscape slope influence on production system, marketing situation and the specific functional role of farm enterprise in income and land-use efficiency.
The difference observed in components and elements of the crop and livestock type in similar agroecology but different location, probably due to distance in location, social and institutional situation, and market accesses in position, or the existence of slight manipulation in the system (soil, on farmer awareness etc.). This variation gives an opportunity for intervention by identifying similar features reflected between the farming systems. The major difference associated could essentially be with a difference in agroecological conditions and the locations of the farm households from the marketing center to dispose of supplies and the demand. The concluding remarks of this study to determine system intensification, food nutrition security and for poverty reduction based on existing resources, assets as well as constraints of the study households are primarily laid in three basic options. First, positively manipulating farm level operational problems such as soil, weather variability challenges (drought and wet stress), animal and crop diseases, access and availability of farm inputs etc. Second, sparing land-use system in an area where staple food crop occupied the largest share in purpose to diversify production systems. Third, establishing roads, infrastructure and regular social organization in a way to establish and maintain sustainable food flow from producers to consumer to benefit both groups.
The framework of the study, therefore, based on multilevel (household, village levels and AEZ) and integrated farming system, environmental and social aspects. The land-use scenarios are the indicators to the local economic, environmental and social policy goals. The environmental policy objective in the area of the study refers to the opportunity and challenge in relationships and difference in AEZ based on elevation range and landscape slope, and possibility to environmental degradation in high slope area particularly in wet upper lowland to subhumid zone. The main socioeconomic targets aim at improving the productivity of the agricultural sector, enhancing the diversification of the rural economy and creating the rural–urban linkage. The situation could be very pessimistic to the highland households without significant development support.
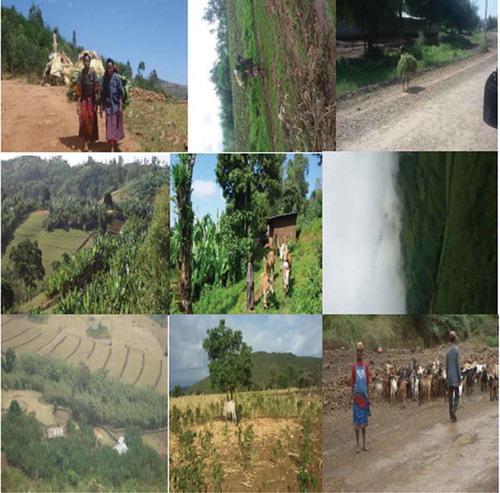
Cover Image
Photo obtained during field survey (2014–2016) from different farm systems in the study area in Dawuro and Gamo Gofa zone.
Acknowledgments
This work supported by from the German Academic Exchange Service (DAAD) with funds of the Federal Ministry for Economic Cooperation and Development (BMZ) of Germany provided by Food Security Center (FSC) of Hohenheim University.
Additional information
Notes on contributors
Asrat Guja Amejo
Asrat Guja Amejo is a PhD student in Animal Production and working as a lecturer at Arba Minch University, Ethiopia. He was attended as a visiting scientist in University of Hohenheim, Germany. He was participated for an international course on Agriculture in Transition at CDI, Wageningen UR, The Netherlands. Asrat is currently working on his PhD study research on crop-livestock production system and the impact of climate change in the farming systems. His research interest is crop-livestock systems, climate change, and agroecological system with visions in global/local and for science.
Yoseph Mekasha Gebere
Dr. Yoseph Mekasha Gebere obtained his PhD in Animal Sciences from the Swedish University of Agricultural Science.
Habtemariam Kassa
Dr. Habtemariam Kassa obtained his PhD in Rural Development Studies from the Swedish University of Agricultural Sciences.
Tamado Tana
Prof. Tamado Tana (PhD) field of specialization is Agronomy/crop Ecology and his Research interest includes Agronomy, Cropping Systems, Crop Modeling, Weed Ecology and Management.
References
- Amejo, A. G. (2018). Mapping soil terrain resources and descriptions of agro-ecological zone in Dawuro and Gamo Gofa zones in south-western Ethiopia. Journal of Soil Science and Environmental Management, 9(10), 164–17. doi:10.5897/JSSEM2018.0695
- Amejo, A. G., Gebere, Y. M., Kassa, H., & Tana, T. (2018a). Agricultural productivity, land use and draught animal power formula derived from mixed crop-livestock systems in Southwestern Ethiopia. African Journal of Agricultural Research, 13(42), 2362–2381. doi:10.5897/AJAR2018.13258
- Amejo, A. G., Gebere, Y. M., Kassa, H., & Tana, T. (2018b). Comparative analysis of climate change impact on livestock in relation to biomass base feed availability using standardized precipitation index in south-western Ethiopia. International Journal of Livestock Production, 9(7), 184–191.
- Behera, U. K., Yates, C. M., Kebreab, E., & France, J. (2008). Farming systems methodology for efficient resource management at the farm level: A review from an Indian perspective. The Journal of Agricultural Science, 146(5), 493–505. doi:10.1017/S0021859608007995
- Casado, G. I. G., & de Molina, M. G. (2017). Energy in agroecosystems: A tool for assessing sustainability. CRC Press.
- Central Statistical Agency of Ethiopia. (2013). Population projection of Ethiopia for all regions at wereda level from 2014–2017. Retrieved from www.csa.gov.et.
- Central Statistical Agency of Ethiopia. (2016). The Federal Democratic Republic of Ethiopia Central Statistical Agency Agricultural sample survey 2015/16 [2008 E.C.]. Report on area, production and farm management practice of belg season crops for private peasant holdings, Vol. 5. Statistical bulletin 578 (pp. 24–31), Addis Ababa, Ethiopia. Retrieved from http://www.gatefarms.com. pdf
- Dove, C. K. (1890). Kulturzonen von Nord-Abessinien. Petermann’s Geographische Mitteilungen, Ergaenzungsheft (pp. 97).
- Erenstein, O. (2007). Crop-livestock interactions and livelihoods in the Indo-Gangetic Plains, India: A regional synthesis. CIMMYT.
- Ethiopia. (2015). The population of all Ethiopian all cities and towns with more than 20,000 inhabitants according to census results and latest official projections. Retrieved from www.citypopulation.de
- Ethiopia & Headquarters of World Food Program. (2014). Comprehensive food security and vulnerability analysis (CFSVA). Retrieved from http://www.wfp.org/food-security.pdf
- FAO/IIASA/ISRIC/ISS-CAS/JRC. (2012). Harmonized world soil database (version 1.2). Laxenburg, Austria: FAO, Rome, Italy and IIASA.
- Fernández-Rivera, S., Okike, I., Manyong, V., Williams, T. O., Kruska, R. L., & Tarawali, S. A. (2004). Classification and description of the major farming systems incorporating ruminant livestock in West Africa. In Sustainable crop–livestock production for improved livelihoods and natural resources management in West Africa. Proceedings of an international conference held at IITA, Ibadan, Nigeria.
- Foley, J. A., Ramankutty, N., Brauman, K. A., Cassidy, E. S., Gerber, J. S., Johnston, M., … Balzer, C. (2011). Solutions for a cultivated planet. Nature, 478(7369), 337. doi:10.1038/nature10452
- Garrett, R. D., Niles, M., Gil, J., Dy, P., Reis, J., & Valentim, J. (2017). Policies for reintegrating crop and livestock systems: A comparative analysis. Sustainability, 9(3), 473. doi:10.3390/su9030473
- Geographic CRC. (2015). Summary of projected coordinate reference systems. EPSG geodetic parameters. International Association of. Oil and Gas Producers. 8.6 data set version. Retrived from gvsig.org/pdf
- Hepelwa, A. (2010). Environmental and socioeconomic factors influencing crop cultivation. An application of Multivariate Discriminant Analysis (MDA) model in Sigi catchment, Tanzania. Retrieved from cerdi.org/uploads/sfCmsContent/html/323/Hepelwa.pdf
- Herrero, M., González-Estrada, E., Thornton, P. K., & Hoogenboom, G. (2005). Impact: Integrated modelling platform for mixed animal-crop systems: User’s manual. ILRI (aka ILCA and ILRAD). Retrieved from https://cgspace.cgiar.org/bitstream/handle/10568/1214/Impact.pdf
- Herrero, M., González-Estrada, E., Thornton, P. K., Quiros, C., Waithaka, M. M., Ruiz, R., & Hoogenboom, G. (2007). IMPACT: Generic household-level databases and diagnostics tools for integrated crop-livestock systems analysis. Agricultural Systems, 92(1), 240–265. doi:10.1016/j.agsy.2006.03.008
- Herrero, M., Thornton, P. K., Notenbaert, A. M. O., Msangi, S., Wood, S., Kruska, R. L., … Li, X. (2010). Drivers of change in crop-livestock systems and their potential impacts on agro-ecosystems services and human well-being to 2030. Retrieved from https://www.slideshare.net/ILRI
- Hurni, H. (1998). Agroecological belts of Ethiopia. Explanatory Notes on Three Maps at a Scale of, 1(1,000,000). Soil conservation research program of Ethiopia, Addis Ababa, Ethiopia, 31.
- Kalantari, K., & Abdollahzadeh, G. (2008). Factors affecting agricultural land fragmentation in Iran: A case study of Ramjerd Sub District in Fars Province. American Journal of Agricultural and Biological Science, 3(1), 358–363. doi:10.3844/ajabssp.2008.358.363
- Kremen, C., Iles, A., & Bacon, C. (2012). Diversified farming systems: An agroecological, systems-based alternative to modern industrial agriculture. Ecology and Society, 17(4). doi:10.5751/ES-05103-170444
- Lemaire, G., Franzluebbers, A., de Faccio Carvalho, P. C., & Dedieu, B. (2014). Integrated crop–Livestock systems: Strategies to achieve synergy between agricultural production and environmental quality. Agriculture, Ecosystems & Environment, 190, 4–8. doi:10.1016/j.agee.2013.08.009
- Littell, R. C., Milliken, G. A., Stroup, W. W., Wolfinger, R. D., & Schabenberger, O. (2006). SAS for mixed models (2nd ed). Cary, NC: SAS Institute Inc.
- Ministry of Agriculture, Ethiopia. (2000). Agroecological zonations of Ethiopia. Ethiopia: Addis Ababa.
- Moraes, A. D., Carvalho, P. C. D. F., Lustosa, S. B. C., Lang, C. R., & Deiss, L. (2014). Research on integrated crop-livestock systems in Brazil. Revista Ciência Agronômica, 45(5SPE), 1024–1031. Retrieved from https://www.scielo.br
- Mullen, R. S., & Birkeland, K. W. (2008). Mixed effect and spatial correlation models for analyzing a regional spatial dataset. Proceedings of the 2008 International Snow Science Workshop (pp. 421–425). Whistler, British Columbia.
- Naylor, R., Steinfeld, H., Falcon, W., Galloway, J., Smil, V., Bradford, E., … Mooney, H. (2005). Losing the links between livestock and land. Science, 310(5754), 1621–1622. doi:10.1126/science.1117856
- Nijbroek, R. P., & Andelman, S. J. (2016). Regional suitability for agricultural intensification: A spatial analysis of the Southern agricultural growth corridor of Tanzania. International Journal of Agricultural Sustainability, 14(2), 231–247. Retrieved from http://www.tandfonline.com/loi/tags20
- Notenbaert, A. M. O., Herrero, M., Kruska, R. L., You, L., Wood, S., Thornton, P. K., & Omolo, A. (2009). Classifying livestock production systems for targeting agricultural research and development in a rapidly changing world. Retrieved from cgspace.cgiar.org
- Pastore, G., Giampietro, M., & Ji, L. (1999). Conventional and land-time budget analysis of rural villages in Hubei province, China. Critical Reviews in Plant Sciences, 18(3), 331–357. doi:10.1080/07352689991309252
- Pica-Ciamarra, U. (2005). Livestock policies for poverty alleviation: Theory and practical evidence from Africa, Asia and Latin America. Rome: FAO Pro-Poor Livestock Policy Initiative. FAO. Retrieved from http://www. fao. org/ag/againfo/projects/en/pplpi/docarc/wp27. pdf
- Rufino, M. C. (2008). Quantifying the contribution of crop-livestock integration to African farming. Retrieved from library.wur.nl
- Ruthenberg, H. (1971). Farming systems in the tropics. Oxford: Clarendon Press.
- Siciliano, G. (2012). Urbanization strategies, rural development and land use changes in China: A multiple-level integrated assessment. Land Use Policy, 29(1), 165–178. doi:10.1016/j.landusepol.2011.06.003
- Stroebel, A., Swanepoel, F. J. C., & Pell, A. N. (2011). Sustainable smallholder livestock systems: A case study of Limpopo Province, South Africa. Livestock Science, 139(1), 186–190. doi:10.1016/j.livsci.2011.03.004
- Swanepoel, F., Stroebel, A., & Moyo, S. (2010). The role of livestock in developing communities: Enhancing multifunctionality. Cape Town: University of the Free State and Technical Centre for Agricultural and Rural Cooperation. Retrieved from https://www.cgiar.org
- Tarawali, S., Herrero, M., Descheemaeker, K., Grings, E., & Blümmel, M. (2011). Pathways for sustainable development of mixed crop livestock systems: Taking a livestock and pro-poor approach. Livestock Science, 139(1), 11–21. doi:10.1016/j.livsci.2011.03.003
- West, B. T., Welch, K. B., & Galecki, A. T. (2014). Linear mixed models: A practical guide using statistical software. Chapman and Hall/CRC.
- Yao, R., Yang, J., Wu, D., Xie, W., Gao, P., & Jin, W. (2016). Digital mapping of soil salinity and crop yield across a coastal agricultural landscape using repeated electromagnetic induction (EMI) surveys. PloS one, 11(5), e0153377. doi:10.1371/journal.pone.0153377