
Abstract
The study was conducted in Gozamen district, East Gojjam Zone, and Amhara Region, Ethiopia, from September 2017 to July 2018 to characterize the marketing system and market structure and conduct, to the impacts of domestic honey marketing system on export marketing, and to identify the major opportunities and challenges of honey marketing. Questionnaires for the survey and market concentration ratio and traders’ behavior for market structure and conduct were employed. A total of 25 honey traders (18 males and 7 females) were interviewed for the survey. The survey data were analyzed using SPSS version 23, whereas market structure and conduct framework was employed to evaluate the honey market chain. Market concentration ratio showed that the market structure was a moderately concentrated and weak oligopoly market (CR4 = 47.1%). Moreover, this study revealed that the domestic price at different market points is higher than the export price, indicating the impact of domestic honey marketing on export marketing. As a result, establishing legal honey marketing framework and regulatory measures are indispensable tasks to establish healthy honey marketing system in the study area.
PUBLIC INTEREST STATEMENT
Ethiopia is currently producing 47,706 tons in general and 11,118.25 tons of honey in particular at Amhara region, has good potential to produce honey and beeswax, CSA (Citation2016–2017). There are also an estimated 5.15 million beehives which are managed with approximately about 1.7 million smallholder beekeepers. There are different honey market channels where by many market actors were involved in the honey marketing system.
The smallholder beekeepers and the local consumers in particular and the country in general are not benefited from the potential as of expected. The different honey market actors involved in honey trading contribute to the increasing trend of honey market price from year to year. This study revealed that the domestic price at different market points is higher than export price indicating the impact of domestic honey marketing on export marketing. Thus, the study will be used as an input for policy makers in establishing legal honey marketing framework and regulatory measures, which will be beneficial to the healthy honey marketing system.
1. Introduction
The estimated amount of honey produced in Ethiopia by the year 2016/2017 was about 47,706 tons, whereas the exported amount of honey by the same year was only about 444 tons which represents less than 1% (CSA, Citation2016–2017; CitationERCA [Ethiopian Revenue and Custom Authority], 2008-2016). The Amhara Regional State has 1.36 million (23.2%) colonies and produced 11,118.25 tons (26.2%) of honey. Most of the beekeeping practice in East Gojjam Zone is dominated by backyard beekeeping using traditional beehives. There are about 181,093 bee colonies in the zone, of which about 165,505 (91.4%), 3,525 (1.9 %), and 12,063 (6.7%) are managed in traditional, intermediate, and frame beehives, respectively (CSA, Citation2016–2017).
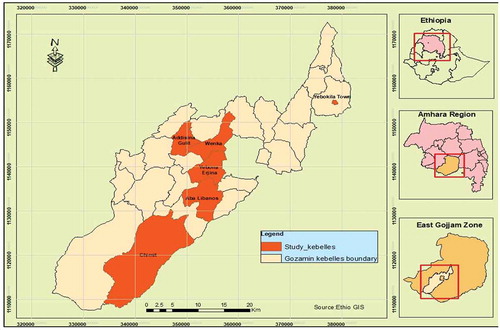
Figure 1. Geographical location of Gozamen district.
Ethiopia has a strong domestic honey market. The structure and conduct of honey market have a direct implication for the nature of production, price relationships between different marketing levels, and the direction of causality. The honey market structure, conduct, and performance analytical model was used by different researchers on how the behavior of honey sellers and buyers affects the honey market and made a relationship between them. Different studies (Assefa Abebe, Citation2009; Kassa Tarekegn, Citation2017; Samuel, Citation2014; Tizazu Toma, Tegegn, & Zemedu, Citation2017) in Wemberta district (Tigray Regional State), Chena district, Soddo Zaria district and Shebedino district (SNNPR), respectively, have been conducted to analyze the market framework of honey in different regions of Ethiopia.
In Ethiopia, there are about 20 companies exporting honey to different countries like Sudan, Djibouti, Yemen, Norway, Germany, and others. Zembaba Bee Products Development and Marketing Cooperative Union (ZBPDMCUs) is the first commodity-specific and specialized union in Amhara Region. According to the data obtained from Ethiopian Revenue and Custom Authority, ZBPDMCUs exported only about 20.07 tons of honey and earned 66,220 USD by the year 2015/2016. In the study area, currently, we could not find documented information on what exactly the marketing system looks like, the structure of the market, market actors, and market conduct and its impact on both local and export markets to encourage and enrich the efforts. Therefore, we found and believed that studying and understanding the status of honey marketing structureand conduct belonging to the study area produce in a holistic manner along the market value chain is an immense important regional activity at the moment.
1.1. Objectives
To characterize the honey marketing system, market structure, and conduct and identify market participants in the study area,
To pinpoint the impacts of the honey marketing system and domestic market price on the export market, and
To identify the major opportunities and challenges of domestic and export honey marketing in the study area.
2. Materials and methods
2.1. Description of the study area
The study has been conducted in Gozamen district of East Gojjam Zone in Amhara National Regional State (ANRS). The district has 25 rural kebeles, of which 17, 5, and 3 kebeles are midland, highland, and lowland, respectively (Figure ). For the survey of the honey traders, primary data were collected from all traders (25 traders) which were found in Debre Markos town (city of the district and the zone).
2.2. Study design and data management
All honey traders found in the study area have been considered for the survey. Data on honey purchasing and selling prices for the last five consecutive years were also collected from honey traders and honey farmers cooperative in order to examine the marketing system, market price, and their impact on the export market.
In this study, primary and secondary data were used as a source of data. Data from primary sources (all honey traders) were arranged and coded using Microsoft Excel and the statistical package for Social Science (SPSS) Version 23 software. However, simple descriptive statistics and General Linear Model (GLM) were used as a statistical analysis based on the type of variable and information obtained from the survey. Market and conduct (S-C) model was used by computing and analyzing market concentration ratio and behavior and conduct of the honey market structure.
3. Results and discussion
3.1. Demographic characteristics of honey traders in Gozamen district
In this study, we found that 72% and 28% of the traders interviewed were male and female headed, respectively. However, the study confirmed that the participation of females in honey trade was very much better than those engaged in honey production. This elucidates that honey trading as a business is a better practice than honey production by both male and female groups. All traders in the study area, we contacted, were working with two types of licenses. Accordingly, we understood that 56% of them were working with honey and butter retailers’ licenses that are found along the main road from Addis to Bahir Dar and close to the bus station. However, 44% were those working with honey retailers’ license found at the main market place closer to the honey market (Table ).
Table 1. Trade license, age, educational level, and marital status of honey traders
On the other hand, data revealed that Orthodox Christian was the dominant religion in the study area. With regard to the status of interviewed traders, 88% of them were married, and the rest 12% were single. Moreover, 84% of the respondent honey traders were literate (grade 5 and above), and only 16% were literate less than grade 5 education. This indicates that education enabled all the traders to understand the basic activities that business requires including access to relevant market information for better results.
3.2. Domestic and export honey marketing
3.2.1. Farm gate crude honey marketing practice
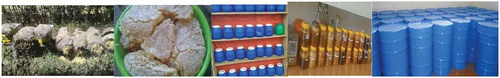
In the study district, data confirmed that the majority of honey produced (62.5%) went to the market for sale in different forms, being the most common is comb honey (Figure ) and crushed honey (Figure ). Most importantly, producers were selling their honey as comb honey to develop trust against adulteration and due to consumers’ preference.
Figure 2. Comb honey at the farm gate.
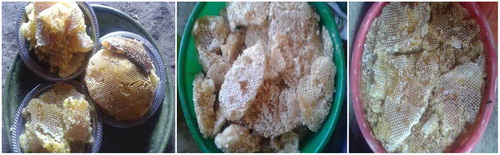
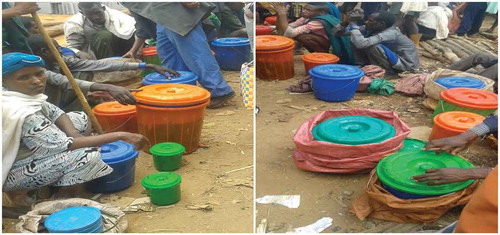
Figure 3. Debre Markos honey market place.
In spite of the fact that honey producers offered comb honey to the market for the above-established reasons, a small volume of semi-processed (extracted/strained) honey was also provided in the market, with relatively cheaper price than comb honey, which is more preferred by honey retailers. On the other hand, semi-processed honey does not have pronounced demand by cooperatives (including Tseday bee products development and marketing cooperative) and other interested groups due to low/no chance to get beeswax as an additional value.
Generally, it was confirmed that the overall mean selling price of crude honey at farm gate varies from year to year and types of honey. In the study area, the mean crude honey price has elevated from 47.32 Birr per kilogram in 2012/2013 to 116.08 Birr per kilogram in 2016/2017. According to our data and based on consumers’ preferences, within and between years, farm gate price of crude yellow-colored honey (mostly harvested from September to late November) was relatively better than white-colored honey (mostly harvested in late April and May). Moreover, data confirmed that the price of honey strongly increases as supply decreases during the non-harvesting season than prices during the main honey flow season.
The selling price of crude honey at farm gate varies from year to year and also among honey types. The average mean selling price of white and yellow comb honey per kilogram has been increased from 42.13 ± 1.43 and 52.51 ± 1.43 Birr in 2012/2013 up to 108.83 ± 1.43 and 123.14 ± 1.43 Birr (Table ). The mean price per kilogram of both white and yellow comb honey was significantly different at p < 0.05 for different years, but the mean price per kilogram is not significantly different at p > 0.05 for white honey between 2013/2014 and 2014/2015 years. The difference in price might be attributed to consumers’ preference to yellow honey than white honey.
Table 2. Trends in crude honey selling price at farm gate from 2013 to 2017
3.2.2. Reatailors’ honey marketing
Out of the total of 25 licensed honey retailers, 21 were purchasing comb honey from producers found in the district and the others from neighboring districts like Machakel, D/Elias, Aneded, and others. The purchasing and selling price of honey traders varied from year to year and based on the color of the honey. The mean purchasing price of white and yellow comb honey per kilogram has been increased from 49.69 and 59 Birr in 2012/2013 to 95.58 and 97.2 Birr, respectively. Moreover, the selling price of white and yellow comb honey has also increased from 66.75 and 75 Birr to 108 and 122.80 Birr within the same period of time (Table ).
Table 3. Honey traders' purchasing and selling price (Birr/kg)
There is a significant difference (p < 0.05) in the mean price of honey per kilogram from year to year and also between the color of honey, yellow comb honey fetching the better price. This significant difference in purchasing and selling price of honey might be attributed to the increase in consumption habit of natural products like honey and the consumers’ preference for honey color.
3.3. Tseday’s BPDMC honey marketing
Tseday Bee Products Development and Marketing Cooperative (BPDMC) is an active cooperative based at Debre Markos town, which was established in 2006 with an initial capital of 30,170.45 Birr and 128 members (127 males and 1 female). Currently, this study has found out that members of the cooperative have increased from 128 to 335 (296 males and 39 females) with an increased working capital of 333,233.48 Birr, indicating that marketing in honey is promising for income generation.
The cooperative was collecting comb honey harvested from traditional hives of both member and non-member beekeepers with the same price. Then, the cooperative Tseday BPDMC was removing impurities from the comb honey, and comb honey was crushed to make suitable for heat processing using differently sized cooking pans and plastic jars. In this process, respondents told that plastic jar with crushed honey is placed on a preheated water-containing cooking pan for 35 min with continuous stirring up until beeswax and other impurities (like dead bees, brood, pollen, and darken comb) float and filtered to get liquid honey without beeswax and impurities (Figure ).
Figure 4. Honey heat processing.
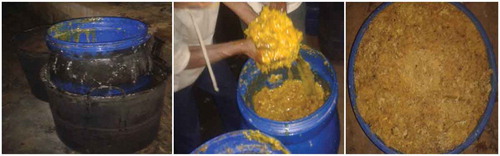
The collected beeswax and other impurities could be used to prepare a local drink called “birz” in which a glass of “birz” costs up to 2.0 Birr. The final residue in the process could be heated further at a temperature of 60–70°C and strained to collect purified beeswax. In general, interviewed cooperative members have indicated that a total of 72 and 22 kg of strained honey and beeswax could be collected from 100 kg of crushed honey with a maximum of 1.5 kg wasted honey in the process. However, the use of elevated heat in honey processing has been complained for wastages and affecting the quality of honey due to uncontrolled heating system used during processing.
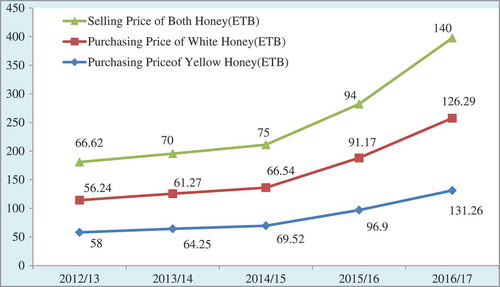
In the study area, the price difference was observed based on the honey types. Accordingly, the yellow honey, collected during the main flow season, fetches a relatively better price than white honey which is harvested during the short honey flow season (late April and May). More specifically, the mean purchasing price of comb honey has risen from 57.12 Birr per kilogram in 2012/2013 to 128.78 Birr per kilogram in 2016/2017 (Figure ). Furthermore, it has been indicated that the domestic price of honey was dramatically increased at an increasing rate due to exponentially increased domestic demand (EPOPA, Citation2006).
Figure 5. Tseday BPDMC honey purchasing and selling price (2013–2017).
3.3.1. Trends of honey domestic and export market price
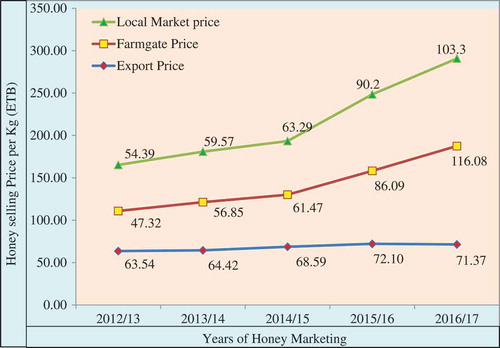
The domestic market, as a matter of fact, has been more profitable to producers than the international market. There exists a price difference between local market, farm gate, and export market. The export price of honey per kilogram was higher than the domestic prices (farm gate and market price) from 2012/2013 up to 2014/2015. During 2012/2013, the average price of honey per kilogram at the farm gate was 47.32 Birr and at Debre Markos market was 54.39 Birr. During the same year, the export price per kilogram of honey was 63.54 Birr which shows that the export price was higher than the other two (farm gate and local market). But, since 2015/2016, there was a higher domestic market price than the export price. The average price per kilogram of comb honey at the domestic market in 2015/2016 was 86.09 and 90.2 ETB for farm gate and local market, respectively, whereas the average export price was 68.59 ETB (Figure ). This indicated that the domestic price was more profitable than the international market, and the domestic honey price has an impact on the export honey market.
Figure 6. Trend of farm gate, local, and export honey price.
Beekeepers are the first actors who are accountable for honey production. The beekeepers harvest comb honey and sell the comb/crushed comb honey mostly to consumers, retailers, and cooperatives. Sometimes, there are also village honey collectors who buy honey from the beekeepers. These village collectors collect honey at the farm gate or local market near the beekeepers in some kebeles which are far from Debre Markos market.
Retailers most of whom are established along the main road from Addis Ababa to Bahir Dar maintained a long-term relationship with consumers from other areas and also with big retailers from Addis Ababa (Merkato). Some of the retailers processed honey before selling to big retailers, Tej house, and consumers, while others sold comb honey. In spite of the fact that retailers bought comb honey from producers, consumers/end users claim retailers in adulterating honey and even seek high profits as they determine the price.
3.4. Identified honey market channel in Gozamin district
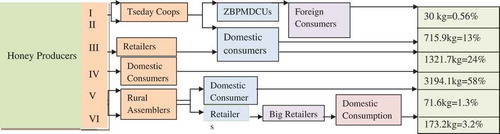
The main honey market channels in the district have been identified to be six, and honey follows the six main routes from the point of its production to its consumption or final destination. Producers, rural assemblers, retailers, big retailers, cooperatives, tej houses, exporters, and consumers were identified as the market chain actors in the study area.
Beekeepers are the first actors who are accountable for honey production. The beekeepers harvest comb honey and sell the comb/crushed comb honey mostly to consumers, retailers, and cooperatives. Sometimes, there are also village honey collectors who buy honey from the beekeepers. These village collectors collect honey at the farm gate or local market near the beekeepers in some kebeles which are far from Debre Markos market. Retailers most of whom are established along the main road from Addis Ababa to Bahir Dar maintained a long-term relationship with consumers from other areas and also with big retailers from Addis Ababa (Merkato). Some of the retailers processed honey before selling to big retailers, tej house, and consumers, while others sold comb honey. In spite of the fact that retailers bought comb honey from producers, consumers/end users claim retailers in adulterating honey and even seek high profits as they determine the price.
Tseday Bee Products Marketing and Development Cooperative collets quality comb honey, processes, and sells to consumers. The cooperative obtained income Tseday BPDMC from selling of beeswax obtained from honey processing. It also sells honey to Zembaba Union, and then, the union further processes, packs, and exports in bulk and also sold to the domestic market. A very small amount of honey goes from beekeepers to tej houses through retailers/rural assemblers and also from producers directly to big retailers and was not considered in this study.
The estimated total amount of honey produced from sampled households by the year 2016/2017 was 5,507 kg, of which 58% of its share was carried out by channel IV. Similarly, channel III and channel II took the second and third largest share of honey flow accounting for 24% and 13%, respectively (Figure ). Therefore, channels II and IV together accounts for about 71% of the total honey flow, and this indicates that the flow of honey market in the study area is concentrated on these channels. It can also be said that channels II and IV are the most advantageous honey market channels for honey producers; both channels make producers gain a collective bargaining power and also help them get a fair market price. This result is in agreement with Assefa Abebe (Citation2009) which has indicated that the channel from producers to consumers was the main route for honey marketing. However, this study was not concurrent with the study conducted by Samuel (Citation2014) which has indicated that more honey has been mobilized on rural assembler, wholesaler, and processor.
Figure 7. Honey market channel actors and their share.
3.5. Structure and conduct of the honey market
3.5.1. Honey market structure
In the study area, the honey market structure has been described by using concentration ratio and barriers to entry (capital requirement, experience, and licensing procedure).
3.5.1.1. Concentration ratio
For the purpose of analyzing honey market structure in the study area, market concentration ratio has been calculated and expressed in terms of CRx which represented the percentage of marketed honey controlled by the largest X firms. It was computed by taking the total annual volume of honey purchased by sampled honey traders in 2016/2017.
In Gozamen district, there were 25 honey traders, of which 23 retailers (21 of them purchased honey from honey producers of the district). Moreover, two retailers purchased honey from other district market retailers in addition to producers in the study district and are considered to calculate concentration ratio, and the rest two have purchased honey from rural assemblers. For those who purchased honey from other district retailers (assemblers), only the honey quantity purchased from the study district was under consideration. Due to this fact, the degree of market concentration was analyzed based on the amount of comb honey directly purchased from honey producers by those 23 honey retailers in 2016/2017.
The CR4 measures of market concentration ratio revealed that the four top traders from the total of 23 traders (17.4%) of the traders have controlled 47.1% of the honey market in 2016/2017 (Table ). As the CR4 value is of between 33% and 50%, the honey market in Gozamen district was characterized as a weak oligopoly. Few honey retailers are slightly concentrated in the market, and they moderately compete for the product. This enables honey producers to receive a fair price for their honey produce. Different studies, Samuel (Citation2014) and Toma et al. (Citation2017), conducted at Sodo Zuria and Shebedino district of SNNPR showed the presence of strong oligopoly with CR4 value of 58.84% and 58.18%, respectively.
3.5.1.2. Barriers to entry into the honey market
The barriers to entry into the honey market are the factors that affect the relationship between existing traders and the potential entrants. These factors include licensing procedures, access to credit, market transparency, and experience in honey trading. If the number of these factors is limited, it will be easy for new traders to enter into the honey market and vice versa. In this study, the following factors are considered and discussed below.
3.6. Licensing procedure
In Gozamen district, trade and industry office played the role of licensing anyone who is interested to enter to start the honey trading. All the traders responded as the licensing procedure was easy, and all of them had a trade license. The trade licensing is of two types: honey retailers and both honey and butter retailers together. Out of the 25 honey traders, 14 and 11 of them had both honey and butter retailing and honey retailing only accounting for 56% and 44%, respectively (Table ).
Table 4. Honey traders' concentration ratio in Gozamen district
Table 5. Licensing procedures and access to credit and tax
There was no restriction imposed on unlicensed traders which created unfair honey price competition between licensed and unlicensed traders. These unlicensed traders are not clearly known with no defined and permanent working area and participated in the market as a honey producer. The licensed traders complain as the responsible department from District Trade and Market Development Office was not controlling the unlicensed traders and even no measure was taken whenever we expose them rather they fight with us why we gave information for the office. This indicated that even though the licensing procedure was simple, the presence of unlicensed traders who were not paying tax for the government created unfair price competition and discourages the licensed traders in Gozamen district.
3.7. Market transparency
Information about the current honey marketing enables the traders to decide when and which market to sell their honey. Adequate information is with regard to the competitors in the market, and information on the selling and buying prices and others are important.
In the study area, 14 traders (56%) have got market information, out of which 40% and 16% of them have got information about the market price and market requirements (quality standards), respectively (Table ). The honey traders have got information from friends of the nearby market, from other traders through mobile, and personal observation. This indicates that access to market information enables the traders to obtain better honey buying and selling prices.
Table 6. Market information and experience in honey trading
3.8. Experience in honey trading and access to credit
Access to credit and relevant knowledge and experience in business are important factors to be considered while starting a business. In the study area, out of a total of 25 honey traders, 21 honey traders (84%) and 4 traders (16%) were engaged in honey trading with a mean experience of 3 and 8 years, respectively. The overall mean of experience was about 4 years, implying the presence of new entrants into the honey business, and indicated that experience was one of the barriers to enter into the honey market.
Capital is also one of the entry requirements to start a business. In the study area, 72% of the respondents did not receive credit and unable to expand their scale of operations and only 18 received. Some of the traders who did not receive credit were not interested to get the credit due to the requirement of collateral and other complicated procedures. The result of the study revealed that a lack of capital hinders entry into honey trading.
Even though the licensing procedure was easy and the access to market information enabled the traders to enter into the honey market, the experience the traders engaged in the business, the inadequate access to capital, high tax, and inability to compete with unlicensed traders were identified to be the entry barriers to honey market in the study area. This result is aligned with Kassa Tarekegn (Citation2017) who has reported that a lack of capital hinders entry into honey trading.
3.8.1. Honey market conduct
Market conduct refers to the patterns of behavior of firms. The conduct of the honey market is analyzed in terms of the availability information about purchasing and selling strategies of producers and traders. In the study area, the honey market conduct can be explained in terms of the trading behavior of producers and traders.
3.8.1.1. Honey producers' market conduct
In the study area, most beekeepers (62.5%) harvested honey once a year, whereas 27.5% and 10% of them harvested honey twice and three times a year, respectively. Beekeepers managed bees and produced honey for the purpose of sale (62.5%) and for consumption and sale (28.5%), and the remaining 9% is for other purposes (4.2% for sale and gift, 2.5% for home consumption, and 2.5% for home consumption, sale, and gift) (Table ). Almost all respondents, except three, sold the honey produce in the market, and about 74.2% of the respondents replied that there is a high demand for honey in the market. The high demand for honey in the market leads to an increased price trend of comb honey which might attribute to the high-quality product supply in the local market by honey producers.
Table 7. Production and selling strategies of producers
The majority of the respondents (71.7%) never stored honey and sold the honey they produced as soon as they harvested. They sold most of their honey produce to Debre Markos market (70.8%) and to cooperative shop (Tseday cooperatives) covering (22.5%), traders’ shop (2.5%), and farm gate (1.7%) (Table ). About 97.5% of the respondents replied that there was an increasing trend in the price of honey for the last five years and forced to sell their produce before storing it looking for a better price.
3.8.1.2. Traders’ market conduct
In the study district, the rural assemblers, retailers, and big retailers (from Addis Ababa) were the main traders in the honey market. There were actually cooperatives and tej houses that were involved in the buying and selling activities of the honey market. About 84% of the respondent traders revealed that they buy honey when the purchase price is low (when there is high supply). Traders (52%) have mentioned that there was a honey supply problem by the year 2016/2017. The possible reasons for the short supply of honey were shortage of supply draught and use of agrochemicals (24%), price competition with unlicensed traders (16%), and shortage of capital to buy honey (12%). Traders buy honey from beekeepers (84%), village traders (8%) and other district traders (8%) from Debre Markos market (76%), other district markets (8%), and farm gate (16%). The marketing practice was carried out at Debre Markos market (60%) at collection centers (32%) and farm gate (8%) (Table ).
Table 8. Honey storage and selling practice of household respondents
With regard to the selling practice of honey traders, 88% of the respondents hold honey for their own home consumption, and the rest 12% sold all the honey they bought during 2016/2017 (Table ). Out of 21 traders, 68% of them attract their buyers by fair scaling (weighing), while 32% by providing a quality product. The respondents revealed that the price was determined through the market (56%) and through negotiation (36%). The remaining (8%) of the traders determine the market price by themselves (Table ).
Table 9. Honey buying practices of traders
Table 10. Traders' honey selling practice
Table 11. Major constraints of honey marketing for traders
3.8.2. Opportunities and constraints of honey marketing
In the study area, respondent traders were asked to identify the major constraints in honey marketing and rank the constraints as per their effects on the honey market value chain.Limited supply, seasonality of supply, application of agro-chemicals, competition with unlicensed traders, low quality of honey, lack of demand, high purchase price and credit access were ranked 1 st up to 8th constraints of honey production and marketing (Table ). In spite of the above constraints hindering honey production and marketing in the study area, there are also huge potentials and opportunities in the honey market value chain. Government attention to the apiculture subsector, an increasing trend in honey demand, increase in urbanization and purchase power of the consumers, improvement of transportation and other communications, and supply of comb honey to the market (for the honey quality) were some of the most common opportunities observed in the study area.
4. Conclusion and recommendations
Competition with unlicensed traders, honey trade experience, and lack of access to credit were barriers to enter into the honey market. Analysis of behaviors of honey producers and traders and market concentration showed that the market structure was moderately concentrated and is a weak oligopoly market.
Analysis of purchasing and selling price of honey at different honey market points revealed that the domestic honey price is higher than the export price which could be an indication for the local marking system and market price have an impact on honey export performance of the country.
In spite of the higher domestic market price of comb honey than export price, the practice of supplying comb honey in the domestic market is encouraging mainly with respect to honey quality. The market actors like Tseday Bee Products Development and Marketing Cooperative should add value (process, pack, label, etc.) to the honey and compromise the price increment than adulterating it.
Competing Interests
The authors declare no competing interests.
Cover image
1. Honey production at the backyard
2. Crude honey from the beekeeper
3. Honey for consumers in plastic jars
4. Honey for retail shops
5. Honey for export under in bulk tank
Acknowledgments
I am grateful to Gozamin District animal science and apiculture experts for collecting the data and for their close supervision during data collection. In addition, I extend my acknowledgement to Kebele Development agents and my friends Amare Mekonnen (for availing motor cycle transportation) and Eshetu Worku (for developing study map). Most importantly, I would like to express my heartfelt thanks for my wife, Simegn Ketema, our first born Markon Sileshi and Maranata Ketema for their patience and encouragements. The last but not least thank goes to to my brothers, Semahegn and Melkamu for their moral support and advice during my study.
Additional information
Funding
Notes on contributors
Sileshi Yeserah
The author was born from his father Yeserah Ademe and his mother Yizengash Salehudires on March 14/1983 in Debre Elias District He completed his elementary and primary education at Tigle Fire and high school at Amanuel. He then joined Hawassa University and studied BSc. Degree in Animal Production and Range Land Management and graduated in 2005.
He has been worked at D/Elias district as a beekeeping technician for three years. Then, he worked as livestock officer at ADSWE for two years. He then joined Ethiopian Meat and Dairy Industry Development Institute and worked as a dairy technologist for three years and is currently working as team leader in honey and beeswax processing directorate.
Moreover; he has studied BSc. Degree in civil engineering from AASTU. He has studied and graduated MSc degree in Apiculture from Bahir Dar University on 2018. He has got married and has one lovely son, Markonal Sileshi.
References
- Abebe, A. (2009). Market chain analysis of honey production: In Atsbi Wemberta District, Eastern Zone of Tigray national regional state (M.Sc.Thesis). Haramaya University, College of Agriculture Department of Agricultural Economics, Haramaya, Ethiopia,85pp
- ANRS BoFED. (2011). Amhara National Regional State (ANRS). Bureau of Finance and Economic Develpment (BoFED).
- CSA. (2016–2017). Agricultural Sample Survey 2016/17 [2009 E.C.] volume II: Report on Livestock and Livestock Characteristics (Private Peasant Holdings). Addis Ababa, Ethiopia: Author
- Desalegn, P. (2012). Ethiopian honey: Accessing international markets with inclusive business and sector development. Addis Abeba, Ethiopia.
- EPOPA. (2006). Export opportunities for African organic honey and beeswax: A survey of the markets in Germany, the United Kingdom, and the Netherlands. Retrieved from http://www.grolink.se/epopa/Publications/Market-studies/EPOPA_marketsurveyhoney-Mar 2017-web.pdf
- ERCA (Ethiopian Revenue and Custom Authority). (2008-2016). Annual report on honey export. Addis Ababa, Ethiopia
- Kassa Tarekegn, E. (2017). Structure and conduct of honey market in Chenan District,Kaffa Zone, Sothern Ethiopia.Bonga, Ethiopia: Bonga Agriculture Research Center. P.O.Box 1010.
- Samuel, S. (2014). Market chain anlysis of honey in Sodo Zuria District, Southern Ethiopia (M.Sc. Thesis). Haramaya University, Haramaya, Ethiopia.
- Shenkute, A. G., Getachew, Y., Assefa, D., Adgaba, N., Ganga, G., & Abebe, W. (2012). Honey production systems (Apis mellifera L.) in Kaffa, Sheka and Bench-Maji zones of Ethiopia. Journal of Agricultural Extension and Rural Development, 4(19), 528–18. Retrieved from http://academicjournals.org/JAERD
- Tesfa, A., Ejigu, K., & Kebede, A. (2013). Assessment of current beekeeping management practice and honeybee floras of Western Amhara, Ethiopia. International Journal of Agriculture and Biosciences, 2(5), 196–201. Retrieved from http://www.ijagbio.com/pdf-files/volume-2-no-5-2013/196-201.pdf
- Toma, T., Tegegn, B., & Zemedu, L. (2017). The structure, conduct, performance analysis of honey market in Shebedino District. SNNPR, Ethiopia.
- Wisdom, M., Nzima, J. D., & Bonnet., K. (2014). Structure,conduct and performance of groud nuts markets in Northern and Central Malawi: Case studies of Mzimba and Kasungu districts. International Journal of Business and Social Sciences, 5(6), 130–139.
- Yadeta, G. L. (2014). Review of progress in Ethiopian honey production and marketing. Holeta Bee Research Center (HBRC), Holeta, Ethiopia. P.o.Box 22.