
 ?Mathematical formulae have been encoded as MathML and are displayed in this HTML version using MathJax in order to improve their display. Uncheck the box to turn MathJax off. This feature requires Javascript. Click on a formula to zoom.
Abstract
The purpose of the study was to determine the qualities of edible cotton, peanut and soybean seed oils, and predict their shelf stability using the accelerated shelf-life testing method. Fatty acid profiles were determined by GC-MS as methyl esters and results revealed that the predominant fatty acid in edible soybean and cottonseed oils were linoleic acid 42.8% and 41.6%, respectively. While oleic acid (46.3%) was the major fatty acid in edible peanut oil. Peroxides formation was monitored for six successive weeks and data collected were used to model the deterioration mechanism. Accordingly, the model that best fitted the experimental data corresponds to a zero order kinetic model for all edible oil investigated. Arrhenius relation was applied to model the effect of temperature on the rate constant of peroxide formation. Combining the kinetic model identified and the rate constant model equation that could help to predict the shelf-life of oils studied at any temperature was developed. Based on this, the shelf-life of the domestic edible oils was determined at room temperature and amounts 36.9, 42.1 and 37.8 weeks for soybean, peanut and cottonseed oils, respectively.
PUBLIC INTEREST STATEMENT
Prediction of shelf-life is a required aim in the food manufacturing industry. The development of an effective tool to predict edible oil shelf-life is considered of utmost prominence in order to protect consumers and to avoid the commercialization of oils that do not comply with the regulatory parameters for the commercial grade stated on the label. Edible oil shelf life is one of the significant quality markers, but yet not renowned as a legal parameter in most food safety and quality regulations and standards in African context. This paper reports research into the shelf-life of edible oils determined by analyzing the deterioration curves for the basic quality tests. The proposed models are based on common quality tests with predictable result changes over time and influenced by different aspects of edible oils. Thus, the developed model equation could help to predict the shelf-life of oils at any temperature.
Competing Interests
The authors declares no competing interests.
1. Introduction
Manufactured oil products shelf-life defied as the length of time under normal storage conditions within which no off-flavors or defects are developed and quality parameters are retained within accepted limits for commercial category products. It is important to understand the composition of food material and food products, and the changes that occur when they are grown, harvested, stored, prepared, processed and eaten; so that foods can fulfill their basic function (Mudambi, Rao, & Rajagopal, Citation2006). Food quality is the most important characteristics that determine the consumer acceptability and willingness to purchase. The fact that foods are diverse, complex and active system in which microbiological, enzymatic and physicochemical reactions are simultaneously taking place, and make their age limited (Valentas, Rotstein, & Singh, Citation1997). Consequently, foods are perishable by nature and food quality is always in a dynamic state continuously moving to reduced levels until reaching the quality level that discriminates products that are still acceptable for consumption from those that are no longer acceptable. This quality level is generally defined as the acceptability limit beyond which the product becomes unsuitable for consumption due to legal, nutritional, or sensory criticisms (Kramer & Twigg, Citation1968).
Edible oils and fats are recognized as essential nutrients of our daily diet and contribute significantly to the regulation of different body functions. Numerous physical and chemical parameters are used to assess their quality (Nielsen, Citation2003; Febrianto & Yang, Citation2011). Edible oil quality is largely determined by physicochemical characteristics due to its nature and processing procedure, and the environmental factor when it stays in the market shelf. However, these diverse groups of organic substances are prone to oxidation. Autoxidation is the main cause of edible fats and oils quality deterioration (Farhoosh, Citation2007). Oil shelf life is principally affected by its susceptibility to autoxidation, which is determined in large part by its fatty acid composition (Broadbent & Pike, Citation2003; Merrill, Pike, Ogden, & Dunn, Citation2008). In the course of the autoxidation reaction, a series of compounds are formed, causing off-flavors and rancidity, loss of nutritional value and finally consumer rejection (Alonso, Campos, Salvador, & Frangipane, Citation2004). The reaction consists of three main stages: initiation (involves abstraction of a hydrogen molecule from an unsaturated fatty acid, forming an alkyl radical), propagation (begins when oxygen adds to the alkyl radical and forming a high energy peroxyl radical, which can then abstract hydrogen from another molecule and continues the oxidation cycle), and termination (occurs when two radical species combine, forming a non-radical) (Nawar, Citation1996).
Even though proper care is taken during preparation, packaging, and storage of every food, they are wholesome only for a certain period called shelf-life. The shelf life of a product begins from the time the food is prepared or manufactured. The period is dependent on many factors including the types of ingredients, manufacturing process, type of packaging and how the food is stored (NZFSA, Citation2005). So, shelf-life dating of foods is a mandatory requirement of all processed foods. It provides a guide to consumer in food purchase. This requires a valid and reproducible shelf life study (Kramer & Twigg, Citation1968). There are two test methods for conducting a shelf life study; direct method and indirect method (New Zealand Food Safety Authority (NZFSA), Citation2005). The direct method also known as real-time shelf life study involves storing the product under specific conditions for a time longer than its expected shelf-life and checking it at regular intervals to see when it begins to spoil. The two indirect methods allow for shelf life prediction without conducting a full-length storage trial and are useful for products with a long shelf life. These are predictive model: calculate shelf-life based on information from a database that predicts bacterial growth under specific conditions, and accelerated shelf life study: which involves deliberately increasing the rate, at which a product will spoil, usually by increasing the storage temperature (Robertson, Citation2010). Prediction methods based on kinetic and/or mathematical approaches seem promising, but they usually require considerations over the likely temperature of storage, light incidence, and packaging material to provide meaningful results (Gutiérrez & Fernández, Citation2002).
There were many reasons for the push to study the physicochemical characteristics and evaluation of shelf-life of edible soybean, peanut and cottonseed oils produced in Ethiopia. They are important in daily use as cooking, salad making and in various food processing industries. Quality problem in finished products has been among the major challenges of the manufacturing sector in Ethiopia as identified through industry level survey (AACCSA, Citation2014). Also, edible oil qualities analysis and shelf life testing are an important part of the quality maintenance in the edible oil industry for quality and safety reasons. Inappropriate labeling of the best before date and aging are usually pointed out as the main reasons for failures that can lead to legal actions for mislabeling and bad experiences for consumers (Moore, Spink, & Lipp, Citation2010). The development of an effective tool to predict oils shelf-life is considered of paramount importance in order to protect consumers and to avoid the commercialization of oils that do not comply with the regulatory parameters for the commercial grade stated on the label.
Besides, nutritional and toxicological effects of lipid oxidation in foods have attracted much interest recently (Frankel, Citation1995; Blumenthal, Citation1996; FAO, Citation2003). Oxidation reduces the essential fatty acid content of edible oils. However, a more serious problem is associated with toxicological effects of oxidation products. Since oxidative rancidity is a free radical chain reaction; lots of free radicals are formed, which can pose a major threat to health by damaging the human body at the cellular level (Holt, Citation2011). Excess free radicals can cause premature aging, heart disease, cancer, chronic fatigue syndrome and a host of other conditions (Alonso et al., Citation2004; Greyt et al., Citation2000). The purpose of this research was to achieve the accelerated shelf-life prediction of edible cotton, peanut and soybean seeds oils using an empirical model and quality characterization of the produced oils in Ethiopia.
2. Materials and methods
2.1. Materials
The materials in the study were refined, bleached and deodorized (RBD) cotton, peanut and soybean seed oils produced in Ethiopia. Have no antioxidant intentionally added. After collection, they were kept at 4 °C until analyses commenced to control their deterioration.
2.2. Analysis of oil physical quality parameters
AOAC (Citation1998) Official Method 920.212 was applied to determine the specific gravity of the edible oil samples. The refractive index (RI) of oils samples was obtained by measuring the brix value at 20°C using Refractometer (Model, E-line 90–44-806, Nova Analytical Company, Citation2008). Then, the corresponding refractive reading was taken from Brix to refractive index conversion table. The spectrophotometric method, AOCS (Citation1998) Method Cc 13c-50 was applied to measure the color of edible oils samples. Furthermore, gravimetric method, AOCS (Citation1998) Method 3a-46 was applied to determine the weight fraction of insoluble impurities in the edible oil samples.
2.3. Analysis of oil chemical quality parameters
Moisture content and volatile matter were analyzed by air oven method of AOAC (Citation1998) Official method 925.09. Hanus method was employed to determine the iodine value (IV) of edible oil samples. AOAC (Citation1998) Official method 920.160 was used to determine the saponification value (SV) of the oil samples. AOAC (Citation1998) Official method 933.08 which is ether extraction method was used to quantify the percentage unsaponifiable matter in the oil samples. Non-aqueous titration method was employed to analyze the acid value (AV) of the edible oil samples (FSSAI, Citation2012).
2.4. Fatty acids profile
The fatty acid compositions of edible oils were determined as methyl esters after trans-esterification according to AOAC Official Methods 969.33 (AOAC, Citation1998). Analyses of fatty acids and fatty acids methyl esters were carried out using a 7820A Network GC System equipped with an HP-5MS (30 m x 0.25 mm, 0.25 µm film thickness) capillary column and with a 5977E Network MSD mass spectrometer, operated in electron-impact ionization mode. GC-MS analyses were carried out in split mode (split ratio 1:50), using helium as the carrier gas (1mL/min flow rate). The injector temperature was fixed at 250°C. The sample volume injected was 1μl. The oven temperature was held at 150°C for 2 min and then programmed at 5°C/min to a final temperature of 280°C, where it was maintained for 5 min. It is known that individual fatty acids can be identified by GC because of their different retention times. Major peaks were selected and using the systematic names and CAS no. of the major peaks, their corresponding common names were identified from the literature. For comparative purpose, area percentage was calculated considering only the peak area of selected major peaks.
2.5. Oxidative deterioration
Oxidative deterioration was measured by peroxide analysis. The widely used iodometric titration method AOAC (Citation1998) Official Method 965.33 was used to determine peroxide value (PV) of oil samples in characterizing their oxidative deterioration.
2.6. Shelf-life prediction
The shelf life of oil was determined by using accelerated shelf life testing method. The behavior of hydrogen peroxides formation was used to monitor the extent of oxidative deterioration in the oils and predict their shelf-life (Hosseini, Ghorbani, Mahoonak, & Maghsoudlou, Citation2014). Accordingly, edible oil samples were subjected to a preselected constant-elevated temperature (35, 45 and 55°C) in acceleration/environmental chamber (model VC34060/VC37060) for six successive weeks to speed up the deterioration kinetics. Then, the extent of oxidative deterioration was monitored by chemical testing method (PV analysis) per week. Then, employing the fundamental kinetic principles and Arrhenius relation, data obtained were then modeled to obtain the parameters describing/predicting the oxidation kinetics and the shelf-life. Saguy and Karel (Citation1980) on their study had recommended a kinetic approach and the Arrhenius relationship for modeling the quality deterioration during food processing, transportation and storage.
2.7. Experimental design and statistical data analysis
Design of experiment chosen for the study was a Randomized Complete Block Design. All determinations were carried out in triplicates. Data collected were subjected to analysis of variance applying the principles of one-way ANOVA to test levels of significant difference among the means. The statistical software SPSS version 20 was employed for ANOVA while Microsoft office excel-2007 for regression analysis. Significant differences between the means were determined by Duncan’s multiple range tests. P-values less than 0.05 level of probability were considered statistically significant. The readings were reported in terms of mean ± Standard deviation (SD).
3. Results and discussion
3.1. Edible oils physical quality characteristics
The oil physical quality parameters analysis results obtained for edible oils considered are shown in Table-1. The specific gravity of local edible oils was determined by using a specific gravity bottle at a temperature of 20°C. For edible soybean oil determined specific gravity was amount 0.929 ± 0.02 while the specific gravity of peanut and cottonseed oils was 0.943 ± 0.01 and 0.922 ± 0.01, respectively. There was no significant difference among the oils investigated. This could be attributed to the similar fatty-acid composition, similar total solid content and similar moisture content. The Ethiopian standard agency on the compulsory Ethiopian standard specified a specific gravity amount ranging from 0.9090 to 0.913 for refined peanut oil and 0.918–0.926 for refined cottonseed oil at 20°C, respectively (CES-16, Citation2014; CES-19, Citation2014). On the basis of this standard values, the specific gravity result obtained in the study for edible peanut oil was above the upper bound of the standard value. However, the specific gravity determined for edible cottonseed oil was within the standard value range. On the other hand, the specific gravity of oils obtained in this study was comparable to that reported by Gunstone (Citation2008) for refined oil from soybean (0.919–0.925), peanut oil (0.914–0.917) and cottonseed oil (0.918–0.926).
The refractive index (RI) of local edible soybean, peanut and cottonseed oil samples were measured at 20°C. As shown in Table-1 determined RI values were: 1.489 ± 0.00, 1.486 ± 0.00 and 1.486 ± 0.00 for edible soybean, peanut and cottonseed oils, respectively. There was no significant difference between the RI of edible peanut and cottonseed oil. But, RI of edible soybean oil was significantly different from the rest edible oils investigated. The RI of oils and fats is sensitive to their composition. In fats, RI increases with an increasing chain length of fatty acids in the triglycerides or with increasing unsaturation. A study by Ngassapa and Othman (Citation2001) found that oils of different types exhibited different RI. Besides, Gunstone (Citation2002) stated RI is a parameter that relates to molecular weight, fatty acid chain length, degree of unsaturation, and degree of conjugation. This makes it an excellent spot test for uniformity of compositions of oils and fats (Fakhri & Qadir, Citation2011). Based on this literature review, the higher RI value of soybean oil could be attributed to the difference in composition and its higher degree of unsaturation. In the determination of IV, edible peanut and cottonseed oils had no significant difference but significantly lower than the IV for soybean oil. This implies the degree of unsaturation in edible peanut and cottonseed oils lower; accordingly, lower RI value would expected and it was obtained.
Similar research conducted by Gunstone (Citation2008) reported a RI range of 1.466–1.470 for soybean oil, 1.460–1.465 for peanut oil and1.458–1.466 for cottonseed. The Ethiopian Standard Agency has specified a RI range of 1.460–1.465 and 1.458–1.466 for both refined peanut and cottonseed oils, respectively (Compulsory Ethiopian Standard CES-16, Citation2014; Compulsory Ethiopian Standard CES-19, Citation2014). RI determined for oils analyzed in the study was not comparable to their corresponding literature values. The percentage deviation was 1.37% and 1.34%, respectively.
Appearance is the manifestation of the nature of edible oils through visual attributes of which the color is one. The color of the oil is one of the most important physical indicators for the determination of oil quality (Kim et al., Citation2015). It is an important quality parameter of edible oil, both in the refining process and marketplace. The color of edible soybean, peanut and cottonseed oils were determined by spectrophotometric method and the results were summarized in Table . as observed from the table there was a significant difference in photometric color index among the oils investigated. Edible soybean oil had the lowest color index, while edible cottonseed oil had the highest photometric color index.
Table 1. Physical characteristics edible cotton, peanut and soybean seed oils manufactured in Ethiopia
Insoluble impurities analysis result for domestic edible oils are presented in Table . As indicated in the table, percentage insoluble impurities amounting 0.001 ± 0.00, 0.004 ± 0.00 and 0.013 ± 0.00 were obtained for edible soybean, peanut and cottonseed oils, respectively. There was no significant difference between the soybean and peanut oil. An exception was edible cottonseed oil that contains a significantly higher amount of insoluble impurities than the other oils. The Compulsory Ethiopian Standards indicate maximum insoluble impurities amounting 0.05% (w/w) for both refined peanut and cottonseed oil (Compulsory Ethiopian Standard CES-16, Citation2014; Compulsory Ethiopian Standard CES-19, Citation2014). Compared to the specified standard value, percentage insoluble impurities determined for both edible peanut and cottonseed oils were below the permitted maximum limit declared by Ethiopian Standard Agency.
3.2. Edible oils chemical quality characteristics
Low moisture content of the oil is advantageous in terms of storage stability since the lower the moisture content, the better the storability and suitability to be preserved for a longer period (Orhevba & Efomah, Citation2012). In the study, moisture content and volatile matters (MCVMs) of the edible oils was determined 105°C and the results are shown in Table . Accordingly, percentage MCVMs amounting: 0.210 ± 0.01, 0.219 ± 0.00 and 0.220 ± 0.01 %(w/w) were obtained in edible soybean, peanut and cottonseed, respectively. There was no significant difference among the oils investigated. As specified by Ethiopian standard agency on the Compulsory Ethiopian Standard, the MCVMs of refined peanut and cottonseed oils is 0.2%(w/w) (Compulsory Ethiopian Standard CES-16, Citation2014; Compulsory Ethiopian Standard CES-19, Citation2014). Thus, the MCVMs determined in the oils is comparable to the values specified by the Ethiopian Standard Agency.
Table 2. Chemical characteristics edible cotton, peanut and soybean seed oils manufactured in Ethiopia
Peroxide value (PV) which is used as an indicator of deterioration of oils was found to be 1.299 ± 0.14 for edible soybean, while, 2.398 ± 0.00 and 3.396 ± 0.28 meqs of O2/kg of oil for edible peanut and cottonseed oils, indicating that the oils are fresh. This is because, the PV is used as an indication of quality and stability of oils and fats, and generally fresh oils usually have peroxide values well below 10meq/kg (Vidrih, Vidakovič, & Abramovič, Citation2010). Of the three oils studied PV of edible soybean oil was significantly lower than PV of peanut and cottonseed oil. Studies using soybean oil indicate that peroxide levels ranging from 1.0 to 5.0 meq/kg signify low oxidation; 5.0–10.0 meq/kg signify moderate oxidation; and 10.0meq/kg and above signify high levels of oxidation (AOCS, Citation1998). Accordingly, determined PV of all oils investigated was between the ranges 1.0–5.0 meq/kg implying that low oxidation had occurred in the oils studied. The result obtained for both edible oils in the study were in agreement with the Ethiopian standard value (PV = 10 meq/kg) mentioned (Compulsory Ethiopian Standard CES-16, Citation2014; Compulsory Ethiopian Standard CES-19, Citation2014).
As shown in Table that a PV value of 10meqs of O2/kg of oil, the upper limit for unrefined oils, and a PV of 7meqs of O2/kg of oil, the upper limit for refined oils were not exceeded in the oil samples investigated. In comparison, among the oils considered in the study, edible soya bean oil had on average a significantly lower PV amounting 1.299meqs of O2/kg of oil while edible cottonseed oil had a higher PV amounting 3.197meqs of O2/kg of oil. As compared to soybean oil, the rate of higher peroxidation found in both peanut and cottonseed oils could be related to the kind of treatment to which the oils were subjected, FFAs and degree of unsaturation on the fatty acids that make up the oil. There was no significant difference between peanut and cottonseed oils.
Iodine value (IV) which gives the degree of unsaturation in oils was found to be 136.740 ± 2.03 g of iodine absorbed/100g of oil for edible soybean oil, 97.536 ± 3.59 g of iodine absorbed/100g of oil for edible peanut oil and 101.112 ± 3.45 g of iodine absorbed/100g of oil for edible cottonseed oil. The average IV determined for soybean oil was significantly higher than the other oils investigated, suggesting that the unsaturated fatty acid content of soybean oil was high. Because the IV is an index of unsaturation; the higher the IV, the more unsaturated fatty acid are present in fat and/or oil (Fakhri & Qadir, Citation2011; Scrimgeour, Citation2005). There was no significant difference between the IV of peanut and cottonseed oils; this implying that both oils had nearly equal-unsaturated fatty acid content and degree of unsaturation.
A study by Ngassapa and Othman (Citation2001) stated oxidative and chemical changes in oils during storage are characterized by decrease in the total unsaturation of the oil. This could contribute to the reduced IV of peanut and cottonseed oil. As seen in Table , differences in mean IV value existed between the oils. This value classifies edible soybean and edible cottonseed oils as non-drying whereas edible peanut oil as non-drying. Because Duel (Citation1951) proposed that iodine value above 100 g of iodine absorbed/100 g of oil makes an oil to be classified as drying while below 100 g of iodine absorbed/100g of oil as non-drying.
In the study, the Saponification values (SV) of the local edible oils were determined and is shown in Table . It was found that 210.345 ± 0.45 mg of KOH/g of oil for edible soybean, 210.779 ± 0.45 mg of KOH/g of oil for edible peanut oil and 208.411 ± 0.54 mg of KOH/g of oil for edible cottonseed oil. Even though there was no significant difference between soybean and peanut oils, as compared to cottonseed oil, both oils had higher SV. The presence of high molecular weight fatty acid and their longer chain could contribute to the higher SV of soybean and peanut oils while the presence of low molecular weight fatty acid and their shorter chain attributed to the lower SV of cottonseed oil. Because SV is an indication of the average molecular weight and hence measures the average chain length of fatty acids which make up oil and/or fat (Ngassapa & Othman, Citation2001; Scrimgeour, Citation2005).
All the samples had the highest SV value as compared to FAO & WHO (Citation1993) standards. On the Compulsory Ethiopia Standard, the SV specified for refined peanut and cottonseed oils amount 187–196, and 189-198 mg of KOH per g of oil, respectively (Compulsory Ethiopian Standard CES-16, Citation2014; Compulsory Ethiopian Standard CES-19, Citation2014). However, the SV of these oils determined in this study was higher than the upper bound of the standard range. From previous studies the SV values of edible oils amounts 189–195 g of KOH/g of oil for soybean oil, 187–196 g of KOH/g of oil for peanut oil and 189–198 g of KOH/g of oil for cottonseed oil (Scrimgeour, Citation2005). Compared to the literature values SV determined for the oils investigated in this work was higher.
Also, Table summarizes unsaponifiable matters of edible soybean, peanut and cottonseed oils which were determined in this study. Accordingly, percentage unsaponifiable matters amounting 0.169 ± 0.03, 0.069 ± 0.03 and 0.383 ± 0.03% (w/w) was found in soybean, peanut and cottonseed oils, respectively. There is no significant difference between soybean and peanut oils. The highest value of unsaponifiable matters was found in edible cottonseed oil. A study by Shahidi (Citation2005) suggested that the content of unsaponifiable matters is varied in different oils depending on the extent of oil refining.
Unsaponifiable matters in refined peanut and cottonseed oil is specified by Ethiopian Standard Agency. The tolerable maximum unsaponifiable matters allowed in refined peanut and cottonseed amounts 0.8% and 1.5% (w/w), respectively (Compulsory Ethiopian Standard CES-16, Citation2014; Compulsory Ethiopian Standard CES-19, Citation2014). Compared to these national standard values, unsaponifiable matters determined for both oils were acceptable. In general, unsaponifiable matters are resent in edible oils at less than 2% (Shahidi, Citation2005). Literatures showed that unsaponifiable matters is about <1.5 for soybean, <1 for peanut oil and <2 for cottonseed oil (Belitz, Grosch, & Schieberle, Citation2009; Scrimgeour, Citation2005). In view of this study, the unsaponifiable matters determined for the oils investigated were comparable to literature values.
Acid value (AV) is a measure of the free fatty acids in edible oils; the higher the AV the higher the free fatty acid which also means decreased oil quality (Tesfaye, Sahile, & Madhusudhan, Citation2015). The AV of edible oils considered in this study is summarized in Table ; amounts: 0.420 ± 0.00, 0.630 ± 0.10, and 0.561 ± 0.00 g of KOH per g of oil for edible soybean, peanut and cottonseed oils respective. Among the oils studied, edible soybean and cottonseed oils nearly shows the same AV or didn’t differ significantly. This could be due to either a similar refining technologies may have applied in the respective oil company or low FFA content in raw materials prior to processing. Edible peanut oil had a higher AV than the rest oils and significantly different. Natural variation in moisture content and the variation in refining and deodorization process could attribute for the significant difference.
Compulsory Ethiopia Standard specifies AV amounting 0.6 mg of KOH per g of oil for both edible peanut and cottonseed oils, respectively (Compulsory Ethiopian Standard CES-16, Citation2014; Compulsory Ethiopian Standard CES-19, Citation2014). The results obtained in the study were comparable to the national standard value. According to the Codex Alimentarius Commission (Citation1999), the recommended maximum AV limits for refined plant oils is 0.3% and the limiting value for unrefined oils is 3%. The investigation was revealed that the AV values of edible oils studied were above the limiting value for refined oils (0.3%) as indicated in the Codex Alimentarius (Citation1981) Commission standard. Israel (Citation2008) on his study stated that AV represents FFA content due to enzymatic activity and is usually indicative of spoilage, and its maximum acceptable level is 4mgKOH/g of oil, below which the oil is acceptable for consumption. As compared to the study, all edible oil samples had lower AV value.
The AV determination measures the amount of hydrolytic activity that has occurred in the oil. As shown in Table determined AV value for edible peanut oil was significantly higher than for edible soybean and cottonseed oil. This means that either the amount of hydrolytic activity that had occurred in the edible peanut oil was higher than that had occurred in edible soybean and cottonseed oils or the refining technology employed for FFAs removal in edible peanut oil factory was not as effective as in edible soybean and cottonseed oils factory; in other way the edible oil factories may differ in the refining technology applied to remove FFAs. Besides, the higher AV of peanut oil might be due to the high FFAs content in the raw material prior to processing.
It is reported that oils with low free fatty acid (low AV) usually have high SV. As per the study’s results, this was valid theory for edible soybean and cottonseed oil. As shown in Table , in comparison to edible cottonseed oil, edible soybean oil had higher SV amounting 210.345 ± 0.451 mg of KOH/g of oil and lower AV which amounts 0.420 ± 0.0004 mg of KOH/g of oil while, edible cottonseed oil had lower SV amounting 208.411 ± 0.538 mg of KOH/g of oil and had higher AV which amounts 0.561 ± 0.0003 mg of KOH/g of oil. The same was true when peanut oil was compared to edible cottonseed oil (or vice versa). However, the inverse relationship between AV and SV was invalid when edible peanut oil compared to edible soybean oil (or vice versa).
3.3. Fatty acids profile
Determining the oils composition is important not only because of the fatty acid contents and the pattern of glyceride distribution but also because the physical character and end-use performance of oils are directly related to composition (O’Brien, Citation2009). Oils and fats are now characterized mainly by their fatty acid composition. The GC-MS analysis results summarized in Tables qualitatively describes the fatty acids composition of edible soybean, peanut and cottonseed oils (Figure ). The fatty acid profile of the edible soybean oil was as follows: palmitic (15.489%), linoleic (42.807%), oleic (37.668%), and margaric (4.035%). Determined fatty acid composition of edible peanut oil includes Myristic (3.902%), Palmitoleic (2.506%), Pentadecanoic acid (22.464%), Linoleic (13.139%), Oleic (46.252%), and Stearic (11.737%). The edible cottonseed oil fatty acid profile was: Myristic (1.21%), Palmitic (29.52%), Linoleic (41.587%), Oleic (24.855%), and Stearic (2.835%).
Table 3. Typical fatty acid profile of edible cotton, peanut and soybean seed oils
Figure 1. Fatty acids chromatogram for a) soybean oil b) peanut oil c) cottonseed oil.
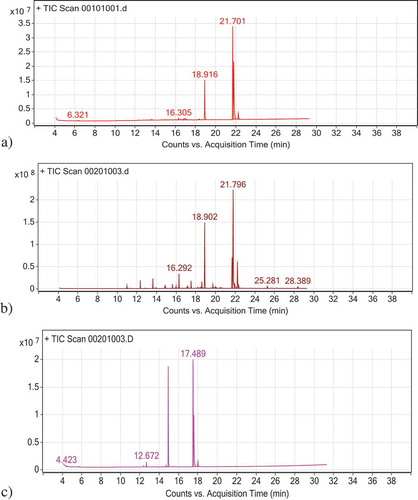
It is possible to observe that the higher percentage peak area was registered for the linoleic acid 42.807% and 41.587%, which is the most important fatty acid; essential fatty acid both in edible soybean and cottonseed oils, respectively. Based on this, the predominant fatty acid both in edible soybean and cottonseed oil were linoleic. In edible peanut oil, higher percentage peak area was obtained for Oleic (46.252%); implying that being the major fatty acid in peanut oil. Forero, Ruiz, and Giraldo (Citation2012) on their study about the calculation of thermo-physical properties of oils and triacylglycerols has found the fatty acid content of soybean oil which comprises: Palmitic (11.3%), Oleic (23%), Linoleic (53.4%) and Linolenic (5.96%). As shown in Table for edible soybean oil, the fatty acid profile determined was comparable to the literature.
The fatty acid profile provides information on oil nutritional quality. The content of fatty acids, as well as the ratio between unsaturated and saturated fatty acids, is an important parameter for determination of the nutritional value of certain oil. It is known that the excessive consumption of saturated fatty acids is related to the increase of the plasmatic cholesterol and the obesity (Kostik, Memeti, & Bauer, Citation2013). Saturated fatty acid content of edible soybean and cottonseed oil were amount nearly half of the total fatty acids content (saturated and unsaturated fatty acids). However, in edible peanut oil, the saturated fatty acid content was less than one-fourth of the total fatty acids content. On the other hand, in respect of total percentage of essential fatty acids (linoleic), edible soybean and cottonseed oils had comparable linoleic content and were superior to the amount in the edible peanut oil.
3.4. Shelf-life prediction and kinetic analyses
Taking hydrogen peroxides formation into consideration, kinetic analyses were attempted to examine deterioration behavior of edible soybean, peanut and cottonseed oils, and the effect on the shelf-life the oils was also investigated from a quantitative viewpoint. Accordingly, it was proceeded to determine the parameters of the kinetic model and Arrhenius relation that fit better the experimental data. Primarily, the apparent order of reaction for the formation of hydrogen peroxides was determined through linear regression analysis. Figure shows the behavior of hydrogen peroxides formation of in the edible soybean, peanut and cottonseed oils at 35°C, 45 °C and 55 °C, respectively.
As could be observed from Figure , during the early stages, i.e. initiation stage, lipid peroxidation starts at a slow rate, in consequence, the level of hydrogen peroxides produced remains low until free radicals formed. This can be theoretically interpreted as the reaction between the radical, formed during the induction time, and the unsaturated fatty acid. Once the free radicals formation happened, as observed in all the accelerated mode of oxidative deterioration of the edible oils, the reaction rates were increased exponentially. A sudden increase observed in PV was related to the propagation stage of the oils oxidation process. The graph of hydrogen peroxide formation at a temperature of 55°C for edible soybean and cottonseed oils were declining nearly for the last two weeks. These different patterns of the curves correspond to thermal decomposition of hydrogen peroxide into secondary oxidation products.
Figure 2. Hydrogen peroxides formation profile in edible (a) soybean, (b) peanut and (c) cottonseed oils at 35°C, 45°C and 55°C.
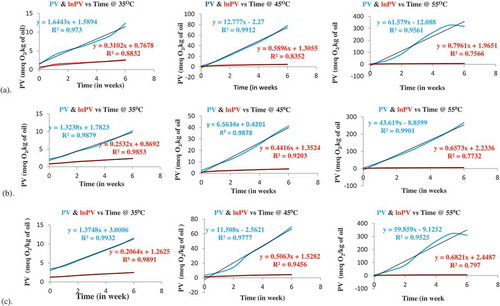
Most of the reactions responsible for food quality loss have been classified as zero, first and second order (Cunha & Oliveira, Citation2000). These kinetic equations are specific for each food and for each temperature studied (Steele, Citation2004). The model equation that represents the oxidative deterioration of the edible oils studied was established based on the coefficients of linear regression (R2).
As shown in Figure , the experimental data for hydrogen peroxide formation in the edible soybean, peanut and cottonseed oil verses time was plotted, including the corresponding values of natural logarithm as well. For edible soybean oils studied at all acceleration temperature, the coefficients of linear regression (R2) for zero order plot was more close to one than coefficients of linear regression (R2) for first order plot. Similar relationships were also observed at 35, 45 and 55°C for both edible peanut and cottonseed oils studied. Accordingly, the linear regression analysis indicated that the kinetic model that best fitted the experimental data corresponds to a zero order model for all edible oil investigated, since [PV] Vs time shows a good fit to linear equation. The following Equation (1) represents the kinetic model which was identified for the oxidative deterioration of edible soybean, peanut and cottonseed oils at every accelerated temperature studied.
Where: kPV—is the rate constant for hydroperoxides formation (meq. O2/kg-week),
t—is the reaction time and PVO represents the peroxide value at time zero of reaction.
Oxidation of edible oils is the most important reactions that cause deterioration of the quality of the oil (Gonabad, Noghabi, & Niazmand, Citation2015; Eskin & Robinson, Citation2001). Taking the decaying linear characteristics into consideration, coefficients of linear regression (R2) and the rate constant (kPV) of the zero-order kinetic models for edible soybean, peanut and cottonseed oil at every accelerated temperature studied was mentioned in Table . The reaction rate constant was determined for each temperature from the slope of the line obtained from the zero order plot. The result emphasizes the effects of temperature on the rate of hydrogen peroxide formation during the lipid peroxidation of each edible oils studied. As could be seen in Table , the value of rate constant became higher with an increase of the storage temperature, for all oils investigated.
Table 4. Kinetic parameters of hydrogen peroxides formation in edible cotton, peanut and soybean seed oils
Temperature is the main environmental factors that influence the rate of quality loss (Tan, Man, Selamat, & Yusoff, Citation2001). This fact was confirmed by the development of Arrhenius model. From data of kinetic model of zero order, Arrhenius plot was drawn, ln(kPV) Vs 1/T for all local edible oils considered in the study to determine the entity of dependency between the oxidative reaction constant and temperature. Figure shows the Arrhenius plot for edible soybean, peanut and cottonseed oils; respectively. For these calculations, it was taken into account the values of the rate constant of formation of hydrogen peroxides (kPV) that were obtained from kinetic models of zero order at each accelerated temperatures tested. Because with the results obtained at 35°C, 45°C and 55°C, it is possible to extrapolate the rate constant value and shelf-life of oil at any other temperature.
Figure 3. Effect of temperature on the rate constant of hydrogen peroxides formation in edible (a) soybean (b) peanut (c) cottonseed oils.
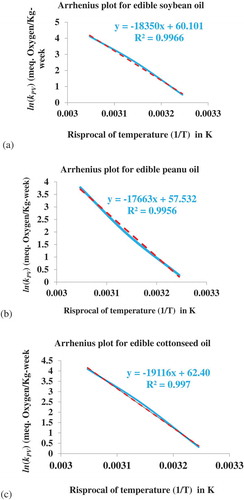
A coefficient of linear regression (R2) value close to one indicates that the Arrhenius model is applicable to experimental data obtained (Piedrahita, Penaloza, Cogollo, & Rojano, Citation2015). In the linear form Arrhenius model (lnk = lnkA-EA/R(1/T)), the coefficient—EA/R represents the slope of Arrhenius plot while lnkA represents the intercept. Having the values of these variables could help to develop the rate constant equation by substituting the corresponding values into the Arrhenius equation (k = kAexp(-E/RT)). Accordingly, the following rate constant equations were developed for the oxidative deterioration of edible soybean (Equation-2), peanut (Equation-3) and cottonseed (Equation-4) oils. With these equations, the oxidative deterioration rate constant could be predicted at any temperature for the corresponding edible oils.
Where: k—rate constant and T—temperature in Kelvin (K).
The Zero-order reaction was already the identified kinetic model equation (Equation-1) for oxidative deterioration of edible soybean, peanut and cottonseed oil. Substituting the rate constant model equation developed (Equation-2, Equation-3 and Equation-4) into the kinetic model equation, Equation-1 and rewriting for time, the following general shelf-life prediction models were developed for edible soybean (Equation-2), peanut (Equation-6) and cottonseed (Equation-7) oils. These shelf-life equations could help to predict the shelf-life of the corresponding edible oils at any temperature.
Where: ts—shelf-life, PV—Peroxide Value of oil at the end of shelf-life, PVO—Initial Peroxides Value, and T—Temperature in K.
The concentration of hydrogen peroxides in edible fats and oils has been regulated by legislation. As indicated in the Compulsory Ethiopia Standard for edible peanut and cottonseed oils, the agency declared a maximum PV of 10meq oxygen/kg both in edible peanut and cottonseed oils (Compulsory Ethiopian Standard CES-16, Citation2014; Compulsory Ethiopian Standard CES-19, Citation2014). For this reason and as general rule, this value was set as the limit to predict the shelf-life of the edible soybean, peanut and cottonseed oils at 25°C. for Arrhenius plot a value coefficient of linear regression (R2) close to one indicates that Arrhenius model is applicable to experimental data obtained, and that the activation energy (EA) remains constant within the range of accelerated temperatures studied (Singh, Citation1994; Piedrahita et al., Citation2015). Based on this background and employing the predictive models developed, the rate constant (kPV25) and shelf-life of edible oils investigated were predicted at ambient temperature (25°C) and the result is summarized in Table . Besides, activation energy (EA) and temperature acceleration factor (Q10), for oxidative deterioration of edible soybean, peanut and cottonseed oils were also calculated and mentioned in Table .
Table 5. Parameters of Arrhenius model for the formation of hydrogen peroxides in edible cotton, peanut and soybean seed oils
As revealed in Table the calculated activation energy amounts 152.569, 146.857, and 158.938 kJ/mol.K for edible soybean, peanut and cottonseed oils, respectively. According to the Arrhenius principle, oil with a high EA value oxidizes faster at high temperatures, while oil with a low EA value oxidizes faster at low temperatures (Saldana & Monteagudo, Citation2013). Based on this, edible soybean oil had the highest oxidation rate compared to edible peanut and cottonseed oil. This could be attributed to the highest degree of unsaturation. From the analysis, edible soybean oil had the highest value 136.740 ± 2.031grams iodine absorbed/100g oil followed by edible cottonseed oil having IV amounting 101.112 ± 3.454grams iodine absorbed/100g oil and edible peanut with IV of 97.536 ± 3.592 grams’ iodine absorbed/100g oil. Also the values of the EA were in a reasonable order, i.e. EA of edible peanut oil< EA of edible cottonseed oil < EA edible of soybean oil. Souza, Santos, Conceica, Silva, and Prasad (Citation2004) was investigated the oxidation kinetics of sunflower oil in the temperature range of 380–550°C and determined the kinetic parameters using four different methods, for the study temperature range of 380–480, on average calculated EA was amount 293.923 kJmol−1. Activation energy values obtained at 25°C for all edible oils considered in this study were much lower than the value determined for sunflower oil.
The presence of double bonds increases the oxidation rate and would increase the reaction rate constant (Campo, Zhao, Suidan, Venosa, & Sorial, Citation2007). The predicted kPV25°C values for the oxidative deterioration of all edible oils studied are presented in Table . It was amounts 0.235, 0.181 and 0.179 week−1 for edible soybean, peanut and cottonseed oils, respectively. The higher reaction rate constant belongs to edible soybean oil; it could be attributed to a higher percentage of polyunsaturated fatty acids in the oil in comparison with edible peanut and cottonseed oils. A study by Tan et al. (Citation2001) on the evaluation of oxidative stability of vegetable oils by isothermal differential scanning Calorimeter; they determined the rate constant at four different temperatures for soybean and peanut oils. At 110°C, the corresponding rate constants were amounts 0.804 and 0.784 week−1 respectively. Rate constant values obtained at room temperature (25°C) for all edible oils investigated were much lower than these literature values.
The predicted shelf-life at room temperature (25°C) for all edible oils investigated is shown in Table ; it was amounts: 36.953, 42.115 and 37.816weeks for edible soybean, peanut and cottonseed oils, respectively. Compared to soybean and cottonseed oil, peanut oil has longer shelf-life. The shelf-life of properly refined edible oils is typically 12–18 months at ambient temperature (Farhoosh, Citation2007). As compared to the literature, the shelf-life of edible oils determined in this research was lower. Studies using soybean oil indicate that peroxide levels ranging from 1.0 to 5.0 meq/kg signify low oxidation; 5.0–10.0 meq/kg signify moderate oxidation; and 10.0meq/kg and above signify high levels of oxidation (AOCS, Citation1998). The PV of edible oils determined fall within the moderate oxidation range. This could attribute to lower the shelf-life of all edible oils studied.
The magnitude of the temperature effect on the rate of oxidative deterioration of edible soybean, peanut and cottonseed oils was evidenced by Q10 values. The effect of temperature on the reaction rate of oil oxidation is expressed by a number called Q10. This number is determined as the ratio of the reaction rate constant at temperatures with 10°C differences (Taoukis, Labuza, & Saguy, Citation1997). As shown in Table , Q10 value for edible soybean, peanut and cottonseed oils were 7.369, 6.838 and 8.010, respectively. In general, a higher Q10 number implies that a smaller temperature change is needed to induce a certain change in the rate of lipid peroxidation (Farhoosh, Niazmand, Reazaei, & Sarabi, Citation2008). Based on this, the rate of hydrogen peroxide formation in edible peanut oil was slower than in edible soybean and cottonseed oils. Farhoosh et al. (Citation2008) determined this number for refined canola, soybean, sunflower, and corn oils containing antioxidants as 13.2, 18.2, 15.2, 10.2 and 2.08, respectively. Low Q10 value of oils investigated as compared to the mentioned oils could be attributed to fatty acid composition.
4. Conclusions
Various physicochemical characteristics of local edible soybean, peanut and cottonseed oils were studied. Except for SV and specific gravity, the result obtained for the rest quality parameters considered were within the standard range indicated by Ethiopia Standard Agency. It can be concluded that the edible oils have acceptable quality parameters. Fatty acid profile analysis showed that the predominant fatty acid in edible soybean and cottonseed oils was linoleic acid 42.807% and 41.587%, respectively. While oleic acid (46.252%) was major fatty acid in edible peanut oil. Therefore, local edible soybean, peanut and cottonseed oils are an excellent source of omega-6, linoleic acid (essential; fatty acid) and omega-9, oleic acid. For all oils investigated, the kinetic model established was identical implying that, edible soybean, peanut and cottonseed oils have a similar mechanism of oxidative deterioration (peroxide formation). Relative to edible soybean and cottonseed oils, the shelf-life of edible peanut oil was better. Thus, edible peanut oil has longer hypothetical stability and is more suitable for frying.
Declaration of interest
The authors declare no conflict of interest. The authors have no competing interests to declare.
Correction
This article has been republished with minor changes. These changes do not impact the academic content of the article.
Additional information
Funding
Notes on contributors
Shimelis Admassu
Shimelis Admassu is a Professor (Associate) at the Addis Ababa University, School of Chemical and Bio-Engineering, Addis Ababa, Ethiopia. He has Doctoral Degree in Food Process Engineering and Bioprocess Technology from Asian Institute of Technology, Bangkok, Thailand.
Dr.Eng. Shimelis has 86 Publications on Reputable Journals. He supervised four PhD in food process engineering, 106 MSc students in food engineering, food science and technology. His research and contribution to knowledge focused on phytochemicals nutraceutical foods and chilling operation in biomaterials. Dr.Eng. Shimelis has a great aspiration to work in the cutting-edge-research areas of Agro-food and Bio-System Engineering including Emerging Technologies, Food Quality Assurance Management Systems and Agro-based Industry Sector Development.
References
- Addis Ababa Chamber of Commerce & Sectoral Association (AACCSA). (2014). An overview of Ethiopian manufacturing sector. Addis Ababa, Ethiopia: DAB Development Research and Training PLC.
- Alimentarius, C. (1981). International food standards (FAO/WHO Codex Alimentarius). The Food and Agriculture Organization of the United Nations (FAO) and WHO. Food safety, microbiological risks. CODEX STAN 19-1981, Standard for Edible Fats and Oils. Codex Alimentarius Harmonized International Food Standards. Retrieved from https://ec.europa.eu/food/safety/international_affairs/standard_setting_bodies/codex/cac_en
- Alimentarius, C. (1999). International food standards (FAO/WHO Codex Alimentarius). Federal Institute for Health Protection of Consumers and Veterinary Medicine. Joint FAO/WHO food standards programme codex committee on nutrition and foods for special dietary uses twenty-second session. Doc. Reference No. CX/NFSDU 00/1. The Food and Agriculture Organization of the United Nations (FAO) and World Health Organization (WHO), Berlin, Germany, 19 – 23 June 2000
- Alonso, S. G., Campos, V. M., Salvador, M. D., & Frangipane, G. (2004). Oxidation kinetics in olive oil triacylglycerols under accelerated shelf-life testing (25-75°C). University of Castilla-La Mancha, Spain. European Journal of Liped Science and Technology, 106, 369–18. doi:10.1002/ejlt.200300921
- AOAC. (1998). Official methods of analysis. (16thed). 4th revision, Author, Gaithersburg.
- AOCS. (1998). Official methods of and recommended practices of the American oil Chemists’ Society, Methods Cg 3-91 (5th ed.). Champaign, Illinois: American Oil Chemists’ Society.
- Belitz, H. D., Grosch, W., & Schieberle, P. (2009). Food Chemistry (4th ed.). Berlin Heidelberg: Springer-Verlag.
- Blumenthal, M. M. (1996). Frying technology, in Edible Oil and Fat Products: Products and Application Technology. In Bailey`s Industrial Oil and Fat Products, Hui, Y.H. (Ed.). 5th Edn., Vol. 3, New York, NY: John Wiley and Sons, pp: 429–481. Retreived from: https://scialert.net/fulltextmobile/?doi=ajft.2010.310.323.
- Broadbent, C. J., & Pike, O. A. (2003). Oil Stability Index correlated with sensory determination of oxidative stability in canola oil. Journal of the American Oil Chemists’ Society, 80, 59–63. doi:10.1007/s11746-003-0651-y
- Campo, P., Zhao, Y., Suidan, M. T., Venosa, A. D., & Sorial, G. A. (2007). Biodegradation kinetics and toxicity of vegetable oil triacylglycerols under aerobic conditions. Chemosphere, 68(11), 2054–2062. doi:10.1016/j.chemosphere.2007.02.024
- Compulsory Ethiopian Standard CES-16. (2014). Groundnut (peanut) oil specification (2nd ed.). Addis Ababa, Ethiopia: Ethiopian Standard Agency.
- Compulsory Ethiopian Standard CES-19. (2014). Cottonseed oil specification (2nd ed.). Addis Ababa, Ethiopia: Ethiopian Standard Agency.
- Cunha, M., & Oliveira, F. A. R. (2000). Optimal experimental design for estimating the kinetic parameters of processes described by the first-order arrhenius model under linearly increasing temperature profiles. Journal ofFood Engineering, 46, 53–60.
- Duel, H. J. (1951). The Lipids. Their Chemistry and Biochemistry, 1, 53–57.
- Eskin, N. A. M., & Robinson, D. S. (2001). Food shelf life stability: Chemical, biochemical and microbiological changes. New York: CRC Press LLC.
- Fakhri, N. A., & Qadir, H. K. (2011). Studies on various physico-chemical characteristicsof some vegetable oils. Journal of Environmental Science and Engineering, 5(2011), 844–849.
- FAO and WHO. (1993). Fats and oils in human nutrition. Report of a joint FAO/WHO expert consultation, Organized by the Food and Agriculture Organization of the United Nations and the World Health Organization Rome, Italy, 19-26 October 1993. pp.147, ISBN: 92 5 103621 7. Available https://www.who.int/nutrition/publications/nutrientrequirements/9251036217/en/.
- Farhoosh, R. (2007). Shelf‐life prediction of edible fats and oils using Rancimat. Lipid Technology, 19(10), 232–234. doi:10.1002/lite.200700073.
- Farhoosh, R., Niazmand, R., Reazaei, M., & Sarabi, M. (2008). Kinetic parameterdetermination of vegetable oil oxidation under rancimat test conditions. European Journal of Lipid Science and Technology, 110, 587–592. doi:10.1002/ejlt.200800004
- Febrianto, N. A., & Yang, T. A. (2011). Producing high quality edible oil by using eco-friendly technology: A review. Advance Journal of Food Science and Technology, 3(4), 317–326.
- Food & Agricultural Organization (FAO), (2003). Global and regional food consumption patterns and trends. Retrieved from: http://www.fao.org/docrep/005/ac911e/ac911 e05.htm#TopOfPage
- Food Safety & Standard Authority of India (FSSAI). (2012). Manual for analysis of oils and fats. New Delhi: Government of India.
- Forero, D. C. C., Ruiz, O. A. G., & Giraldo, L. J. L. (2012). Calculation of thermo-physical properties of oils and triacylglycerols using an extended constituent fragments approach. CT&F-Ciencia, Tecnología y Futuro, 5(1), 67–82.
- Frankel, E. N., (1995). Oxidation of polyunsaturated lipids and its nutritional consequences. In: In W. A. M. Castenmiller (Ed.), Proceedings of the 21st World congress of the International Society for fat research (ISF) (Vol. 2, pp. 265–269). Bridgewater: P. J. Barnes and Associates.
- Gonabad, M. A., Noghabi, M. S., & Niazmand, R. (2015). Estimation of kinetic parameters of walnut oil using rancimat test. Journal of Applied Environmental and Biological Sciences, 4(11S), 28–32.
- Greyt, W. D., & Kellens, M. (2000). Refining Practices. In W. Hamm & R. J. Hamilton (Eds.), Edible Oil Processing (pp. 79–128). Sheffield: Sheffield Academic Press Ltd., U.K.
- Gunstone, D. F. (2002). Vegetable oils in food technology, composition, properties and uses. Osney Mead, Oxford OX2 0EL, UK: Blackwell Publishing Ltd.
- Gunstone, D. F. (2008). Oils and Fats in the Food Industry. West Sussex, United Kingdom: John Wiley & Sons Ltd.
- Gutiérrez, F., & Fernández, J. L. (2002). Determinant parameters and components in the storage of virgin olive oil. Prediction of storage time beyond which the oil is no longer of ‘extra’ quality. Journal of Agricultural and Food Chemistry, 50(3), 571–577. doi:10.1021/jf0102158
- Holt, A., (2011). Free Radicals and Nutrition. Retrieved from: http://ezinearticles.com/? FreeRadicals-andNutrition&id=731167.
- Hosseini, H., Ghorbani, M., Mahoonak, A. S., & Maghsoudlou, Y. (2014). Monitoring hydroperoxides formation as a measure of predicting walnut oxidative stability. Acta Alimentaria, 43(3), 412–418. doi:10.1556/AAlim.43.2014.3.7
- Israel, S. A. (2008). Chemical qualities of oils from some fresh and marketvegetable crops within Kwara State of Nigeria. An International Journalpublished by theNigerian Society for Experimental Biology, Biochemistry, 20(2), 71–75.
- Kim, J., Shin, E. C., Lim, H. J., Yoon, M., Yang, H., Park, J., … Cho, S. (2015). Thermal Oxidative Stability of Various Vegetable Oils used for the Preparation of the Seasoned Laver Pyropia spp. The Korean Society of Fisheries and Aquatic Science, 18(1), 21–26. doi:10.5657/FAS.2015.0021
- Kostik, V., Memeti, S., & Bauer, B. (2013). Fatty acid composition of edible oils and fats. Journal of Hygienic Engineering and Design., 4, 3–9
- Kramer, A., & Twigg, B. (1968). Measure of frozen food quality and quality changes. In D. K. Tressler (Ed..), The freezing preservation of foods (Vol. 2, pp. 97–127, 4th ed.). Westport: AVI Publ. Co..
- Merrill, L. I., Pike, O. A., Ogden, L. V., & Dunn, M. L. (2008). Oxidative stability of conventionaland high-oleic vegetable oils with added antioxidants. Journal of the American Oil Chemists’ Society, 85(8), 771–776. doi:10.1007/s11746-008-1256-4.
- Moore, J. C., Spink, J., & Lipp, M. (2010). Development and application of a database of food ingredient fraud and economically motivated adulteration from 1980 to 2010. Journal of Food Science, 77(4), R118–R126. 2012. doi:10.1111/j.1750-3841.2012.02657.x
- Mudambi, R. S., Rao, S. M., & Rajagopal, M. V. (2006) 4835/24, Ansari Road, Daryaganj, 110002. Food Science (2nd ed). New Delhi: New Age International (P) Ltd., Publishers.
- Nawar, W. (1996). Lipids. In O. Fennema (Ed.), Food Chemistry (3rd ed., pp. 225–319). Boca Raton: CRC Press.
- New Zealand Food Safety Authority (NZFSA). (2005). A Guide to Calculating the Shelf Life of Foods, New Zealand Food Safety Authority. Wellington, New Zealand: Information Booklet for the Food Industry.
- Ngassapa, F. N., & Othman, O. C. (2001). Physicochemical characteristics of some locally manufactured edible vegetable oils marketed in Daressalaam. Tanzania Journal of Science, 27, p49–58. doi:10.4314/tjs.v27i1.18335
- Nielsen, S. S. (2003). Food Analysis (3rd ed.). New York: Kluwer Academic/Plenum Publishers.
- Nova Analytical Company. (2008). E-line 90-44-806 Refractometer User Guide. Tunbridge Wells, Kent: Belling +Stanley Ltd.
- O’Brien, D. R. (2009). Fat and oils: Formulating and processing for applications (3rd ed.). Sound Parkway NW, United States of America.: Taylor & Francis Group.
- Orhevba, B. A., & Efomah, A. N. (2012). Extraction and characterization of cottonseed (Gossypium) oil. International Journal of Basic and Applied Science, 1(2), 398-402.
- Piedrahita, M. A., Penaloza, J., Cogollo, A., & Rojano, A. B. (2015). (2015): Kinetic study of the oxidative degradation of choibá oil (Dipteryx oleifera Benth.) with Addition of Rosemary Extract (Rosmarinus officinalis L.). Food and Nutrition Sciences, 6, 466–479. doi:10.4236/fns.2015.65048
- Robertson, L. G. (2010). Food Packaging and Shelf Life, A practical Guide. Sound Parkway NW: Taylor and Francis Group, LLC.
- Saguy, I., & Karel, M. (1980). Modeling of quality deterioration during food processing and storage. Food Technology, 34(2), 78–85.
- Saldana, M. D. A., & Monteagudo, S. I. M. (2013). Oxidative stability of fats and oils measured by differential scanning calorimetry for food and industrial applications. InTech, Chapter 19, 445–474. doi: 10.5772/54486
- Scrimgeour, C. (2005). Chemistry of fatty acids, in bailey’s industrial oil and fat products, edible oil and fat products: Chemistry, properties, and health effects (Vol. 1, 6th ed.). Hoboken, New Jersey: John Wiley & Sons, Inc.
- Shahidi, F. (2005). Quality assurance of fats and oils, Part 1. Edible Oil & Fat Products: Chemistry, Properties, and Health Effects in bailey’s industrial oil and fat products (Vol. Six, 6th ed.). John Wiley & Sons, Inc.
- Singh, R. P. (1994). Shelf life evaluation of foods. In Man, C. M. D., & Jones, A. A.(Eds.), Springer Science + Business Media, Dordrecht, BV. ISBN 10: 1461520959, pp. 332.
- Souza, A. G., Santos, J. C. O., Conceica, M. M., Silva, M. C. D., & Prasad, S. (2004). A thermo-analytic and kinetic study of sunflower oil. Brazilian Journal of Chemical Engineering, 21(02), 265–273. doi:10.1590/S0104-66322004000200017
- Steele, R. (2004). Understanding and measuring the shelf-life of food (1st ed.). Abington Cambridge CB1 6AH England.: Woodhead Publishing Limited, Abington Hall.
- Tan, C. P., Man, Y. B. C., Selamat, J., & Yusoff, M. S. A. (2001). Application of arrhenius kinetics to evaluate oxidative stability in vegetable oils by isothermal differential scanning calorimetry. Journal American Oil Chemist Society, 78, 11. doi:10.1007/s11746-001-0401-1
- Taoukis, P. S., Labuza, T. P., & Saguy, I. S. (1997). Kinetics of food deterioration and shelf-life prediction, Handbook of Food Engineering Practice (pp. 361–403). Boca Raton, FL: CRC Press.
- Tesfaye, L., Sahile, S., & Madhusudhan, A. (2015). Microbial quality and chemical characteristics evaluation of edible oil sold at gondar town markets. North West Ethiopia,International Journal of Modern Chemistry and Applied Science, 2(4), 238–247.
- Valentas, K., . J., Rotstein, E., & Singh, R. P. (1997). Handbook of Food Engineering Practice. New York, USA: CRC Press LLC.
- Vidrih, R., Vidakovič, S., & Abramovič, H. (2010). Biochemical parameters and oxidative resistance to thermal treatment of refined and unrefined vegetable edible oils. Czech Journal of Food Sciences, 28, 376–384. doi:10.17221/CJFS
- Wsowicz, E., Gramza, A., Hece, M., Henryk, H., Korczak, J. J., Maecka, M., … Zawirska-Wojtasiak, R. (2004). Oxidation of Lipids in Food. Polish Journal of Food and Nutrition Sciences, 13/54(SI 1), 87–100.