
 ?Mathematical formulae have been encoded as MathML and are displayed in this HTML version using MathJax in order to improve their display. Uncheck the box to turn MathJax off. This feature requires Javascript. Click on a formula to zoom.
Abstract
The objective of this study was to evaluate the G x E (genotype × environment) interaction using AMMI and GGE-biplot analysis for sugar yield of sugarcane genotypes and identify stable clones in the old sugar estates of Ethiopia. Eleven sugarcane clones plus one control clone were evaluated during three crop cycles (plant cane and first and second ratoon crops) in eight environments. The experiment was laid out as randomized complete block design with three replicates in over 3 years and locations. Adaptability and phenotypic stability of the sugarcane clones were evaluated using Additive main effects and multiplicative interaction (AMMI) and Genotype main effect and genotype x environment interaction (GGE). AMMI analyses revealed significant (P < 0.01) genotype and environmental effects as well as G × E with respect to sugar yield. In the analysis of variance, 48.8% of the sugar yield variation was explained by the environment, 16.9% by differences among genotypes, and 16.8% by GE interaction. GGE-biplot models showed that the eight environments used for the study belonged to two mega-environments. According to AMMI and the GGE results, clones G3 (FG05-424), the check variety G5 (NCO334), and G10 (FG06-750) were the most productive in tons of sugar per hectare and stable and recommended for the test environments.
Keywords:
PUBLIC INTEREST STATEMENT
In Ethiopia, as in other tropical countries, sugarcane is the main source of sugar and sugar industry plays a significant role in the socioeconomy of the country. The sugarcane breeding program aims to select new genotypes with local or broad adaptation to provide high yields over several crop years within target environments representative of different cultivation areas. The objective of this study was to evaluate the G x E interaction using AMMI and GGE-biplot analysis for sugar yield of sugarcane genotypes and identify stable clones in the old sugar estates of Ethiopia. Findings of the study confirmed that the eight environments used for the study belonged to two mega-environments. Sugarcane clones performing consistently in the test environments were identified and recommended. Findings from this study indicate representative test environments for future evaluation of sugarcane clones.
Competing Interests
The authors declare no competing interests.
1. Introduction
Sugarcane is the main sugar-producing crop in the world contributing more than 80% of the total sugar produced and has recently become a primary crop for biofuel production (Garsmeur et al., Citation2018). In Ethiopia, as in other tropical countries, sugarcane is the main source of sugar and sugar industry plays a significant role in the socioeconomy of the country. The sugarcane varietal requirement of the sugar estates across the country is being supported by importing varieties from different source countries. These are imported as clone setts and in the form of fuzz and are screened in different environments. The breeding program aims to select new genotypes with local or broad adaptation to provide high yields over several crop years within target environments representative of different cultivation areas. Breeding programs consist of several successive stages of selection using clonal multiplication. In the most advanced selection stages, the best elite candidates are tested in multienvironment trials (MET) at representative locations using replicated experiments.
The observation and analysis of genotype-by-environment (G x E) interaction in multienvironment yield trials (MEYT) are very important for evaluation, selection and recommendation of crop varieties (Mattos, Oliveira1, Filho, Daros, & Veríssimo, Citation2013; Regis et al., Citation2018; Verissimo, Silva, Aires, Daros, & Panziera, Citation2012). Sugarcane is usually characterized as having high G x E interaction, low fertility and high hetrozygosity due to its polyploid nature and alloploidy. Sugarcane breeding is highly complex because of the highly heterozygous nature of sugarcane and high ploidy level. In multiyear yield trials, ranks
of genotypes often vary from one location to another for yield and quality, thereby indicating a strong genotype x environment interaction (GEI). The MEYT experiments involve a series of trials where many genotypes and environments are studied for their main effects and interactions. Such studies are useful to develop sugarcane varieties by determining their average response as well as ranking of the genotypes according to their differential response when exposed to different environmental conditions (GE interaction) for traits such as yield (Gauch, Citation1992; Queme, Orozco, Ovalle, & Melgar, Citation2005).
The GEI is of major concern to plant breeders because a large interaction can reduce gains from selection and make the identification of superior cultivars difficult. Measuring GEI is important to determine an optimum strategy for selecting genotypes adapted to target environments (Kamila, Alina, Wiesława, & Jan, Citation2016). When GEI is significant, its causes, nature, and implications must be carefully considered in breeding programs (Sandhu et al., Citation2012). Kang (Citation1998) discussed extensively the causes of GEI and ways to exploit or minimize GEI. An understanding of the causes of GEI is essential for the implementation of efficient selection and evaluation networks (Ramburan & Zhou, Citation2011).
Evaluation of different genotypes in a multienvironment and/or year is not only important to determine high-yielding cultivars but also to identify sites that best represent the target environment (Yan, Cornelius, Crossa, & Hunt, Citation2001). Moreover, the successfully developed high-yielding potential new cultivar should have a stable performance and broad adaptation over a wide range of environments. A genotype or cultivar is considered stable if it has adaptability for a trait of economic importance across diverse environments. The environmental component (E) generally represents the largest component in analyses of variance, but it is not relevant to cultivar selection; only G and GE are relevant to meaningful cultivar evaluation and must be considered simultaneously for making selection decisions (Yan & Kang, Citation2003).
Though there is no single method developed so far that equally satisfy breeders for the study of G x E interactions, there are many different statistical analyses in use today, including parametric and non-parametric, to study the nature of interactions of genotypes with environments (Kaya, Aksura, & Taner, Citation2006). Two frequently used statistical analyses are the additive main effects and multiplicative interaction (AMMI) model and the genotype main effects and genotype × environment interaction effects (GGE) model (Gauch, Citation2006). AMMI in multi-environmental trials (MET) data analysis partitions the GEI matrix into individual genotypic and environmental scores (Bocianowski et al., Citation2019; Zobel, Wright, & Gauch, Citation1988). It was demonstrated that AMMI could be successfully employed to analyze G x E interactions and identify specific cultivar adaptability of sugarcane MEYTs (Srivastava, Gauch, Kulshreshtha, & Misra, Citation1999; Queme, Orozco, Ovalle, Soto, & Melgar, Citation2001; Queme et al., Citation2005). A quantitative stability value to rank genotypes through the AMMI model called the AMMI Stability Value (ASV) was also developed by Purchase, Hatting, and Van Deventer (Citation2000). In the analysis of cultivar stability, they found a significant correlation between the stability measures ASV, Shukla, Wricke (Wi) and Eberhart and Russel (S2d), but Finlay and Wilkinson (b) and Linn and Binns (Pi) showed limited association with any of the other methods. It was established that ASV is the most appropriate single method of describing the stability of genotypes (Naroui Rad et al., Citation2013).
The other multivariate statistical tool used to describe and interpret multi-environment data structure in breeding programs is site regression of genotype plus G × E interaction (GGE) biplot model (Samonte, Wilson, McClung, & Medley, Citation2005; Yan, Hunt, Sheng, & Szlavnics, Citation2000). This multiplicative model combines the two main effects, i.e. genotypes (G) plus the G × E interaction (GE). This method is shown to be useful to determine which-won-where pattern of the MEYT data thereby identifying high-yielding and stable cultivars and the power to discriminate and identify representative test environments (Yan, Citation2001). Nowadays, it is a common practice by sugarcane breeders to use GGE models in explaining G × E interaction and analyzing the performance of genotypes and test environments (Guilly, Thomas, Audrey, Laurent, & Jean-Yves, Citation2017; Mattos et al., Citation2013; Surinder, Sawanpreet, Brar, Singh, & Manjit, Citation2014; Todd, Yong-Bao, Collins, Herman, & Michael, Citation2018).
The objective of this study was to evaluate the G × E interaction using AMMI and GGE-biplot analysis for sugar yield of sugarcane genotypes and identify stable clones in the old sugar estates of Ethiopia.
2. Materials and methods
The experiment was conducted at Wonji, Metehara and Fincha Sugar Estates in Ethiopia (Table ). Eleven sugarcane clones, denoted as G1, G2, G3, G4, G6, G7, G8, G9, G10, G11 and G12, as well as control (elite commercial clone), labeled as G5 were evaluated (Table ).
Table 1. Location information of the test locations
Table 2. Description of the 12 sugarcane genotypes tested during 2015–2017 cropping season
The experimental period lasts 3 years involving three crop cycles (i.e. plant cane and first and second ratoon crops). The plant materials were planted across locations during February 2014. The data from plant cane (first cut), first ratoon cane (second cut), and second ratoon cane (third cut) harvested in May 2015, May 2016 and, May 2017, respectively, at three locations (sugar estates), totaling eight environments (location × cut combinations, designated E1-E8) were used.
The location × cut combinations would have totaled nine environments, but first ratoon cane was lost at Wonji due to the occurrence of accidental fire. The experiment was laid out in a completely randomized block design with three replications. Each experimental plot had six rows of 6 m length with 1.45 m between rows (52.2 m2). Data were collected in each crop cycle including cane yield and its components and sugar quality parameters and sugar yield. For the purpose of this article, the data on sugar yield (ton/ha) were used to test adaptability and phenotypic stability of the clones.
First analysis of variance was made for each of the environments to know the existence of genetic variability among experimental clones and to verify homogeneity of the error variances. The combined analysis of variance of the locations and cuts was performed, to identify the possible interactions of clones with environments. Adaptability and stability analyses were done using the multivariate AMMI and GGE-biplot methods after the significance of the GxE interaction was determined.
2.1. AMMI and GGE-biplot analysis
In the AMMI analysis, several models (AMMI0, AMMI1, AMMI2, …, AMMIn) can be generated, which are the combinations of the means and principal components that capture portions of the GxE matrix variation (Duarte & Venkovsky, Citation1999). At the opposite extreme, the AMMI model with no components, which has just the ANOVA portion of the model, is designated by AMMI0 (it has no GGE counterpart).
The AMMI method combines the traditional ANOVA and PCA into a single analysis with both additive and multiplicative parameters (Gauch, Citation1992). The first part of AMMI uses the normal ANOVA procedures to estimate the genotype and environment main effects. The second part involves the PCA of the interaction residuals (residuals after the main effects are removed). The AMMI model equation is:
where Yij is the value of the ith genotype in the jth environment; μ is the grand mean; Gi is the deviation of the ith genotype from the grand mean; Ej is the deviation of the jth environment from the grand mean; λk is the singular value for PC axis k; αik and δjk are the PC scores for axis k of the ith genotype and jth environment, respectively; Rij is the residual and ε is the error term (Gauch, Citation1992).
The interaction G × E was analyzed in an AMMI model (Zobel et al., Citation1988; Guach, 1992) with a view to identify sugarcane clones better adapted to different environments. AMMI’s stability value (ASV) was calculated following the formula proposed by Purchase (Citation1997) as follows:
where SSIPCA1/SSIPCA2 is the weight given to the IPCA1 value by dividing the IPCA1 SS by the IPCA2 SS; and the IPCA1 and IPCA2 scores are the genotypic scores in the AMMI model.
The GGE-biplot methodology, which is composed of two concepts, the biplot concept (Gabriel, Citation1971) and the GGE concept (Yan et al., Citation2000), was used to visually analyze the multienvironment yield trial (MEYTs) data. This methodology uses a biplot to show the factors (G and GE) that are important in genotype evaluation and that are also sources of variation in GEI analysis of MEYTs data (Yan, Citation2001; Yan et al., Citation2000). The data is analyzed using two software programs: Genstat.12 and SAS.9.0.
3. Results and discussion
3.1. AMMI analysis
The combined analysis of variance and AMMI analysis is shown in Table . It was observed that there are highly significant differences for environment, genotype and their interactions. The combined ANOVA showed that sugar yield was significantly affected by the environment because of significant variance at 1% level (Table ), which explained 48% of the total (G + E + GEI) variation, while G x E interaction captured 16.8% of the total sum of squares.
Table 3. AMMI analysis of variance over eight environments
The large sum of squares and significant effect for environments demonstrated that the experiments were carried out under divergent edaphoclimatic conditions resulting in difference for environmental means causing variation in sugar yield. This result indicated that the genotypes were characterized as environmentally induced changes. This variation is useful when intending to study the effects of GxE interaction, as well as to evaluate the phenotypic stability of genotypes. The magnitude of the GEI sum of squares was relatively similar with that of the genotypes, indicating that there was somehow similar response of some of the genotype across environments.
The observed G × E interactions in the AMMI model have been partitioned among the first and second IPCA (Interaction Principal Components Axes) accounting for 41.2% and 29.6%, respectively, together explaining 70.8% of the total variation (Table ). This was in agreement with Mattos et al. (Citation2013) and Regis et al. (Citation2018) who suggested that GEI pattern is collected in the first principal components of analysis. However, the value was lower than that reported by Guerra et al. (Citation2009) and by Verissimo et al. (Citation2012) by who applied AMMI analysis to sugarcane.
The AMMI model IPCA1 and IPCA2 scores of sugar yield for each genotype and the corresponding AMMI stability value (ASV) are shown in Table . According to ASV ranking, genotype number 6 (FG04-420) had the lowest value and the most stable genotype with relatively higher average sugar yield, while genotype numbers 9 (B52/298) and 12 (FG04-798) were relatively unstable. The quantitative stability value called AMMI Stability Value (ASV), developed by Purchase et al. (Citation2000) to rank genotypes through the AMMI model was considered to be the most appropriate single method of describing the stability of genotypes (Equation (2)). This stability measure was found to have a significant correlation with other stability measures like Shukla, Wricke (Wi) and Eberhart and Russel (S2d); but Finlay and Wilkinson (b) and Linn and Binns (Pi) showed limited correspondence with any of the other methods (Purchase et al., Citation2000).
Table 4. Mean sugar yield (ton/ha), AMMI stability values (ASV), and ranking orders of the 12 genotypes tested across eight environments
The significant interaction in genotype and environment for sugar yield pointed that each factor cannot independently explain all the variation observed. This resulted in different performances of the genotypes in the evaluated environments.
This necessitates a more detailed account of the study of this interaction to interpret it in order to recommend superior genotypes. This validates the need to take more seriously stability and adaptability for selection and recommendation of promising sugarcane clones.
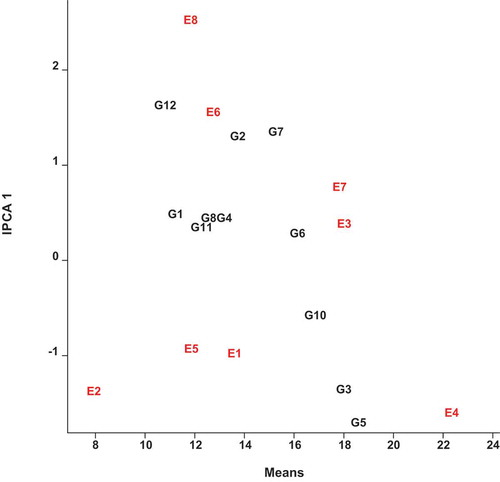
The AMMI1 biplot, showing main effects means on the abscissa and IPCA 1 values as the ordinates, genotypes (or environments) that appear almost on a perpendicular line have similar means and those that fall almost on a horizontal line have similar interaction patterns (Crossa, Gauch, & Zobel, Citation1990). It was demonstrated by these authors that genotypes (or environments) with large IPCA 1 scores (either positive or negative) have high interactions, whereas genotypes (or environments) with IPCA 1 scores near zero have small interactions. Similarly, in the biplot of (Figure ) that reveals 90% of the total SS, five of the eight environments had below-average main effects and were poor. Environments E3 (Metehara in 2015), E4 (Metehara in 2016) and E7 (Fincha in 2016) had the highest main effects and were favorable to the performance of most of the genotypes. On the contrary, environments E2 (Wonji in 2017) and E5 (Metehara in 2017) were the poorest environments. In general, environments E3 (Metehara in 2015) and E7 (Fincha in 2016) showed higher main effect values and lower interactions and are most preferable; whereas Wonji (E1 and E2) showed consistently below average (poor) main effect values and larger interactions.
Metehara showed below-average main effects in 2017 (E7) and above-average main effects in 2015 (E3) and in 2016 (E4). Genotypes 4, 6, 8, 11 and environment E3 were least interactive. Genotypes 8 and 11 were placed closer to the biplot origin and were therefore stable but they had average main effects below the grand mean. The most stable genotype was 6 and genotype 10 had lower interaction and relatively stable; in addition, both had higher average main effects, which makes them the most preferable genotypes (Figure and Table ). On the other hand, genotype 12 had the lowest main effects and most unstable. The check variety, genotype 5, had the highest average main effect but larger IPCA 1 score and is thus more unstable (Figure and Table ). It is more adaptable to Metehara environmental condition. Guerra et al. (Citation2009) and Verissimo et al. (Citation2012) identified genotypes and environments with same-sign PCI scores, with positive specific interactions for sugarcane. The classification of genotypes and environments for sugarcane was the same as established by Mattos et al. (Citation2013).
Figure 1. A biplot of sugar yield environmental means (ton ha−1) vs IPCA1 for 12 sugarcane genotypes in the eight environments.
3.2. Mean performance and stability of sugarcane clones by GGE biplot
GGE biplot is a data visualization tool, which graphically displays a G×E interaction in a two-way table (Yan, Citation2011). It is an effective tool for mega-environment analysis (e.g. “which-won-where” pattern), whereby specific genotypes can be recommended to specific mega-environments (Mattos et al., Citation2013; Yan & Kang, Citation2003; Yan, Kang, Ma, Wood, & Cornelius, Citation2007; Yan & Tinker, Citation2006). In this method, genotypes are evaluated for their mean performance and stability and also environmental evaluation, the power to discriminate among genotypes in target environments.
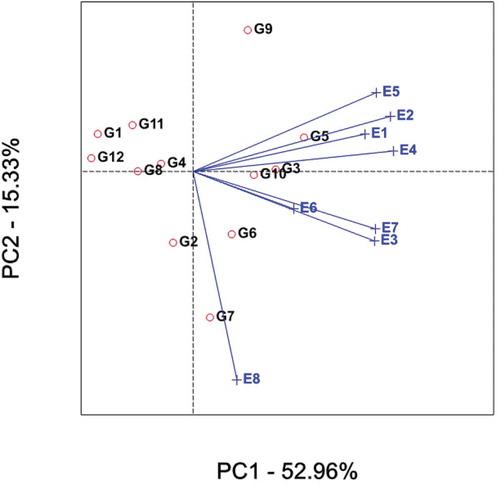
The polygon view of a GGE-biplot based on symmetric scaling unambiguously displays the which-won-where pattern providing a comprehensible summary of the GEI pattern of a MEYT data set (Figure ). The polygon is formed by connecting vertex genotypes (G1, G5, G7, G9 and G12). These genotypes have the largest vectors in their respective directions; the vector length and direction represent the extent of the response of the genotypes to the tested environments. All other genotypes are contained within the polygon and have smaller vectors, i.e., they are less responsive in relation to the interaction with the environments within that sector.
A set of lines drawn from the biplot origin and intersecting the sides of the polygon at right angles. Thus, the lines divide the biplot into five sectors and thereby the biplot subdivide the target environment into subregions (mega-environments). Mega-environments are those sectors which comprise one or more environments. This way the environment markers were grouped into two sectors (i.e. two mega-environments) where sector 1 contained environments E1-E7 and sector 2 had only one environment E8 (Figure ). In agreement with the results reported by Yan (Citation2002), the genotype(s) vertex in these sectors may have higher or the highest yield compared to other parts in all environments.
Figure 2. Genotype main effects + genotype × environment interaction (GGE) biplot, representing tons of sugar yield per hectare of 12 sugarcane clones (G) evaluated in eight environments (E) in 2015, 2016 and 2017.
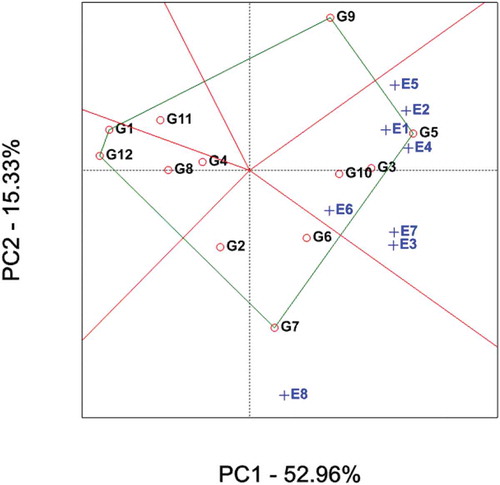
The genotype on the vertex of the polygon, contained in a mega-environment, had the highest yield in at least one environment and was one of the best-performing genotypes in the other environments (Yan & Rajcan, Citation2002). Accordingly, the vertex genotype in sector 1 was found to be genotype 5 (NCO-334) which is the standard check. Therefore, the check variety was the highest yielder in environments E2, E3, E4, E5 and E7 and performed well in E1 and E6 and genotype 7 obtained highest yield in E8 (Figure and Table ). It is quite interesting to see that the check variety was performing higher than all the test clones across environments. It is an alarm that more number of elite genotypes should be evaluated in the future in these environments to get superior variety.
As can be observed from Figure , all of the test locations across all years except E8 were clustered into the same sector. This indicates the consistency in the performance of genotypes in this sector over the years at a given single location. There was inconsistency of genotypes performance only in the last environment (E8). Environment IPC1 scores had all positive values leading to non-cross-over type G × E interaction. On the other hand, environment IPC2 scores had both negative and positive values. This indicated that there was a difference in ranking orders among genotypic yield performances across environments leading to crossover G × E interaction (Figure ). This result was corroborated by reports of Surinder et al. (Citation2014) and Regis et al. (Citation2018).
By using the average principal components in all environments, the average environment coordination (AEC) method was employed to evaluate the yield stability of genotypes (Figure ). A line drawn through the average environment and the biplot origin having one direction pointed to a greater genotype main effect. Moving either direction away from AEC ordinate and from the biplot origin indicates greater GEI effect and reduced stability. The AEC ordinate separates genotypes with below-average means from those with above-average means.
Figure 3. Average environment coordination (AEC) views of the GGE-biplot based on environment-focused scaling for the means performance and stability of genotypes. Black and blue numbers stand for genotypes and environments, respectively.
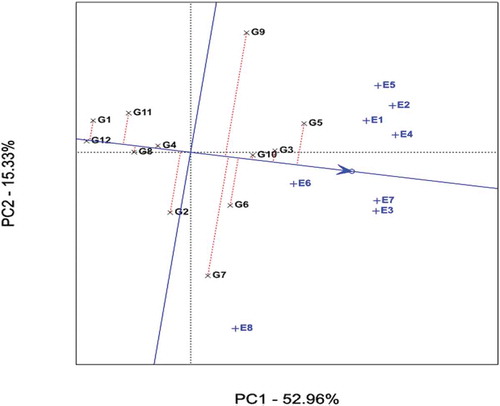
Therefore, genotypes with above-average means were G5 (highest) to G9, whereas those with below-average means were G2 to G1 with G12 scoring the lowest (Figure and Table ). Stability of genotypes is more important in addition to good mean yield. Thus, genotypes G3 and G10 are more stable with better average sugar yield other than the check (G5). Conversely, genotypes G7 and G9 are more variable.
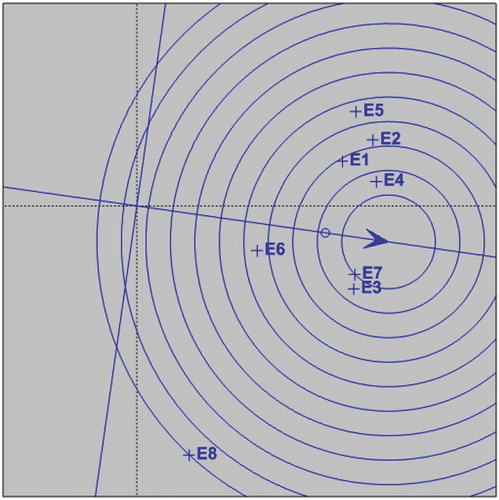
Figure depicts GGE-biplot based on genotype-focused scaling for comparison of the genotypes with the ideal genotype. Yan and Kang (Citation2003) stated that the ideal genotype is one that with the highest mean performance and absolutely stable. This is assumed to be in the center of the concentric circles the arrow pointing to it (Figure ).
Figure 4. GGE-biplot based on genotype-focused scaling for comparison of the genotypes with the ideal genotype. Black and blue numbers stand for genotypes and environments, respectively.
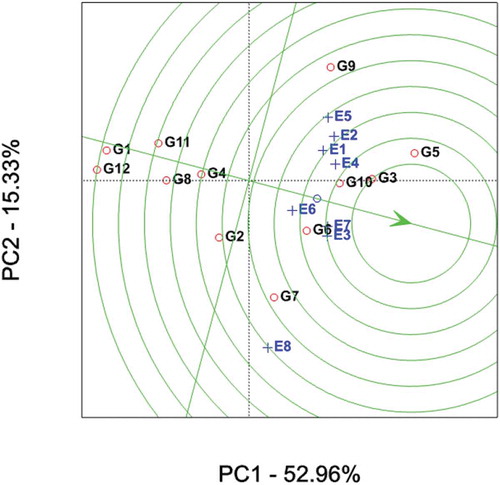
Such an ideal genotype is defined by having the greatest vector length of the high-yielding genotypes and with zero GEI. An ideal genotype should have an invariably high average yield in all environments concerned. This ideal genotype is graphically defined by the longest vector in PC1 and without projections in PC2. The concentric circles in Figure help visualize the distance between each genotype and the ideal genotype. It is more desirable for a genotype to be located closer to the ideal genotype; hence, genotypes G3 and G5 (check variety) followed by G10 were ideal in terms of higher-yielding ability and stability.
The interrelationship among the environments is presented in the vector view of the GGE-biplot (Figure ). The angle between the environment vectors provides further information on the correlation between environments, where an acute angle indicates a positive correlation, an obtuse angle indicates negative correlation and a right angle indicates no correlation (Figure ). Accordingly, all environments were positively correlated except E5 and E8 as all of the angles among them were smaller than 90° suggesting that indirect selection for sugar yield can be practical across these test environments. The difference between the average yield of genotypes G3, G5 (check) and G10 was lowest in all environments except E8 (Figure and Table ), i.e., they contributed less to the GE interaction. That is to say that a genotype adaptable or with good performance in one environment may exhibit a similar response in another environment more correlated to it. Positive and negative correlations between test environments were also detected by Mattos et al. (Citation2013) who used the GGE-biplot approach to assess sugarcane and its production environments.
Figure 5. GGE-biplot based on environment-focused scaling for environments. Black and blue numbers stand for genotypes and environments, respectively.
An ideal environment should have a high PC1 score (greatest power of genotype discrimination in terms of main genotype effects) and zero score for PC2 (greatest representativeness of all other environments). In Figure , this environment is represented on the axis of abscissa AEC by an arrow in the center of the concentric circles. Similar to the ideal genotype, the ideal environment is only an estimate and serves as a reference for site selection for multi-environment trials. The most desirable is the one closest in the graph of the ideal environment (Yan et al., Citation2000; Yan & Rajcan, Citation2002). The environments 7 (Fincha in 2017), 3 (Metehara in 2015) and 4 (Metehara in 2016) contained in the second concentric circle is the location with greatest ability to discriminate genotypes, favoring the selection of superior genotypes (Figure and Table ).
Figure 6. GGE-biplot based on environment-focused scaling for comparison the environments with the ideal environment. Blue numbers stand for environments.
4. Conclusions
The large sum of squares and significant effect for environments demonstrated that the experiments were carried out under divergent climatic conditions resulting in difference for environmental means causing variation in sugar yield. The stability and adaptability of GGE biplot and AMMI indicated the genotypes G3 (FG05-424), the check G5 (NCO334) and G10 (FG06-750) as the most productive in tons of sugar per hectare and stable. These are the genotypes recommendable across the environments. It was also indicated that Metehara was the environment with the greatest effect of GE interaction with discriminating ability of the performance of genotypes. The percentage of explanation of the sum of squares was high by both GGE-biplot and AMMI methods.
Acknowledgements
The authors are grateful to the financial grant of the Sugar Corporation of Ethiopia.
Additional information
Funding
Notes on contributors
Esayas Tena
Our research group is involved in research on sugarcane breeding and biotechnology. The team is working on evaluation and maintenance of sugarcane genetic resources and provision of adaptable high performing sugarcane varieties to the various sugarcane producing agro-ecologies in Ethiopia. Research areas of interest include study of abiotic and biotic stresses to sugarcane crop production and producing superior high yielding varieties that enhance productivity of the sugar industry.
References
- Bocianowsk, J., Warzecha, T., Nowosad, K., & Bathelt, R. (2019). Genotype by environment interaction using AMMI model and estimation of additive and epistasis gene effects for 1000-kernel weight in spring barley (Hordeum vulgare L.). Journal of Applied Genetics, 60, 127–14. doi:10.1007/s13353-019-00490-2
- Crossa, J., Gauch, H. G., & Zobel, R. W. (1990). Additive main effects and multiplicative interaction analysis of two international maize cultivar trials. Crop Science, 30, 493–500. doi:10.2135/cropsci1990.0011183X003000030003x
- Duarte, J. B., & Venkovsky, R. (1999). Interaction of genotypes x environments: an introduction to the AMMI analysis (pp. 60). Ribeirão Preto: Brazilian Society of Genetics. ( (Series Monographs, n.9)).
- Gabriel, K. R. (1971). The biplot graphic display of matrices with application to principal component analysis. Biometrika, 58, 453–467. doi:10.1093/biomet/58.3.453
- Garsmeur, O., Droc, G., Antonise, R., Grimwood, J., Potier, B., Aitken, K., … D’Hont, A. (2018). A mosaic monoploid reference sequence for the highly complex genome of sugarcane. Nature Communications, 9, 2638. doi:10.1038/s41467-018-05051-5
- Gauch, H. G. (2006). Statistical analysis of yield trials by AMMI and GGE. Crop Science, 46, 1488–1500. doi:10.2135/cropsci2005.07-0193
- Gauch, H. G. (1992). Statistical analysis of regional yield trials. Amsterdam: Elsevier.
- Guerra, E. P., Oliveira, R. A., Daros, E., Zambon, J. L. C., Ido, O. T., & Bespalhok Filho, J. C. (2009). Stability and adaptability of early-maturing sugarcane clones by AMMI analysis. Cropp Breeding and Applied Biotechnology, 9, 260–267. doi:10.12702/1984-7033
- Guilly, S., Thomas, D., Audrey, T., Laurent, B., & Jean-Yves, H. (2017). Analysis of multienvironment trials (MET) in the sugarcane breeding program of Re´union Island. Euphytica, 213, 213. doi:10.1007/s10681-017-1994-1
- Kamila, N., Alina, L., Wiesława, P., & Jan, B. (2016). Genotype by environment interaction for seed yield in rapeseed (Brassica napus L.) using additive main effects and multiplicative interaction model. Euphytica, 208, 187–194. doi:10.1007/s10681-015-1620-z
- Kang, M. S. (1998). Using genotype-by-environment interaction for crop cultivar development. Advances in Agronomy, 62, 199–252.
- Kaya, Y., Aksura, M., & Taner, S. (2006). CGE-Biplot analysis of multienvironment yield trials in bread wheat. Turkish Journal of Agriculture, 30, 325–337.
- Mattos, P. H. C., Oliveira1, R. A. J., Filho, C. B., Daros, E., & Veríssimo, M. A. A. (2013). Evaluation of sugarcane genotypes and production environments in Paraná by GGE biplot and AMMI analysis. Crop Breeding and Applied Biotechnology, 13, 83–90. doi:10.1590/S1984-70332013000100010
- Naroui Rad, M. R., Abdul Kadir, M., Rafii, M. Y., Jaafar Hawa, Z. E., Naghavi, M. R., & Farzaneh, A. (2013). Genotype × environment interaction by AMMI and GGE biplot analysis in three consecutive generations of wheat (Triticum aestivum) under normal and drought stress conditions. Australian Journal of Crop Science, 7(7), 956–961.
- Purchase, J. L. (1997). Parametric analysis to described G x E interaction and yield stability in winter yield ( Ph.D Thesis). Department of Agronomy, Falculty of Agriculture, University of Orange Free State, Bloemfontein, South Africa, pp. 4–83.
- Purchase, J. L., Hatting, H., & Van Deventer, C. S. (2000). Genotype x environment interaction of winter wheat (T.aestivum) in South Africa: Stability analysis of yield performance. South African Journal of Plant and Soil, 17(3), 101–107. doi:10.1080/02571862.2000.10634878
- Queme, J. L., Orozco, H., Ovalle, W., & Melgar, M. (2005). Analysis of genotype-by-environment interaction for sugarcane based on the AMMI model. Sugar Cane International, 23, 21–24.
- Queme, J. L., Orozco, H., Ovalle, W., Soto, G., & Melgar, M. (2001). AMMI analysis of sugarcane cultivar trials in Guatemala. Proceedings of the International Society of Sugar Cane Technologists, 24, 512–515.
- Ramburan, S., & Zhou, M. (2011). Investigating sugarcane genotype x environment interactions under rainfed conditions in South Africa using variance components and biplot analysis. Proceedings of the South African Sugar Technologists’ Association, 17–19 August, 2011, Durban, South Africa, 84, 345–358.
- Regis, J. A. V. B., Andrade, J. A. C., Santos, A., Moraes, A., Trindade, R. W. R., Henriques, H. J. R., … Oliveira, L. C. (2018). Adaptability and phenotypic stability of sugarcane clones. Pesquisa Agropecuária Brasileira, 53(1), 42–52. doi:10.1590/S0100-204X2018000100005
- Samonte, S. C. P. B., Wilson, L. T., McClung, A. M., & Medley, J. C. (2005). Targeting cultivars onto rice growing environments using AMMI and SREG GGE biplot analysis. Crop Science, 45, 2414–2424. doi:10.2135/cropsci2004.0627
- Sandhu, S. K., Ram, B., Kumar, S., Singh, R. S., Uppal, S. K., Brar, K. S., Singh, P., & Nair, N. V. (2012). GGe biplot analysis for visualization of performance rank and stability of sugarcane genotypes. International Sugar Journal, 114, 810–820.
- Srivastava, H. M., Gauch, H. G., Jr., Kulshreshtha, N., & Misra, G. P. (1999). Genotype x environment interaction – efficiency and use of AMMI matmodel in sugarcane. Proceedings of the International Society of Sugar Cane Technologists, 20, 476–485.
- Surinder, K. S., Sawanpreet, S., Brar, R. S., Singh, P. S. B., & Manjit, S. K. (2014). GGE biplot analysis for cane and sugar yield from advanced stage sugarcane trials in subtropical India. Journal of Crop Improvement, 28(5), 641–659. doi:10.1080/15427528.2014.925025
- Todd, J., Yong-Bao, P., Collins, K. E. D., Herman, W., & Michael, P. (2018). Analysis of genotype by environment interaction in Louisiana sugarcane research plots by GGE biplots. Sugar Technology, 20, 407. doi:10.1007/s12355-017-0565-z
- Verissimo, M. A. A., Silva, D. A. S., Aires, R. F., Daros, E., & Panziera, W. (2012). Adaptability and stability of early sugarcane genotypes in Rio Grande do Sul. Agricultural Research in Brazil, 47, 561–568. doi:10.1590/S0100-204X2012000400012
- Yan, W. (2001). GGE biplot-A windows application for graphical analysis of multi-environment trial data and other types of two-way data. Agronomy Journal, 93, 1111–1118. doi:10.2134/agronj2001.9351111x
- Yan, W. (2002). Singular value partitioning in biplot analysis of multi-environment trial data. Agronomy Journal, 94, 990–996. doi:10.2134/agronj2002.0990
- Yan, W. (2011). GGE Biplot vs. AMMI Graphs for Genotype-by-Environment Data Analysis. Journal of the Indian Society of Agricultural Statistics, 65(2), 181–193.
- Yan, W., Cornelius, P. L., Crossa, J., & Hunt, L. A. (2001). Two types of GGE biplots for analyzing multi-environment trial data. Crop Science, 41, 656–663. doi:10.2135/cropsci2001.413656x
- Yan, W., Hunt, L. A., Sheng, Q., & Szlavnics, Z. (2000). Cultivar evaluation and mega-environment investigation based on the GGE biplot. Crop Science, 40, 597–605. doi:10.2135/cropsci2000.403597x
- Yan, W., & Kang, M. S. (2003). GGE Biplot analysis: a graphical tool for breeders, geneticists, and agronomists. Boca Raton, FL: CRC Press.
- Yan, W., Kang, M. S., Ma, B., Wood, S., & Cornelius, P. L. (2007). GGE biplot vs. AMMI analysis of genotype-by-environment data. Crop Science, 47, 643–655. doi:10.2135/cropsci2006.06.0374
- Yan, W., & Rajcan, I. (2002). Biplot analysis of test sites and trait relations of soybean in Ontario. Crop Science, 42, 11–20.
- Yan, W., & Tinker, N. A. (2006). Biplot analysis of multi-environment trial data: Principles and applications. Canadian Journal of Plant Science, 86, 623–645. doi:10.4141/P05-169
- Zobel, R. W., Wright, M. G., & Gauch, H. G. (1988). Statistical analysis of a yield trial. Agronomy Journal, 80, 388–393. doi:10.2134/agronj1988.00021962008000030002x