
Abstract
Calibration of soil test P is a stage in determining P fertilizer rates to meet plant P requirement and soil nutrient availability. The objective of this study was to determine the critical phosphorous (Pc) and phosphorous requirement factor (Pf) for food barley production. The experiment was laid out in randomized complete block design (RCBD) with two replications. Barley response to different levels of Phosphorus was conducted on Cambisols of Enda mekoni at 10 sites in the Northern Ethiopia during the 2013 and 2014 cropping seasons. The treatments, comprising five levels of P fertilizer (0, 10, 20, 30 and 40 kg P ha−1), were arranged in a randomized complete block design with three replications. The critical concentration and requirement factor of Phosphorus on barley in the study area were 10.5 mg kg−1 and 16.27 mg kg−1, respectively. Hence, it could be concluded that the highest grain yield, P requirement factor and P critical obtained could serve in areas where the rainfall distribution and soil type are similar with study district where this experiment was conducted. Further studies should be done on phosphorous use efficiency and other related plant nutrition parameters.
PUBLIC INTEREST STATEMENT
Fertilizer use trend of the country had been focused mainly on the use and application of nitrogen and phosphorous fertilizers in the form of di-ammonium phosphate (18-46-0) and urea (46-0-0) for almost all cultivated crops and were applied as a blanket recommendation. However, for many years no studies have been conducted on site-specific fertilizer recommendation rate. The phosphorus fertilizer depends on the critical P concentration level and P requirement factor. The phosphorus critical concentration was found 10.5 mg kg−1 and phosphorus requirement factor is 16.27 mg kg−1. The soil testing centers/laboratory may use these recommendations for advisory services to end-users.
Competing Interests
The authors declare no competing interests.
1. Introduction
Many sub-Saharan African soils are weathered, fragile, and low in fertility and the major biophysical root cause of declining per capita food availability on smallholder farms of the continent is declining of soil fertility. The average amount of fertilizer use in Sub-Saharan Africa was only 8 kg per hectare of cultivated land, much lower than in other developing regions even though in similar agro-ecological zones (Morris, Kelly, Kopicki, & Byerlee, Citation2007). Phosphorus (P) is an essential element for all plants. Plants will grow slowly with low levels of P in the soil; however, for agricultural production purposes, the soil should provide a sufficient concentration of P for optimum plant growth (Tisdale, Nelson, Beaton, & Havlin, Citation2002).
Modern soil testing developed in the 1940s, and now get the precision agriculture. The soil P testing that is used today provides an indication of the level of soil P that is available to the plant during the growing period (Landon, Citation1991). Phosphorus deficiency is one of the most yield-limiting factors for annual crop production (Fageria & Baligar, Citation1996). Various extractants (Bray-1 P, Mehlich 1 and 3, Olsen-P) have been extensively used in different parts of the world to assess the plant-available soil P status (Cope & Evans, Citation1985; Sharpley, Sims, & Piezynski, Citation1994). Many of these extractants tend to under- or overestimate the P availability to plants, and reported critical soil P levels vary depending on soil type and plant species (Kamprath & Watson, Citation1980).
Fertilizer use trend of the country had been focused mainly on the use and application of nitrogen and phosphorous fertilizers in the form of di-ammonium phosphate (18-46-0) and urea (46-0-0) for almost all cultivated crops and were applied as blanket recommendation (Astatke, Mamo, Peden, & Diedhiou, Citation2004; Shahidur, Nigussie, Nicholas, & Gezahengn, Citation2013). The blanket recommendations are, regardless of considering the physical and chemical properties of the soil as well as does not take to account climatic condition and available nutrient present in the soil (Taye Bekele, Verkuijl, Mwangi, & Tanner, Citation2000). As indicated by Ketema (Citation1993), there are different blanket fertilizer recommendations for various soil types of Ethiopia for different cereal crops. N/P recommendation rates by the Ministry of Agriculture were set at 55/30, 30/40, and 40/35 N/P kg/ha for cereal crops on Vertisols, Nitisols, and Cambisols, respectively, across the country. However, the Ministry of Agriculture and Rural Development later set 100 kg ha-1 of di-ammonium phosphate (DAP) and 100 kg ha-1 of urea (Yadeta, Ayele, & Negatu, Citation2001). The blanket recommendation leads to Excess or low application of chemical fertilizers, that aggravates stunted growth of plants due to toxicity or deficiency of the essential elements (Kidanemariam & Assen, Citation2008). However, for many years no studies have been conducted on site-specific fertilizer recommendation rate. Nevertheless, since 2004 Tigray agricultural research institute has been started calibration studies for cereal crops especially for Sorghum, Tef, wheat and barley crops and developed some critical concentrations and requirement factors of phosphorous fertilizer recommendation guidelines (Kidanemariam & Assen, Citation2008; TARI, Citation2010). Therefore, this study aimed to establish soil test-based phosphorus recommendation guidelines (Pc and Pf) for barley in the District.
2. Materials and methods
2.1. Description of the study area
The study was conducted in northern Ethiopia, southern zone of Tigray, Endamekhoni district. It is 5 km from district town Maichew. According to SZTAO (Citation2000), the district falls in three main agro-ecological zones: kola (<1500 masl) weynadega (1500–2300 masl) and dega (>2300 masl). Hence, the district consists of 75% weynadega, 23% dega and 2% kola agro-ecological zones. The study area altitude range from 1922 masl to 2350 masl and classified as sub-humid agro-ecology zone where most of the mid-altitude crops such as Teff (Eragrostic tef), wheat (Triticum aestivum) and barley (Hordeum vulgare) commonly grown. The mean annual rainfall and temperature are 833 mm and 16.4°C, respectively.
2.2. Site selection
For selecting representative experimental locations, composite soil samples were collected from 20 farmers’ fields in Endamekhoni district, where barley is a dominant crop. Based on available soil P values determined by the Olsen method, fields were categorized into low, medium and high available soil P groups. The available soil phosphorus (using Olson method) ranges considered for categorization were <5 ppm P for low, 5–10 ppm P for medium, and >10 ppm P for high. Based on this classification, seven sites with low available P, four sites with medium P and two sites with high P were selected for the experiment in the district.
2.3. Experimental design, treatments and procedures
Phosphorus response experiments with barley were conducted on Cambisols at 13 sites in the Northern Ethiopian during the 2013 and 2014 cropping seasons. The treatments, comprising five levels of P fertilizer (0, 10, 20, 30 and 40 kg P ha−1), were arranged in a randomized complete block design with two replications. The plot sizes 4 m*3 m, spacing between plots, blocks and rows were 50 cm, 1 m and 20 cm, respectively.
2.4. Soil sampling and analysis
Particle size distribution was determined using the Bouyoucos hydrometer method (Bouyoucos, Citation1962). Bulk density was determined using the core method at a known volume. The pH of the soil was measured in the supernatant suspension of a 1:2.5 soil to water ratio using a pH meter (Rhoades, Citation1982). Walkley and Black (Citation1934) used for the determination of organic carbon. Total nitrogen was determined using the Kjeldahl method as described by Bremner and Mulvaney (Citation1982). Available P was determined following the Olsen method (Olsen, Cole, Watanabe, & Dean, Citation1954) using ascorbic acid as reducing agent. Available K, exchangeable cations (Ca2+, Mg2+, Na+, and K+) and CEC soil were determined by ammonium acetate method.
2.5. Determination of critical P concentrations
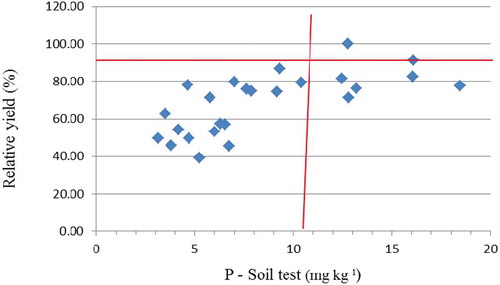
For the determination of critical values of P, the Cate-Nelson diagram method was used (Nelson & Aderson, Citation1977). Where soil P values, put on the X-axis and relative yield values on the Y-axis and a pair of perpendicular lines drawn on it to produce four quadrants displayed the relative yield. At eventually, the diagram of the results is divided into four quadrants that maximize the number of points in the positive quadrants and minimize the number of points in the negative quadrants. The observations in the upper left quadrant overestimate the fertilizer P requirement while the observations in the lower right quadrant underestimate the fertilizer requirement. The optimum is indicated by the point where the vertical line crosses the x-axis and critical P value was determined using relative grain yield against the soil test values at different rates of applied phosphorous fertilizer for a given of nutrient rate (Figure ).
2.6. Determination of P requirement factor
This factor enables one to determine the quantity of P required per hectare to raise the soil test by 1 mg kg−1 (1 part per million), and to determine the amount of fertilizer required per hectare to bring the level of available P above the critical level. It was calculated using available P values in samples collected from unfertilized and fertilized plots after 25 days starting from sowing date. Finally, the P requirement factor was obtained using the available soil test P values of the soil samples that received different P fertilizer rates. Pc and Pf were calculated as follows:
Rate of P2O5 kg/ha fertilizer to be applied = (Pc -Po) x PF
Where:
Pc = critical P concentration
Po = initial P values for the site
PF = P-requirement factor
3. Results and discussion
3.1. Soil physico-chemical characteristics of the study area
Selected physic-chemical properties of soils of the study area were characterized based on the analytical results of the soil samples taken from the surface of the experimental field before planting and the collected soil samples were analyzed at Mekelle soil research Centre.
3.1.1. Particle size distribution and bulk density
The mean value of the particle size distribution and bulk density are presented in Table . Generally, the parcels or farmlands had a Loam and sandy loam textural classes except for parcel-10, which contained high clay content. The similarity in the texture class among the parcels indicates that management practices did not affect the particles size distribution.
Table 1. Physical soil properties of the parcels
Both particle size distribution and management practice affect the bulk density of soils. However, there were slight variations among the absolute bulk density values of the parcels. Accordingly, the highest (1.68 g cm−3) and the lowest (1.21 g cm−3) bulk density values were recorded for parcels 6 and 7, respectively. The acceptable range of bulk density is <1.4 g cm-3 for sandy loam and loam agricultural soils (Hazelton and Murphy, Citation2007). The bulk density values of the parcels were laid within this range except for parcel-6. Therefore, the bulk density values of the study area were in acceptable rage unlike the parcel-10 nearly to compact to limit root penetration and restrict the movement of water and air.
3.1.2. Soil reaction (pH)
The highest and the lowest pH values were recorded in the parcels of 5 (8.9) and 10 (7.04) with the average values of 7.64 (Table ). As indicated in the table, the soil pH of the study area categorized under neutral (7.04) to strongly alkaline soils (8.9) (Hazelton and Murphy, Citation2007). This variability in pH may be due to differences in clay mineralogy, drainage conditions and soil management practices of the parcels. Different scholars reported that clay mineralogy and land management practices had an effect on soil pH (Abegaz, Van Keulen, Haile, & Oosting, Citation2007; Hailu et al., Citation2015; Landon, Citation1991). Therefore, the study area is suitable for most of the agricultural crops but series follow-up is mandatory on the high pH values observed parcels. This could affect the mobility and availability of the essential plant nutrients.
Table 2. Chemical soil properties of the parcels
3.1.3. Organic carbon and total nitrogen
Soil organic carbon values of the composite surface soil samples from the experimental plots were categorized under low and medium organic carbon content. The data in Table indicated that the organic carbon values of the parcels were at the minimal range. The minimal range observed could be due to the intensive cultivation, removal of total crop residue and insignificant addition of compost and manure to the soil. Soil organic matter (SOM) content is generally low in cultivated soils when compared to soils under grazing and forest lands (Zewdie, Citation1999). According to the soil, organic carbon rating established by Tadese (Citation1991), the results of soil analysis in this study area showed that the OC of the parcels were rated under very low and low rate except farmland 7.
Total nitrogen contents of the parcels also showed the same fashion as soil organic carbon. The deteriorating condition observed might be because of insignificant addition of organic materials and low activity of microorganism at the parcels. The highest and lowest value of TN corresponds to the farmlands containing the highest and lowest OC content. According to the TN rating established by Landon (Citation1991), the results of soil analysis in this study showed that the TN of the parcels was under low rating.
3.1.4. Available phosphorus
The highest and the lowest concentrations of available P were observed on the parcels 3 (15.03) and 10 (2.71) with mean values of 5.76 mg kg−1. Generally, the available P status of the soils in the study area are very low, indicating that soil P infertility is among the factors that are highly limiting the productivity of the soils. According to the critical values for the Olsen extractable P established by Tadese (Citation1991) for some Ethiopian soils, the available P contents of the soils in the study area were categorized under low for almost all the parcels except farmland 3. This low availability could be the consequence of different soil management practices and P fixation by Calcium sulfates under the prevalence of strong alkalinity. A research reported that the availability of P varied considerably with land use pattern, soil reaction, total P reserves and the particle size distributions of the soils. Table indicates that the available P was highly deficient in the study area next to nitrogen.
3.1.5. Exchangeable bases
The exchangeable bases analysis revealed that high variability was observed among the parcels. The data in Table indicate that exchangeable Ca followed by Mg were dominated the exchangeable sites. Exchangeable Ca content varied from 11.20 Cmolc kg−1 to from 21.01 Cmolc kg−1. This shows that the soil parent material primarily releases divalent cations. In contrast, the other two cations (Na and K) confined small proportion of exchangeable sites, which their contribution to the CEC and base saturation was a very small amount. According to Tadese (Citation1991), the study area was categorized under very high, medium, high and medium for Ca, Mg, K and Na, respectively.
3.1.6. Cation exchange capacity and base saturation
Generally, the analysis of cation exchange capacity of the study area has been found a slight variability among the parcels. As indicated in Table , the OC content of the soil is low, which indicates that the amount and type of clay colloids might have been very important in contributing to CEC values. According to the critical values established by Tadese (Citation1991), the CEC of the soils in the study area were categorized under very high rating. In contrast, the result of percent base saturation observed high variation among the parcels that the highest (97.87) and the lowest (19.99) were obtained. The variability in percent base saturation is similar to those observed to exchangeable bases because processes that affect the extent of bases also affect percent base saturation.
3.2. Critical phosphorus concentration (Pc)
Critical P (Pc) value was determined following the Cate-Nelson graphical method where soil P values were put on the X-axis and the relative yield values on the Y-axis. According to the Cate-Nelson graphical method, the critical level of Olsen-P in the top 20 cm of soil was 10.5 mg kg−1. At values of greater than or equal to 10.5 mg kg−1 crops achieved about 80% of their maximal yield without application of fertilizer and below the value will loss yield and then it needs the addition of fertilizer depending on the gap (Figure ).
Figure 1. Location map of the study area.
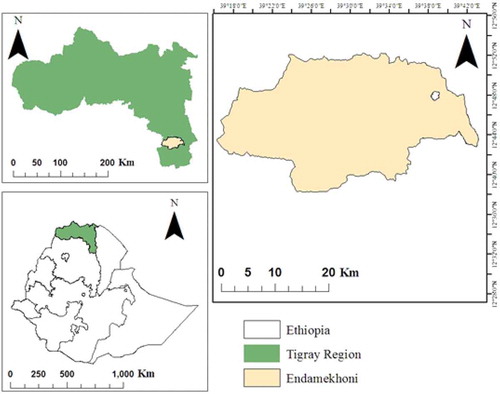
Figure 2. Relative grain yield influenced by different soil P content at 46 Kg N ha−1.
3.3. Phosphorus requirement factor (Pf)
Phosphorus requirement enables to determine the quantity of P required per hectare to raise the soil test by 1 mg kg−1, and to determine the amount of fertilizer required per hectare to bring the level of available P above the critical level. The pf computed from the difference between available P values in soil samples collected from plots, which were received 0, 23, 46, 69 and 92 kg P2O5 ha−1. As indicates in the below Table , the average value of P-requirement factor was 16.27 mg kg−1.
Table 3. Determination of P requirement factor (Pf) for Barley at Woreda Endamekhoni
3.4. Pc and Pf as a basis for P-fertilizer recommendation
When a sufficient amount of data has been generated, such information could easily be compiled as a guideline to be used by extension agents for fertilizer recommendations to smallholder farmers based on soil test values (Table ).
Table 4. P critical and P requirement factor as base of fertilizer recommendation
4. Conclusion and recommendation
Application of different rates of phosphorus fertilizer had a significance difference on grain yield. The phosphorus fertilizer depends on the critical P concentration level and P requirement factor. The phosphorus critical concentration was found 10.5 mg kg−1 and phosphorus requirement factor is 16.27 mg kg−1. Therefore, Critical P concentrations (Pc) and P requirement factors (Pf) have been determined for barley crop and which could be extrapolated to similar agro-ecological zones of the country. The soil testing centers/laboratory may use these recommendations for advisory services to end-users. Further studies should be done on phosphorous use efficiency and other related plant nutrition parameters.
Additional information
Funding
Notes on contributors
Sofonyas Dargie
Sofonyas Dargie is Soil Science researcher in Tigray Agricultural Research Institute, Mekelle Soil Research Center. Dargie graduated from Haramaya University in Soil Science in 2016. His research interests include Soil chemistry, Soil nutrient management, management of problematic soils, and environmental science.
Gidena Tasew and Birhane Hailu are soil researchers working in Mekelle Soil Research Center and Mekoni Agricultural Research Center, respectively. Kidane Welde is irrigation researcher in Alamata Agricultural Research Center and Gebru Eyasu is agroforestry and soil management researcher in Mekelle Agricultural Research Center.
References
- Abegaz, A., Van Keulen, H., Haile, M., & Oosting, S. J. (2007). Nutrient dynamics on smallholder farms in Teghane, Northern highlands of Ethiopia. In A. Bationo, B. Waswa, J. Kihara, J. Kimetu (Eds), Advances in integrated soil fertility management in Sub-Saharan Africa: Challenges and Opportunities (pp. 365-378). Springer, Netherlands.
- Astatke, A., Mamo, T., Peden, D. O. N. (2004). Participatory on-farm conservation tillage trial in Ethiopian highland vertisols: The impact of potassium application on crop yield. Expl Agric, 40, 369–10. doi:10.1017/S0014479704002029
- Bouyoucos, J. (1962). Hydrometer method improved for making particle size analysis of soil. Agronomy Journals, 54, 464–465. doi:10.2134/agronj1962.00021962005400050028x
- Bremner, J. M., & Mulvaney, C. S. (1982). Methods of soil analysis of total Nitrogen. Part 2-Chemical and microbiological properties. Agronomy, 9(2), 595–624.
- Cope, J. T., & Evans, C. E. (1985). Soil testing. Advances in Soil Science, 1, 201–228.
- Fageria, N. K., & Baligar, V. C. (1996). Response of lowland rice and common bean grow in rotation to soil fertility levels on a varzea soil. Fertilizer Research, 45, 13–20. doi:10.1007/BF00749876
- Hailu, H., Mamo, T., Keskinen, R., Karltun, E., Gebrekidan, H., & Bekele, T. (2015). Soil fertility status and wheat nutrient content in vertisol cropping systems of central highlands of Ethiopia. Agriculture & Food Security, 1–10. doi:10.1186/s40066-015-0038-0
- Hazelton, P., & Murphy, B. (2007). Interpreting soil test results: What do all the numbers mean? (2nd Ed) (pp. 152). CSIRO Publishing Australia.
- Kamprath, E. J., & Watson, M. E. (1980). Conventional soil and tissue tests for assessing the phosphorus status of soils. In F. E. Khasawneh, E. C. Sample, & E. J. Kamprath (Ed.), The role of phosphorus in agriculture (pp. 433–469). Madison, WI: ASA, CSSA, and SSSA.
- Ketema, S. (1993). Breeding, genetic resources, agronomy, utilization and role of tef in Ethiopian agriculture. Addis Ababa, Ethiopia: Ethiopian Institute of Geological Surveys, Ministry of Minesand Energy.
- Kidanemariam, A., & Assen, Y. (2008). Recommendation on phosphorus fertilizer based on soil test and response of Tef to nitrogen and phosphorus fertilizers.
- Landon, J. R. (1991). Booker tropical soil manual: A hand book for soil survey and agricultural land evaluation in the Tropics and Subtropics. New York: John Wiley and Sons Inc.
- Morris, M., Kelly, V. A., Kopicki, R. J., & Byerlee, D. 2007. Fertilizer use in African agriculture; lessons learned and good practice guidelines. doi:10.1094/PDIS-91-4-0467B
- Nelson, L. A., & Aderson, R. L. (1977). Soil testing: Correlating and interpreting the analytical results. (T. R. Peck, ed.). Madison, Wisconsin, USA: American society of Agronomy.
- Olsen, R., Cole, S., Watanabe, F., & Dean, L. (1954). Estimation of available phosphorus in soils by extraction with sodium bicarbonate (pp. 1–19). United States Department of Agriculture Circular 939.
- Rhoades, J. D. (1982). Methods of soil analysis, Part 2. 2nd A. L. Page, Miller, & D. R. Keeney, Eds. Madison, USA: American Society of Agronomy.
- Shahidur, R., Nigussie, T., Nicholas, M., & Gezahengn, A. (2013). Fertilizer in Ethiopia, an assessment of policies, value chain, and profitability. Washington, DC: The International Food Policy Research Institute (IFPRI). December 2013.
- Sharpley, A. N., Sims, J. T., & Piezynski, G. M. (1994). Innovation soil phosphorus availability indices: Assessing inorganic phosphorus. In L. P. Wilding (Ed.), Soil testing: Prospects for improving nutrient recommendations (Vol. 40, pp. 115–142). Madi-son, WI: SSSA Spec. publ. SSSA.
- STZAO (Southern zone of Tigray Agricultural Office). (2000). Technical report and interpretation of socio-economic household base line survey data. Vol-II: P 158
- Tadese, T. (1991). Soil, plant, water, fertilizer, animal manure and compost analysis. Working Document No. 13. Addis Ababa, Ethiopia: International Livestock Research Center for Africa. Longman Scientific and Technical, Essex, New York. 474p.
- Taye Bekele, H. K., Verkuijl, H., Mwangi, W., & Tanner, D. (2000). Adoption of improved wheat technologies in Adaba and Dodola Woredas of the Bale Highlands, Ethiopia. Second National Maize and Wheat Workshop, 12–16 November 2000, Addis Ababa, Ethiopia: International Maize and Wheat Improvement Center) and Ethiopian Agricultural Research Organization (EARO).
- Tigray Agricultural Research Institute (TARI). (2010). Progress report for the period from February 2003 to December 2010. Tigray.
- Tisdale, S. L., Nelson, W. L., Beaton, J. D., & Havlin, J. L. (2002). Soil and fertilizer potassium. In Addis Ababa, Ethiopia: Soil fertility and fertilizers (5thed., pp. 230–265). New Delhi: Prentice Hall India.
- Walkley, A., & Black, I. A. (1934). An examination of the Degtjareff method for determining soil organic matter and proposed chromic acid titration method. Soil Science, 37, 29–38. doi:10.1097/00010694-193401000-00003
- Yadeta, K., Ayele, G., & Negatu, W. (2001). Farming research on Tef: Small holders production practices. In H. Tefera, G. Belay, & M. Sorrels (eds.), Narrowing the Rift: Teff Research and Development. Proceeding of the International Work shop on Tef genetics and improvement (pp. 9–23), 16–19 October 2000, Addis Ababa, Ethiopia.
- Zewdie, E. (1999). Selected physical, chemical and mineralogical characteristics of major soils occurring in Chercher highlands, Eastern Ethiopia. Ethiopian Journal of Natural Resources, 1(2), 173–185.