
 ?Mathematical formulae have been encoded as MathML and are displayed in this HTML version using MathJax in order to improve their display. Uncheck the box to turn MathJax off. This feature requires Javascript. Click on a formula to zoom.
Abstract
Environmental gradients (altitude) are the factors that determine the carbon capturing the potential of a given forest. This study was conducted to determine the influence of elevation in the Yegof mountain forest’s carbon sequestration potential. A total of 57 quadrats of 20 m by 20 m, 5 m by 5 m and 1 m by 1 m with nine horizontal transect lines were used for collecting the data on tree, shrub, and herbaceous and/or soil, respectively, in the three altitudinal gradients. The vegetation and soil data were analyzed statically in one-way analysis of variance using R software. Aboveground carbon (AGC) and belowground carbon (BGC) stocks were significantly higher (P < 0.001) in upper altitude (UA) gradient with 187.3 ± 27 ton ha−1 and 37.5 ± 5.4 ton ha−1, respectively, than other gradients. However, lower altitude (LA) has a significantly higher (P < 0.05) soil organic carbon (SOC) value than the other two altitudinal gradients with 266.07 ± 51.61 ton ha−1, followed by middle altitude (MA) with 194.55 ± 26.07 ton ha−1. Nevertheless, the overall carbon sock (TCS) was higher in MA (415.3 ton ha−1) with a slight difference from the UA (414.2ton ha−1). The study has found that environmental factors have a profound effect on carbon stocks, but the effect is not similar among the four carbon pools. Carbon stock value of Yegof mountain forest was highly affected by environmental factors such as altitude. Therefore, better ecological, policy and socioeconomic concerns should be adopted in the area especially in LA than the other gradients as it possesses the poorest performance of all in the majority of carbon pools.
PUBLIC INTEREST STATEMENT
The research was conducted to understand the altitudinal gradient effect on carbon sequestration on Yegof mountain natural vegetation in North-East Ethiopia. The study area has diverse agroecology is well suited for the growth of various plant species and accumulation of carbon. Therefore, it deserves special attention for an intensive study to monitor its status of woody carbon sequestration on natural vegetation. The study has found that environmental factors have a profound effect on carbon stocks, but the effect is not similar among the four carbon pools. Carbon stock value of Yegof mountain forest was highly affected by environmental factors such as altitude. Therefore, better ecological, policy and socioeconomic concerns should be adopted in the area especially in lower altitude than the other gradients as it possesses the poorest performance of all in the majority of carbon pools.
Competing interests
We declare that we do not have competing interests.
1. Introduction
Carbon stock assessment of forests is a crucial study to highlight forest potential and role to mitigate climate change risk. It can also be influenced by different factors such as natural factors, environmental factors, physical factors and human disturbances (Hamere, et al, Citation2015). In this regard, environmental factors are a widely recognized regulator of carbon storage in forest ecosystems. Topographic characteristics of the environment such as altitude, slope and aspect are known to drive patterns of tree species distribution and influence forest carbon stock in different vegetation community (Acharya, Chettri, & Vijayan, Citation2011; Clark et al., Citation2000; McEwan et al., Citation2011; Valencia, Condit, Muller-Landau, Hernandez, & Navarrete, Citation2009). Besides altitude, it is also obvious carbon stock varies due to the presence of different tree species, soil nutrient availability, climate, disturbance and management regime (Clark & Clark, Citation2000). However, according to Moser et al. (Citation2011); and Alves et al. (Citation2010), altitude has a major impact on the biomass and carbon stock in the forest ecosystems. Thus, thorough investigation of carbon stock potential of forest in relation to environmental gradient is crucial.
On the other hand, the increase in precipitation and decrease in temperature with an increase in altitude creates change in climate along the altitudinal gradient influencing the productivity of vegetation (Gao et al., Citation2019; Tao et al., Citation2020, Citation2018) and consequently affects the quantity and turnover of soil organic matter (SOM) and organic carbon (De Castilho et al., Citation2006). Similarly, Sheikh, Kumar, Rainer, and Bussmann (Citation2009) stipulated that altitude affects the SOM by controlling soil water balance, soil erosion and geologic deposition process and this further affects the quantity of the whole carbon stock of the forest. For instance, the result of the study carried by De Castilho et al. (2006) showed that the total biomass and its carbon stock increased with altitude. Therefore, emphasizing on carbon stock assessment considering the altitudinal gradient in the forest is helpful to understand and manage the effects of environmental variables on forest carbon stocks. Hence, the relationship between forest carbon and altitude and their correlation needs also to be investigated and analyzed (Sheikh et al., Citation2009).
In this regard, a lot of studies were previously conducted including Ethiopian natural vegetation areas (Biniam, Citation2014; Tesfay, Citation2017; Bikila, Citation2014) in different parts of the country focusing on biodiversity, carbon stock and soil restoration potential (Sibhatu, Citation2015; Abate, Citation2003; Muluken, Citation2015; Sultan and Berhanu, Citation2013; Sisay, Citation2016). However, most of the studies lack an information about the country’s carbon stock potential and its interrelation with environmental gradients like altitude. In the northern part of the country, a similar pattern of studies was observed in previous studies regarding carbon stock potential of forests without considering the altitude. Even some of the studies (Abera, Citation2015: Haile, Citation2012; Mohammed & Abraha, Citation2013) conducted earlier were specifically tried to estimate the biodiversity and carbon stock potential of forests without considering environmental gradients like altitude (Tesfaye, Citation2017; Ayalew, Citation2003). However, some studies disclosed that there is a significant impact of environmental variables on carbon stock (Belay et al., Citation2014; Fentahun, Citation2016; Hamere et al., Citation2015; Muluken et al., Citation2015; Mohammed et al., Citation2014). More importantly, altitude is a significant component of the environment as it is the bases for influencing much of other abiotic and biotic component like temperature, soil, topography and vegetation (Mekonnen, Keesstra, Baartman, Stroosnijder, & Maroulis, Citation2017; Muluneh, Biazin, Stroosnijder, Bewket, & Keesstra, Citation2015; Tibebu and Teshome, Citation2015). Therefore, environmental gradient will be highly significant for a proper understanding of the driving forces for vegetation and carbon stock dynamics, proper land use planning and sustainable utilization and conservation of large watershed area. So, considering this gap on demanding scientific and immediate information about carbon stock potential and its variation along with altitude in different forest areas of the country, this study on Yegof Moutain natural vegetation was initiated and conducted. Therefore, the aim of this study was to quantify and compare the aboveground carbon stocks, belowground carbon stocks and soil carbon stocks potential of Yegof mountain natural vegetation along altitudinal gradients.
2. Materials and methods
2.1. Description of the study area
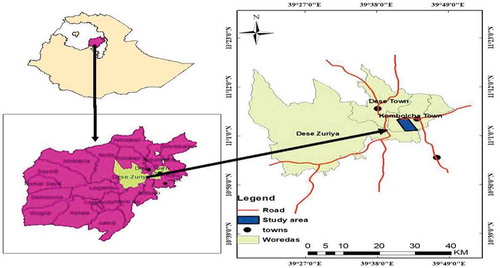
The study was conducted in Yegof mountain natural vegetation in South Wollo Zone of the Amhara Regional State, on a steep mountain ridge overlooking Kombolcha town, 376 km North of Addis Ababa, and 20–30 km West of South Wollo capital Dessie town. The site is located between 11° 01ʹ to 11° 03ʹ North latitude and 39° 4ʹ to 39° 44ʹ East longitude (Figure ). It is surrounded by 031 Birqo Kebele peasant association (PA) in the North, 040 Hara Wobelo peasant association (PA) in the West, 011 Kebele Metene PA in the South and 09 Nibar ager PA in the East (AFE, Citation2013).
Figure 1. Map of the study area
2.2. Vegetation
The vegetation is composed of natural highland trees and plantations of fast-growing exotic trees. The natural forest that once covered mountain Yegof comprised of dry evergreen, mixed conifer, and broadleaved trees (Zewde, Citation1998). At the bottom of the mountain, various plant species are evident for the presence of such indigenous species. The place is also one of the important bird areas in Ethiopia, a survey conducted in April 1996 in the area indicated 62 bird species (Bird Life International, Citation2009).
2.3. Description of the forest plantation
Broadly, the overall Yegof mountain vegetation covers 327.30 ha of land. The land use of the area was partially grazing land and partially cultivated land. During the “Derig“ regime fuel wood project that changed the land use to forestland by planting Cupressus lusitanica and Juniperus excelsa, starting from 1971–1976 GC. Consequently, the name of the forest has been Yegof Forest. During the EPDRF starting from 1986 the project phased out, the forests were transferred to the PA and it was administered by the state and additional plantation was also carried out until 1990. There is Juniperus excelsa regeneration in the forest and there are some Juniperus trees in the plantation. Moreover, the Eucalyptus trees are aged. Consequently, a considerable amount of trees is uprooting and the forest resource has been devastating from time to time. Finally, recently in the last decade, the forest was owned and manipulated by Amhara Forest Enterprise as commercial forest resource (AFE, Citation2013).
2.4. Climate, soil and topography
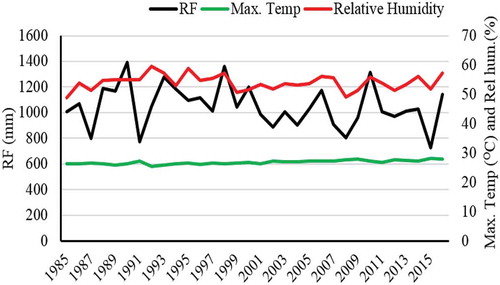
The natural forest is found with an elevation between 2050 and 3014 m above sea level. According to the closest weather station at Kombolcha town, the rainfall distribution of the area has a bimodal pattern having two seasons locally called Belg and Kermit. Belg is a short rainy period lasting from February to April, whereas kiremet extends from June to September. There is a long dry spell from the end of September to February. The area has a mean annual minimum temperature of 12.7°C and a maximum of 27.1°C (with a mean 21°C) while the average annual rainfall is about 1030 mm (Figure ). In the forested areas of the mountain, higher rainfall and cooler temperatures prevail because of altitude. The soil pH ranges from 6.0 to 7.26 and the texture varies from loam to clay loam with textural compositions of 19–28% clay, 32–41% silt and 27–46% sand (Mohammed & Abraha, Citation2013; Zewdu, Citation2002). The major landform of the forest area can be categorized into hilly (15–45%), mountaino50 USD-80%, and, of course, some part of the area is undulating plain (8–15%). The highland lakes of Ethiopia like Haik, Hardibo and Maybar are within a short distance of the forest area (Abraham, Citation2005).
Figure 2. Weather condition of study area in the past 50 years. (RF – rainfall, Max. Temp – maximum Temperatures (oC) and Rel. Hum – Relative humidity (%))
2.5. Delineation and stratification of the study area
For this study, the boundaries of the study forest area were delineated to facilitate accurate measurement and accounting of the forest carbon stocks. Global Positing System was employed for the delineation of boundary of the study area. Afterwards, the study site was classified into three altitudinal gradients: lower altitude (LA): 2050–2400 m above sea level (m.a.s.l.); middle altitude (MA): 2401–2750 m.a.s.l.; and upper altitude (UA): 2751–3014 m.a.s.l. 2050 m.a.s.l. was measured as a LA because the forest starts at this altitude value and 3014 m.a.s.l. was considered as an UA due to the boundary of the study forest stopped at this point. In order to form relatively homogenous units and obtain accurate data from the fieldwork, the systematic transect sampling by elevation segments was used since the area under the study had an altitudinal variation that helps to determine the variations in elevation as a predictor variable to relate with forest carbon stocks. In each of the sites, three parallel line transects were laid at 300 m interval that lies with parallel to the slope of the stand with 70 m away from the edge to avoid edge effect. Quadrat measuring 20 m×20 m (Hassan et al., Citation2013; Muluken et al., Citation2015; Yayneshet, Citation2011) was systematically taken for woody vegetation data collection, 5 m× 5 m for shrubs and 1 m × 1 m was established for litter, herbs and grasses (GHL), and soil sampling in each transect line. A total of 57 quadrats within 9 transects line in total (3 altitudinal gradients × 19 quadrats with three transect in each gradient) were taken with 200 m away from each other.
2.6. Data collection and measurement methods
2.6.1. Litter, herbs and grasses sampling
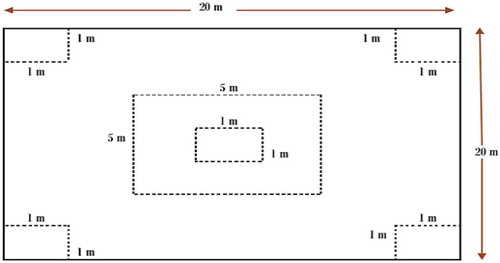
For a sampling of herbaceous vegetation (grass and herbs) and litter (GHL), 1 m × 1 m sub-quadrat at the four corner and middle positions of each main 20 m × 20 m quadrat was established (Figure ). Then, all the herbaceous plants in each quadrat including the litters were clipped at the ground level, weighed, and a 100 g composite sample that obtained from mixed sub-samples was brought to the laboratory. Then, moisture content, dry biomass and oven-dry mass were determined with proper laboratory procedure (Jina, Sah, Bhatt, & Rawat, Citation2008; Roshetko, Delaney, Hairiah, & Purnomosidhi, Citation2002) for estimating the amount of carbon stocked by GHL.
Figure 3. Diagram illustrating quadrat position in the study area (1 m × 1 m for herbaceous, little and soil sampling; 5 m × 5 m for shrub sampling; and 20 m × 20 m for tree sampling)
2.7. Soil sampling
Soil sampling was used by 1 m × 1 m sub-quadrat at all corner and middle positions of each main quadrat that used for GHL sampling were used again (Figure ). Then, using graduated 30 cm soil auger was employed to sample the soil. The soil samples were collected up to 30 cm in depth (between 0–10, 10–20 and 20–30 cm) using a calibrated soil auger (IPCC, Citation2006b). Soil samples for soil bulk density determination were collected based on their soil profile (at the middle of each transects) starting from the surface soil using 5 cm depth and 2.5 cm diameter core sampler carefully driven into the soil to avoid compaction (Roshetko et al., Citation2002). Bulk density was determined by the core method (Blake, Citation1986). A soil composite sample was obtained by mixing soil from five sub-quadrats of each main quadrat in order to determine organic carbon. Finally, a portion of the samples were stored in plastic bags, labeled, sealed and transported to the nearby soil laboratory of Sirinka Agricultural Research Centre for further chemical analysis.
2.8. Carbon stock estimation
2.8.1. Estimation of aboveground woody biomass and carbon stock
The model of Chave et al. (Citation2004) was used for estimation of aboveground woody biomass and carbon stock. The model was found to hold across tropical vegetation types, with no detectable effect of the region or environmental factors (Chave et al., Citation2004; Victor, Citation2015). According to Henry et al. (Citation2011), equations that integrate more than one tree dimension improve the reliability of forest biomass estimation. Therefore, the model of Chave et al. (2014) was used by many studies and had been the best model for carbon stock assessment in Africa (MEFCC, Citation2016; Victor, Citation2015) on the basis of climatic condition, DBH of trees and forest type of the study area to determine biomass of tree species having ≥5 cm DBH.
AGB = 0.0673 × (ρD2 H) 0.976, where AGB = aboveground biomass (kg/tree) and H = height of tree (m), D = diameter (cm) at breast height (1.3 m), and = wood density (t.m−3)
While for tree/shrub having <5 cm DBH and shrubs, allometric equations given by Brown (Citation1997) and WBISPP (Citation2000) were engaged.
AGB = (1.4277 × DSH+ (0.0088 × (DSH exp 3.0))), where AGB = above-ground sapling biomass (Kg), DSH = diameter (cm) at stumb height (1.3 m)
To convert the above-ground dry biomass to carbon, 50% of all trees and shrubs biomass was assumed to be the carbon stock. The aboveground trees and shrubs biomass carbon stock was calculated as follows:
AG TSCS = AG TSDBM × 0.5 (Brown, 2002), where AG TSCS = aboveground trees and shrubs carbon stocks, AG TSDBM = aboveground trees and shrubs dry biomass
2.8.2. Estimation of carbon stock of dead woods
For standing dead wood, biomass was estimated in a similar manner using the allometric equation of above-ground biomass. As the standing deadwood, 5%–6% subtracted for conifer species while 2%–3% for broadleaved species (Pearson et al., Citation2005).
BSDW = 0.0673 × (ρD2 H) 0.976–5.5% (2.5%), where BSDW = biomass of standing dead wood, H = height of tree (m), D = diameter (cm) at breast height (1.3 m), and ρ = wood density (t. m-3)
2.8.3. Estimation of belowground woody biomass and carbon stock
Belowground biomass (BGB) was calculated by considering 20% of the AGB (MacDicken, Citation1997). The biomass of stock density was converted to carbon stock density by multiplying 0.5 fraction of Brown (2002) default value.
BGB = AGB×0.2, where BGB = belowground trees and shrubs dry biomass, AGB = aboveground trees and shrubs dry biomass
2.8.4. Estimation of carbon stocks in dead litter, herbs and grasses
To estimate the biomass carbon stock of litter, herbs and grasses (GHLs), samples were taken from the prescribed sub-quadrats of each main quadrat. Fresh samples were weighed in the field with a 0.1 g precision and a mixed 100 g sub-sample from each main quadrat were then marked in the bag and brought to the laboratory. According to Pearson et al. (2005), the sub-samples were used to determine an oven-dry-to-wet mass ratio that was used to convert the total wet mass to oven-dry mass.
where GHL’s = biomass of leaf litter, herbs, and grasses (t. ha−1), Wfield = weight of the fresh field sample of leaf litter, herbs and grasses destructively sampled within an area of size A (kg), A = size of the area in which leaf litter, herbs and grasses were collected (ha), Wsub-sample, dry = weight of the oven-dry sub-sample of leaf litter, herbs, and grasses taken to the laboratory to determine moisture content (g), and Wsub-sample, Fresh = weight of the fresh sub-sample of leaf litter, herbs, and grasses taken to the laboratory to determine moisture content (g).
Carbon storage in herb and litter layer was computed using the following formula (Lasco et al., Citation2006):
C stored (ton ha-1) = Total dry weight × C content.
The carbon stock (C content) for the dry biomass of herbs and litters was 47% of the total dry biomass of the quadrat (IPCC, Citation2006b).
2.8.5. Estimation of soil organic carbon (SOC) stocks
To determine SOC, field moist soil was dried in an oven at 105°C for 12 h in laboratory and re-weigted to determine moisture content and dry bulk density. To estimate the percentage of organic carbon, samples were analyzed by the Walkley–Black method. The carbon stock density of SOC was calculated as given in Pearson et al. (2007) from the volume and bulk density of the soil.
V = h x π r2
where V = volume of the soil in the core sampler in cm3, h = the height of core sampler in cm which is five, and r = the radius of core sampler in cm that is 2.5.
Moreover, the bulk density of a soil sample can be calculated as follows:
where
BD = bulk density of the soil sample per quadrat, Wav, dry = average air dry weight of soil sample per quadrat, V = volume of the soil sample in the core sampler in cm3.
Then, the carbon stock in soil will be calculated as follows:
SOC = BD × d × % C
where SOC = soil organic carbon stock per unit area (ton ha−1), BD = soil bulk density (g.cm−3), d = the total depth at which the sample will be taken (30 cm), and %C = carbon concentration (%) determined in the laboratory.
2.8.6. Estimation of total carbon stocks
Finally, the total woody biomass carbon stock accumulation in all altitudinal gradients per quadrat and then per hectare was calculated by summing the biomass and carbon stock of the different pools. Therefore, the total dry biomass was finally calculated by summing all biomass pools for each quadrat and the average of all quadrats had converted to hectare as follows:
Total biomass (ton/ha) = AG TSDBM + BG TSDBM + HL DBM
where BG TSDBM = belowground trees and shrubs dry biomass (ton ha−1) AG TSDBM = aboveground trees and shrubs dry biomass (ton ha−1) GHL DBM = grass, herbs and litters dry biomass (ton ha−1)
Similar to the total biomass, the total carbon stock per quadrat and then per hectare was calculated using the following equations.
TCS (ton/ha) = (TAGC + TDWC + TBGC + C (GHL′s) + SOC)
where TCS = the total carbon stock for the total dry biomass, expressed in (ton ha−1) TAGC = carbon stock in aboveground tree biomass, expressed in (ton ha−1) TDWC = carbon stock in d wood, expressed in (ton ha−1)
TBGC = carbon stock in belowground tree biomass, expressed in (ton ha−1) C (GHL’s) = carbon stock in grass, herb and litter biomass, expressed in (ton ha−1) SOC = soil organic carbon, expressed in (ton ha−1)
2.9. Statistical analyses
All data were arranged accordingly as a fixed factor (altitude gradients) and random variables (sample plots) for each study site. General Linear Model procedures of the statistical analysis system with R-software version 3.3.3 were used to analyze vegetation and soil attribute data. One-way analysis of variance (ANOVA) was attributed to all data generated from vegetation (plant abundance, species richness, basal area, species composition, species diversity, and carbon stocks) and soil (bulk density, %C and organic carbon). Finally, the least significant difference test with P < 0.05 was employed for mean comparison between the three altitudinal gradients.
3. Results and discussions
3.1. Aboveground and belowground carbon stocks
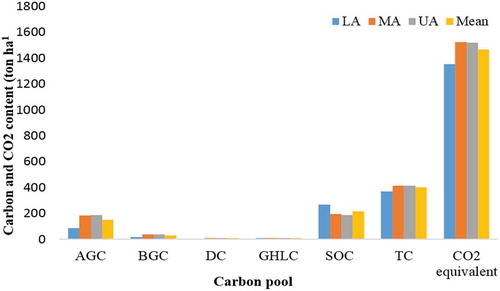
Forests have a large potential for temporary and long-term carbon storage and the forest biomass and carbon stock is influenced by altitudinal variations (Alves et al., Citation2010). The ANOVA analysis indicated that there is a significant difference in the amount of AGC in the three altitudinal gradients (P≪0.001). The highest AGC was recorded in UA gradient (187.3 ± 27 ton ha−1). However, LA had significantly lower AGC with 84.7 ± 9.2 ton ha−1 that MA (182.5 ± 23.5 ton ha−1) (P < 0.001) (Table ). This result revealed that the altitudinal gradient highly influences AGC which can be expressed in the way that as altitude increases AGC also increases. It might be also due to the topographical nature where UA is almost steep slope made itself away from human disturbance. The result is also in line with Guru et al., (Citation2012) study in India but against Juan et al., (Citation2019) which study in Colombia. The reason for such pattern might be due to the presence of large trees like Juniperus procera and Cupressus lusitanica as the altitude increases and their manipulation by legal and illegal cutting and grazing is very low. However, this result is disagree with previous findings which reported that MA had highest AGC (Kidanemariam, Citation2014, Bazezew et al., Citation2015; Fantahun, Citation2016) and LA had highest AGC (Alefu et al., Citation2015, Deresa, Citation2015 and Yelemfrhat & Soromessa, Citation2015). Similarly, there is also a significant variation in BGC between the three altitudinal gradients (P < 0.001). So, mean BGC of LA, MA and UA were 16.9 ± 1.8, 36.5 ± 4.7 and 37.5 ± 5.4 ton ha−1, respectively. This indicates that UA had significantly the highest BGC than LA (P < 0.001). Leuschner, Moser, Bertsch, Roderstein, and Hertel (Citation2007) and Zhu et al. (Citation2011) reported previous studies that above and below ground tree carbon stock decline with an increase in altitude.
Table 1. Woody mean (±SD) above and below ground carbon stock of the three altitudinal gradients
3.2. Dead woody carbon stock
Dead woody plants were recorded only in five quadrats in MA and UA. There was no any dead wood plant recovered in the LA. This indicates that there is frequent human intervention in LA by local men and women collecting for fuelwood than the above two gradients. This makes the dead plant to be immediately collected in LA. The average values of DWC for MA and UA were 0.73 and 0.36 ton/ha, respectively. However, there were no significant differences in DWC between the two altitudinal gradients (P > 0.05) (Table ). Dead wood carbon pool is found to be higher in higher altitude and low to moderate in middle and LA. This is because the higher altitude part of the vegetation is characterized by less nutrient and different environmental factors like landslide and erosions that facilitate dead wood accumulation (Tebebu and Teshome, Citation2015).
3.3. Little, herbs and grass carbon stocks (GHL)
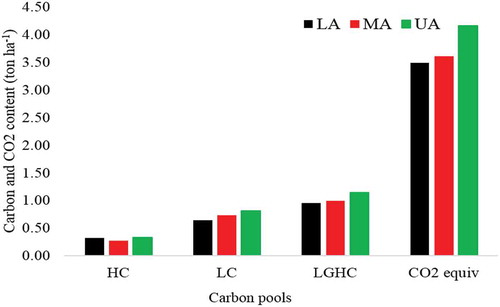
The mean GHL carbon stock of Yegof mountain was about 1.02 ± 0.4 ton ha−1(Figure ). However, there was no significant difference in GHL carbon stock of the three altitudinal gradients (P > 0.05). This insignificant altitudinal variation in GHL carbon was also reported by Alefu, et al. (2015) Bazezew et al. (Citation2015), Yelemfrhat and Soromessa (Citation2015) and Abere (Citation2016). Another argumentative idea suggests that unlike the other carbon pools, the mean carbon stock density in litter carbon pool exhibits no clear pattern with altitude (Adugna & Teshome, Citation2017). The mean GHL carbon stock for LA, MA and UA were 0.95 ± 0.08, 0.99 ± 0.028 and 1.13 ± 0.073 ton ha−1, respectively. This result indicated that the UA had slightly higher GHL carbon than the other two. LA also had slightly lower GHL carbon than the other two with MA as intermediate. The reason such variation may arises due to illegal grazing and cutting of grass for cultural and religious holidays and collection of little for fuel in lower altitudinal gradient than the other made it to possess the lowest value of GHL carbon. While, some intervention in UA caused it to have higher GHL carbon than the others. Similarly, Zhang et al. (Citation2008) indicate that the absence of such a clear pattern in litter carbon density of this study might be due to the decline in litter fall amount and decomposition with increasing altitude. However, Abel et al., (2014) disclose an increasing pattern of little carbon stock along the altitudinal gradient in mount Zequala of Ethiopia.
Figure 4. Herb and litter mean carbon stock distribution in Yegof mountain (HC = herbaceous plant carbon, LC = little carbon, LGH = little and herb carbon and CO2 = carbon dioxide equivalent GHL) (ton ha−1)
3.4. Soil organic carbon
Although, Dieleman et al. (Citation2013) and Liu and Nan (Citation2018) reported an increasing pattern of SOC with altitude in tropics and China, respectively, Sheikh et al. (Citation2009) strongly argued that the stocks of soil carbon are consistently found in decreasing pattern with increasing altitude. Statistical analysis of this study also pointed out that there was a significant difference in SOC of the three altitudinal gradients (P < 0.001) (Table ). The SOC pattern with altitude followed an inversely proportional pattern. In other words, as altitude increases, SOC will gradually decline from LA to UA. Accordingly, the LA had significantly the highest SOC value (266.07 ± 11.84 ton/ha) followed by MA (194.55 ± 5.98 ton ha−1) (P < 0.001). Kidanemariam (Citation2014) and Dagnachew (Citation2016) also reported a similar decreasing pattern of SOC with respect to altitude. However, other reports were in contrary with this pattern (Alefu et al., 2015), (Bazezew et al., Citation2015), and (Fentahun, Citation2016). The reason for decrement trend of SOC with altitude may be due to higher temperature (Zhu et al., Citation2011) in LA facilities decomposition of soils. Intensive sunlight radiation as less dominated by large trees with closed canopy in LA may also facilitate organic matter formation on the soil. On the other hand, human and animal interference is also high in LA which may lead to an accumulation of manure and other organic substance which in return might also resulted in accelerated decomposition of litters. As Kidanemariam (Citation2014), Alefu et al. (2015) and Dagnachew (Citation2016) indicated soil type, siltation as a result of soil erosion and topography and leaching and runoff may create a condition for such trend with high SOC at the lower gradient and declines as go higher in altitude.
Table 2. Means (±SD) of soil bulk density, %carbon and SOC across altitudinal gradients
3.5. Total carbon stock
The carbon stock distribution of all carbon pools within sample plots ranged from a minimum of 242.3 ton ha−1 to a maximum of 773.8 ton ha−1. However, the mean total carbon stock and CO2 equivalent values of the mountain were found to be 399.4 and 1465.8 ton ha−1, respectively (Figure ). The highest total carbon biomass was obtained in MA (415.3 ton ha−1), followed by UA (414.2 ton ha−1). While, the lowest total carbon biomass was obtained in the LA with 368.7 ton ha−1. The results indicated that, the pattern of total carbon stock in the study area was follows a humped shape pattern with the altitudinal gradient the peak carbon stock at the MA. This is because that the MA gradient had relatively vigorous performance in most of the carbon pools. This may arise due to good species diversity, environmental condition and soil characteristics in the gradient. Similarly, the pattern was also previously reported by most of the findings in Ethiopia and abroad like those by Kidanemariam (Citation2014), Bazezew et al. (Citation2015) and Abere (Citation2016). Alefu et al. (2015) and Adugna and Teshome (Citation2017) also indicated that even if there is slight difference in a downward trend in carbon stock potential of different carbon pools along with altitude but the change is no significant. This is because of better species density and environmental condition including topography is found in LA and presence of stable environmental conditions with relatively better disturbance in MA (Yelemfrhat & Soromessa, Citation2015).
Figure 5. Total carbon stock distribution in Yegof mountain
3.6. Conclusions
Environmental factors have a profound effect on carbon stocks, but the effect is not similar among the four carbon pools. The TC stocked by Yegof mountain vegetation was around 400 tons ha−1. However, there was a significant variation in ABC, BGC and SOC of the three altitudinal gradients. The highest AGC value was observed in UA gradient and the lowest in LA. This indicates that AGC increases with altitude. A similar result was also obtained for BGC as it is derived from AGC indirectly. However, regarding SOC, its relationship with altitude is inversely proportional, unlike AGC. The reason for such relationship of SOC with altitude is may be due to higher temperature facilities decomposition, intensive sunlight radiation as less dominated by large trees. Similarly, high human and animal intervention in the lower gradient had also contribute to add additional organic matter to the soil. Generally, MA had higher total carbon stock values than the others. This is due to better and stable environmental condition, topography and less intervention. This suggested an urgent need for better intervention in law enforcement and management in the area, especially in LA, as it is highly affected by illegal human and animal activity.
Cover Image
Source: Author.
Authors’ Contributions
EY planned the study, collected data, and prepared the first manuscript, TA commented on the study plan, data analysis and commented and revised the draft manuscript.
Acknowledgements
We would like to thank the local community of the study area and Sirinka Agricultural Research Centre as well as Wereda corridor of natural resource management office staff members.
Additional information
Funding
Notes on contributors
Eyob Yimer Eshetu
Eyob Yimer Eshetu working at Woldia University, Ethiopia since 2015 until know as Lecturer and Researcher. I had Bsc in General Forestry from Mekele University, Ethiopia and Msc in Range ecology and biodiversity from Haramaya University, Mekelle, Ethiopia. I am in charge of providing research, training and consultancy for farmers, Lecturer in Tigray and Amhara regional state for improving forest production and agroforestry quality. Moreover, I am conducting different researches in the area of Forest ecology.
References
- Abera, S. (2015). Estimating above ground biomass and carbon stock of four natural forests in Amhara Region, Ethiopia (Master’s Thesis), University of Natural Resources and Life sciences, (BOKU), Vienna, Austria
- Abere, F. (2016). Carbon stock of Banja Forest in Banja District, Amhara Region, Ethiopia: An implication for climate change mitigation (M.Sc), Adiss Abeba University, AA, Ethiopia.
- Abiyu, A. (2005). Effect of different restoration strategies on vegetation and soils in Tehuledere district, South Wello, Ethiopia (M.Sc. thesis), Institute of Forest Ecology University of Natural Resource and Applied Life Sciences, Vienna.
- Acharya, B. K., Chettri, B., & Vijayan, L. (2011). Distribution pattern of trees along an elevation gradient of Eastern Himalaya, India. Oecology, 37, 329–15. doi:10.1016/j.actao.2011.03.005
- Adamu, H., Bekele, T., & Dalle, G. (2012). Floristic diversity, regeneration status, and vegetation structure of woodlands in Metema Area, Amhara National Regional State, and Northwestern Ethiopia. Journal of Forestry Research, 23(3), 391−398.
- Adugna, F., & Teshome, S. (2017). Variations in forest carbon stocks along environmental gradients in egdu forest of oromia region, Ethiopia: Implications for sustainable forest management.Special Issue: Forest Ecosystem Carbon Stock Variation along Altitudinal and Slope Gradient. American journal of environmental protection, 6(1–1), 1−8. doi: 10.11648/j.ajeps.s.2017060101.11
- AFE (Amhara Forest Enterprise). (2013). Forest management plan for Yegof state forests/plantation/. Kombolcha, Ethiopia.
- Alefu, C., Teshome, S., & Eyale, B. (2015). Carbon stock in woody plants of humbo forest and its variation along altitudinal gradients: The case of humbo district, Wolaita zone, Southern Ethiopia. International Journal of Environmental Protection and Policy,3(4), 97−103. doi:10.11648/j.ijepp.20150304.13
- Alemu, B. (2014). The role of forest and soil carbon sequestrations on climate change mitigation. Environment and Earth Science, 2225-0948, 4.
- Alves, L. F., Vieira, S. A., Scaranello, M. A., Camargo, P. B., Santos, F. A. M., Joly, C. A., & Martinelli, L. A. (2010). Forest structure and live aboveground biomass variation along an elevational gradient of tropical Atlantic moist forest (Brazil). Forest Ecology Management, 260, 679–691. doi:10.1016/j.foreco.2010.05.023
- Atsbha, T. (2017). Woody species diversity and carbon sequestration potentials of Gra- Kahssu Natural Vegetation in Southern Tigray, Ethiopia (M.Sc. Thesis), Haramaya University, Haramaya, Ethiopia.
- Ayalew, A. (2003). A floristic composition and structural analysis of Denkoro forest, South Wello (M.Sc. Thesis submitted to the department of dry land bio-diversity), Adiss Abeba University, Ethiopia.
- Bird Life International. (2009). Important bird area fact sheet: Yegof forest, Ethiopia. Retrived from http://www.birdlife.org
- Blake, G. R., & Hartge, K. H. (1986). Bulk density. Methods of soil analysis. Part 1 Physical and Mineralogical Methods, 5, 363–375.
- Brown, S. (1997). Estimating biomass and biomass change of tropical forests: A primer. 134, 20–55. Rome.
- Chave, J., Condit, R., Aguilar, S., Hernandez, A., & Lao, S. R. (2004). Perez error propagation and scaling for tropical forest biomass estimates philosophical transactions of the royal societyB: Biological Sciences, 359, 409–420.
- Clark, D. B., & Clark, D. A. (2000). Landscape-scale variation in forest structure and biomass in tropical rain forest. Forest Ecology and Management, 137(3), 185–198. doi:10.1016/S0378-1127(99)00327-8
- Dagnachew, T. (2016). Carbon Stock of Meskele Gedam Forest and Its Contribution to Climate Change Mitigation. (MSc. Thesis). Addis Ababa University, Ethiopia.
- De Castilho, C. V., Magnusson, W. E., de Araújo, R. N. O., Luizao, R. C., Luizao, F. J., Lima, A. P., & Higuchi, N. (2006). Variation in aboveground tree live biomass in a central amazonian forest: Effects of soil and topography. Forest Ecology and Management, 234(1–3), 85–96.
- Deresa, A. (2015). Carbon Stock Estimation Along Altitudinal Gradient in Woodland Vegetation in Ilu Gelan District, West Shewa Zone of Oromia Region, Central Ethiopia. (MSc. Thesis). Addis Ababa University, Ethiopia.
- Eshetu, Z. (2002). Historical C3-C4 vegetation pattern on forested mountain slopes: Its implication for ecological rehabilitation of degraded highlands of Ethiopia. Journal of Tropical Ecology, 18(5), 743–758. doi:10.1017/S0266467402002481
- Gao, M., Piao, S., Chen, A., Yang, H., Liu, Q., Fu, Y. H., & Janssens, I. A. (2019). Divergent changes in the elevational gradient of vegetation activities over the last 30 years. Nature Communications, 10(1), 1–10. doi:10.1038/s41467-019-11035-w
- Gedefaw, M., Soromessa, T., & Belliethathan, S. (2014). Forest carbon stocks in woody plants of Tara Gedam forest: Implication for climate change mitigation. Science, Technology and Arts Research Journal, 3(1), 101–107. doi:10.4314/star.v3i1.16
- Girma, A., Soromessa, T., & Bekele, T. (2014). Forest carbon stocks in woody plants of Mount Zequalla Monastery and its variation along altitudinal gradient: Implication of managing forests for climate change mitigation. Science, Technology and Arts Research Journal, 3(2), 132–140. doi:10.4314/star.v3i2.17
- Guru Charan, L., Vijay, K., Bharti, S. E., Jadhav, S. K., Dorjey Angchok, S., Acharya, P. K., & Srivastava, R. B. (2012). Altitudinal variations in soil carbon storage and distribution patterns in cold desert high altitude microclimate of India. African Journal of Agricultural Research, 7(47), 6313–6319. doi:10.5897/AJAR12.1168
- Hassan-Yusuf, M., Treydte, A. C., Abule, E., & Sauerborn, J. (2013). Predicting aboveground biomass of woody encroacher species in semi-arid rangelands, Ethiopia. Journal of Arid Environments, 96, 64–72. doi:10.1016/j.jaridenv.2013.04.007
- Henry, M., Picard, N., Trotta, C., Manlay, R. J., Valentini, R., Bernoux, M., & Saint-André, L. (2011). Estimating tree biomass of sub-saharan African forests: A review of available allometric equations. Silva Fennica, 45(3B), 477–569.
- IPCC (Intergovernmental Panel on Climate Change). (2006b). Guidelines for national greenhouse inventories. In H. S. Eggleston, L. Beundia, K. Miaw, T. Ngara, & K. Tanabe (Eds.), Agriculture, forestry and other land use. Intergovernmental Panel on Climate Change (IPCC) (Vol. 4, pp. 48–49). Hayama, Japan: IPCC/IGES (Institute for Global Environmental Strategies).
- Jina, B. S., Sah, P., Bhatt, M. D., & Rawat, Y. S. (2008). Estimating carbon sequestration rates and total carbon stockpile in degraded and non-degraded sites of Oak and Pine Forest of Kumaun Central Himalaya. ECOPRINT, 15, 75–81. doi:10.3126/eco.v15i0.1946
- Kidanemariam, K. (2014). Forest Carbon Stock in Woody Plants of Ades Forest and its Variation along Environmental Factors: Implication for Climate Change Mitigation, at Western Hararghe, Ethiopia. (MSc. Thesis). Addis Ababa University, Ethiopia.
- Lasco, R. D., Macdicken, K. G., Pulhin, F. B., Guillermo, I. Q., Sales, R. F., & Cruz, R. V. O. (2006). Carbon stocks assessment of a selectively logged dipterocarp forest and wood processing mill in the philippines. Journal of Tropical Forest Science, 18(4), 166–172.
- Leuschner, C., Moser, G., Bertsch, C., Roderstein, M., & Hertel, D. (2007). Large altitudinal increase in tree root/shoot ratio in tropical mountain forest of Ecuador. Basic Applied Ecology, 8, 219–230. doi:10.1016/j.baae.2006.02.004
- Liu, N., & Nan, H. (2018). Carbon stocks of three secondary coniferous forests along an altitudinal gradient on Loess Plateau in inland China. PloS One, 13(5), e0196927. doi:10.1371/journal.pone.0196927
- MacDicken, K. G. (1997). A guide to monitoring carbon storage in forestry and agroforestry projects. Arlington, Virginia: Winrock international institute for agricultural development. p. 84.
- McEwan, W. R., Lin, Y., Sun, I. F., Hsieh, C., Su, S., Chang, L., … Chiang, J. (2011). Topographic and biotic regulation of aboveground carbon storage in subtropical broad-leaved forests of Taiwan. Forest Ecology and Management 262: 1817–1825. Taipei, Taiwan: Taiwan Forestry Research Institute.
- MEFCC (Ministry of Environment, Forest and Climate Change). (2016). Ethiopia’s forest reference level submission to the United Nations framework convention for climate change. Addis Ababa, Ethiopia.
- Mekonnen, M., Keesstra, S. D., Baartman, J. E., Stroosnijder, L., & Maroulis, J. (2017). Reducing sediment connectivity through man‐made and natural sediment sinks in the Minizr catchment, Northwest Ethiopia. Land Degradation & Development, 28(2), 708–717. doi:10.1002/ldr.v28.2
- Melese, B., Kelbessa, E., & Soromessa, T. (2014). Forest carbon stocks in woody plants of Arba Minch ground water forest and its variations along environmental gradients. Science, Technology and Arts Research Journal, 3(2), 141–147. doi:10.4314/star.v3i2.18
- Mohammed, S., & Abraha, B. (2013). Floristic composition and structure of Yegof mountain forest, South Wollo, Ethiopia. Ethiopian Journal of Sciences and Technology, 1(1), 33–45.
- Moser, G., Leuschner, C., Hertel, D., Graefe, S., Soethe, N., & Iost, S. (2011). Elevation effects on the carbon budget of tropical mountain forests (S Ecuador): The role of the belowground compartment. Global Change Biology, 17(6), 2211–2226. doi:10.1111/gcb.2011.17.issue-6
- Muluken, N ., Soromessa, T., & Bayable, E. (2015). Carbon stock in Adaba-Dodola community forest of Oromia region, Ethiopia: Implications for climate change mitigation. Academic Journal of Ecology and the Natural Environmental, 7(1), 14-22. doi:10.5897/JENE2014.0493
- Muluneh, A., Biazin, B., Stroosnijder, L., Bewket, W., & Keesstra, S. (2015). Impact of predicted changes in rainfall and atmospheric carbon dioxide on maize and wheat yields in the central rift valley of Ethiopia. Regional Environmental Change, 15(6), 1105–1119. doi:10.1007/s10113-014-0685-x
- Negasa, B. (2014). Effect of traditional rangeland management practices on vegetation structure and carbon sequestration potential in Borana Zone, Southern Ethiopia (M.Sc. Thesis), Haramaya University, Haramaya, Ethiopia.
- Pearson, T., Walker, S., & Brown, S. (2005). Source book for land-use, land-use change and forestry projects. Winrock International and the Bio-carbon Fund of the World Bank, 18–35. Arlington, USA
- Phillips, J., Ramirez, S., Wayson, C., & Duque, A. (2019). Differences in carbon stocks along an elevational gradient in tropical mountain forests of Colombia. Biotropica, 51, 490–499. doi:10.1111/btp.12675
- Roshetko, J. M., Delaney, M., Hairiah, K., & Purnomosidhi, P. (2002). Carbon stocks in Indonesian home garden systems. American Journal of Alternative Agriculture, 17(2), 1–11.
- Sheikh, M. A., Kumar, M., Rainer, W., & Bussmann, R. W. (2009). Altitudinal variation in soil organic carbon stock in coniferous subtropical and broadleaf temperate forests in Garhwal Himalaya (Vol. 4, pp. 1–6). Uttarakhand, India: Department of Forestry, HNB Garhwal University, Srinagar Garhwal. Carbon Balance management.
- Tao, J., Dong, J., Zhang, Y., Yu, X., Zhang, G., Cong, N., & Zhang, X. (2020). Elevation-dependent effects of growing season length on carbon sequestration in Xizang Plateau grassland. Ecological Indicators, 110, 105880. doi:10.1016/j.ecolind.2019.105880
- Tao, J., Xu, T., Dong, J., Yu, X., Jiang, Y., Zhang, Y., & Wang, S. (2018). Elevation‐dependent effects of climate change on vegetation greenness in the high mountains of southwest China during 1982–2013. International Journal of Climatology, 38(4), 2029–2038. doi:10.1002/joc.5314
- Tegegne, S. (2016). Vegetative structure, floristic composition and natural regeneration of a species in Ylat forest in Meket Woreda, North Eastern Ethiopia (A M.Sc. Thesis), Addis Ababa University, Ethiopia.
- Tesfay, Y. (2011). Restoration of degraded semi-arid communal grazing land vegetation using the enclosure model. Mekelle University, Mekelle, Ethiopia. International Journal of Water Resources and Arid Environments, 1(5), 382–386.
- Valencia, R., Condit, R., Muller-Landau, H. C., Hernandez, C., & Navarrete, H. (2009). Dissecting biomass dynamics in a large Amazonian forest plot. Journal of Tropical Ecology, 25, 473–482. doi:10.1017/S0266467409990095
- Victor, D. (2015). To burn or not to burn: Transition from savanna to forest in the 'm\Mise Endéfens' in Manzonzi (Bas - Congo province in the Democratic Republic of Congo). Thesis. Forest and Nature Management, Gent, Belgium.
- WBISPP (Woody Biomass Inventory and Strategic Planning Project). (2000). Manual for woody biomass inventory. Woody Biomass Inventory and Strategic Planning Project. Ministry of Agriculture, Addiss Ababa, Ethiopia.
- Wouter, D., Michelle, V., Anurag, R., Andrew, K., & Michael, B. (2013). Soil carbon stocks vary predictably with altitude in tropical forests: Implications for soil carbon storage. Geoderma. doi:10.1016/j.geoderma.2013.04.005
- Yelemfrhat, T., & Soromessa, T. (2015). Carbon stock variations along altitudinal and slope gradient in the forest belt of Simen Mountains National Park, Ethiopia. American Journal of Environmental Protection, 4(4), 199–201. doi:10.11648/j.ajep.20150404.15
- Yohannes, H., Soromessa, T., & Argaw, M. (2015). Carbon stock analysis along altitudinal gradient in gedo forest: Implications for forest management and climate change mitigation. American Journal of Environmental Protection, 4(5), 237–244. doi:10.11648/j.ajep.20150405.14
- Zewde, B. (1998). Forests and forest management in Wollo, in historical perspective. Journal of Ethiopian Studies, 31(1), 87–122.
- Zhang, X. P., Wang, X. P., Zhu, B., Zong, Z. J., Peng, C. H., & Fang, J. Y. (2008). Litter fall production in relation to environmental factors in northeast China’s forests. Journal of Plant Ecology, 32, 1031–1040.
- Zhu, B., Wang, X., Fang, J., Piao, S., Shen, S., Zhao, S., & Peng, S. (2011). Altitudinal changes in carbon storage of temperate forests on Mt Changbai, Northeast China. Carbon cycle process in East Asia, The Botanical Society of Japan and Springer 2010. Journal of Plant Resource, 10, 1–14.