
Abstract
Genotype-environment interaction (GxE) is a common phenomenon in sorghum. The effect of GxE can be reduced by identifying stable genotypes across environments. An investigation was conducted to study yield stability and adaptability of 13 sorghum genotypes across six environments. Additive Main-effect and Multiplicative Interaction (AMMI), Genotype and Genotype-Environment interaction (GGE), and stability analyses were computed. The AMMI analysis explained 68.67% of the GxE variance, while GGE captured 74.41% of the GGE variance. GGE analysis identified Kobo (KB13 and KB14) as a suitable environment for selecting generally adapted lowland sorghum genotypes. The GGE and the stability analyses further identified G13 and G2 as the least and the most desirable sorghum genotypes, respectively. Genotype G2 has high level of adaptability to the northeastern parts of Ethiopia, as evidenced by its high-yielding ability, stability and early maturity. This genotype (G2; WSV-387 x E-36-2) was released with the approval of the National Variety Release Committee in 2017. Need-based large volume seed production, dissemination over a wider area and the consequent adoption of the variety by target farmers would be convenient and fast.
PUBLIC INTEREST STATEMENT
Sorghum is one of the most important cereal crops in the lowlands of Northeast Ethiopia where moisture shortage is common. In the area, sorghum grain is used for food, and the stalk is used for cattle feed, as fire-wood and for simple construction. People prefer the late-maturing and tall sorghum types. However, as the area is prone to drought and the growing period is decreasing, early maturing sorghum varieties which are adapted to such environment are becoming vital to avert the problem of food insecurity. Sorghum genotypes have been evaluated across locations and over years to identify high-yield and stable sorghum lines. A stable genotype was identified and released as a new sorghum variety with the approval of the Ethiopian National Variety Release Committee.
Competing Interests
The authors confirm that the content of this article has no competing interests.
1. Introduction
Sorghum [Sorghum bicolor (L.) Moench] is the fifth most important cereal crop in the world, following wheat, maize, rice and barley; in 2016, about 63.9 million tons of sorghum was produced over 44.7 million ha of land. It is the second main crop, next to maize, in Africa with total production of 29.8 million tons on 30.5 million ha of cultivated land. Sorghum is among the important cereal crops grown in Ethiopia ranking third in area coverage following tef and maize, and fourth in total production. In the country, in 2016, about 1.88 million ha of land was allotted for cultivation and 4.75 million tons of sorghum was harvested (FAOSTAT, Citation2016). Based on the production and harvested area, the productivity in Ethiopia would be 2.5 tons ha−1, which is very low as compared to the potential yield of the crop. Nevertheless, sorghum grain yield of the order of 3.9 to 5 tons ha−1 was reported on research fields in northern Ethiopia (Worede et al., Citation2016).
Sorghum is cultivated in Ethiopia mainly as food crop unlike some countries where the grain is produced for cattle. Farmers, however, prefer late-maturing tall varieties as they use the stalk as feed for livestock and as fuel. Even so, the long cycle varieties are being replaced by early maturing short-stalked types, as a result of progressive reduction of the growth period, especially in the lowland areas where moisture shortage is a common phenomenon. So far 48 sorghum varieties have been released and registered in Ethiopia (MoANR, Citation2016) for different agro-ecological zones (AEZ) varying in altitude, temperature and rainfall. Nonetheless, most of the varieties are recommended for specific AEZs, and no variety is adapted to all the environments existing in Ethiopia due to the effects of genotype-environment interaction (GxE). GxE not only affects grain yield (Admas & Tesfaye, Citation2017; Adugna, Citation2007; Nida et al., Citation2016), but also nutritional quality and content (Beta & Corke, Citation2001; Wirnas et al., Citation2015), physicochemical properties and malting quality (Palé et al., Citation2010), and total soluble solids (De Souza et al., Citation2013) in sorghum.
Unraveling the causes of GxE is essential at all stages of plant breeding (Jackson et al., Citation1998). It is also important to identify ideal test environments and genotypes (Gauch & Zobel, Citation1997; W. Yan & Hunt et al., Citation2000; W. Yan & Tinker, Citation2006). To obtain a better perspective on GxE in any crop, testing of genotypes across a number of locations and years (environments) is necessary. In the presence of large GxE, additional testing sites may be needed, thus increasing the cost of variety development (Kang, Citation1996).
The effect of GxE can be reduced by identifying stable genotypes across environments (Eberhart & Russell, Citation1966). There are a number of stability statistics. Cultivar superiority (Lin & Binns, Citation1988), static stability (Becker & Leon, Citation1988), ecovalence (Wricke, Citation1962), mean and variance of the ranks, and means absolute differences of pairs of ranks (Nassar & Huehn, Citation1987) are some of the stability statistics used these days. To ensure high grain yield in the short term and food security in the long term, sorghum varieties with high yielding potentials, better stability and adaptability are needed. Especially in developing countries where developing specifically adapted varieties is costly, identifying stable variety (adapted to wider environments) should be emphasized. The objectives of the present investigation were to study yield stability and adaptability of lowland sorghum genotypes in the moisture-deficit areas of Northeast Ethiopia.
2. Materials and methods
The experiment was conducted at three experimental sites of Sirinka Agricultural Research Center: Jari, Chefa and Kobo. These locations represent the lowland sorghum growing areas of northeast Ethiopia. Kobo (12°8ʹ21”N/39°18ʹ21”E) is situated at 1450 m above sea level (asl), has Eutric fluvisol, receives 637 mm annual rainfall, and has min and max temperatures of 15.8 and 29.1°c, respectively. Chefa (10°57ʹN/39°47ʹE) is located at 1600 m asl, has Vertisol, receives 850 mm annual rainfall, and has min and max temperatures of 11.6 and 30.4°c, respectively. Jari (11°21ʹN/39°38ʹE) has an altitude of 1680 m asl, and characterized by Vertisol. The trial was executed during the main rainy season (July to December) of 2013 and 2014.
A total of 11 sorghum genotypes, previously received from the national sorghum research program of Ethiopia, Melkasa agricultural research center, were tested. The materials were lines developed by crossing locally adapted sorghum landraces, and they have attained homozygosity. Cultivars Miskir and Jigurti were added for comparison as standard and local checks, respectively. The treatments were laid out in a randomized complete block design (RCBD) with three replications. The sorghum genotypes were planted in 5 m by 3.75 m plot size using 75 and 15 cm spacing between rows and plants, respectively. Fertilizer was applied at the rate of 50 and 100 kg ha−1 as Urea and Diammonium Phosphate (DAP), respectively. Data were collected on days to heading, days to maturity, plant height (cm), head weight (t ha−1), thousand-seed weight (g) and grain yield (t ha−1).
Analysis of variance, for the data combined across locations and over years, was carried out by CropStat 7.2 software. Significant trait mean values were separated by using Duncan’s multiple range test (DMRT; 5%). Additive Main-effect and Multiplicative Interaction (AMMI), Genotype and Genotype-Environment interaction (GGE) and stability analyses were computed by using Genstat software.
Cultivar superiority of genotypes was computed as per Lin and Binns (Citation1988). Static stability was measured by using the variance of a genotype across environments (S2xi). A desirable genotype will not react to changing environmental conditions (Becker & Leon, Citation1988); hence will have smaller environmental variance. Ecovalence (Wi) is a stability measure which is the GxE effects for each genotype, squared and summed across the test environments (Wricke, Citation1962). The mean and variance of the ranks of each genotype across the environments, as well as the absolute differences of pairs of ranks were based on Nassar and Huehn (Citation1987).
3. Results and discussion
3.1. Analysis of variance
The result of the analysis of variance for the data combined across locations and over years is presented in Table . The analysis showed highly significant (P < 0.01) difference for genotypes, location, year and LxY effects for the traits considered in the experiment. The GxL was highly significant (P < 0.01) for days to heading, thousand-seed weight and grain yield, while GxY was highly significant (P < 0.01) for days to heading, thousand-seed weight, and significant (P < 0.05) for plant height. GxLxY effect was highly significant (P < 0.01) for das to heading, plant height and thousand-seed weight. In concordance with the present finding, Human et al. (Citation2011), Teodoro et al. (Citation2016), and Mare et al. (Citation2017) observed significant differences of G, L and GxL effects for grain yield. Gasura et al. (Citation2015) obtained significant differences for L (P < 0.001), Y (P < 0.001), LxY (P < 0.01), G (P < 0.01), GxL (P < 0.001)). Filho et al. (Citation2014) documented significant (P < 0.01) G, L and GxL effects on grain yield of sorghum hybrids. Hassan & Gamar et al. (Citation2015), Nida et al. (Citation2016), and Admas and Tesfaye (Citation2017) reported significant (P < 0.01) difference in grain yield for all the sources of variations. The presence of significant GxE in this experiment necessitates further analyses to determine the magnitude of GxE and separate into component multiplicative terms, and to estimate yield stability of the genotypes.
Table 1. Analysis of variance of 13 sorghum genotypes tested at three locations for two years
3.2. Performance of the genotypes
The mean values of the sorghum genotypes for the traits considered are depicted in Table . Genotype 11 and G2 were the first and second highest-yielding genotypes with the yield of 4.793 and 4.717 t ha−1, respectively; while Jigurti (G13; 3.348 t ha−1) was the least. With regards to thousand-grain weight, Jigurti (36.31 g) and G7 (36.11 g) were comparatively large seeded genotypes whereas Miskir (G12; 26.12 g) and G1 (28.53 g) were small seeded types. The two high yielding genotypes, G2 and G11, had higher head weight, 8.737 and 8.514 t ha−1, respectively; however Jigurti (G13) had the lowest (6.709 t ha−1) head weight.
Table 2. Mean grain yield and other agronomic traits of sorghum genotypes tested at three locations for two years
Likewise, Jigurti (302.4 cm) followed by G5 (208.9 cm) and G4 (204.9 cm) were the tallest whereas G1 (119 cm), G2 (132.6 cm) and G6 (140.9 cm) were shorter genotypes. Miskir (G12) and Jigurti (G13) took 79 and 78.9 days to heading while G1, G2 and G11 took 68.6, 70.2 and 72 days, respectively. The trend of maturity was also similar to days to heading. Jigurti (G13) and Miskir (G12) took 128.6 and 124.4 days, respectively; while G1 (114.4), G2 (116.4) and G11 (117) were relatively early to mature.
When the grand mean values of the six environments were compared, CH13 (6.399 t ha−1) followed by KB14 (4.842 t ha−1) had higher sorghum grain yield, while JR14 (2.283 t ha−1) had the smallest sorghum grain yield. Environments CH13 and JR14 could, therefore, be regarded as the highest and the lowest yielding environments, respectively. Miskir (7.221 t ha−1) and G2 (2.859 t ha−1) were the highest-yielding genotypes on the high- and low-yielding environments, respectively (Table ).
Table 3. Mean grain yield (t ha−1) of 13 sorghum genotypes across six environments (location and year combinations)
3.3. Stability analyses
The estimates of six stability coefficients for the 13 sorghum genotypes which were computed based on six environments (location and year combination) are displayed in Table .
Table 4. Stability coefficients for grain yield of 13 lowland sorghum genotypes tested on six environments (three locations and two years)
Based on cultivar superiority stability statistic, G11 (0.1162) and G2 (0.1372) were the most stable, as they had comparatively smaller values; Jigurti (1.9123) and G7 (0.7701) were the least stable.
Smaller values of static stability coefficients were estimated for G1 (1.377) and G2 (1.679), which indicates these varieties are more stable based on this concept of stability. However, Miskir and Jigurti which had relatively larger values (3.101 and 3.074) were least stable. Although static stability is usually associated with a relatively poor yield level (Becker & Leon, Citation1988), G2 maintained higher grain yield.
A genotype with Wi = 0 is considered as stable based on Wricke (Citation1962). Accordingly, G6 and G2 which had values of 0.172 and 0.273, respectively, were the most stable. Jigurti with value of 2.683 and G5 with 2.414 were least stable. Showemimo (Citation2007) identified six sorghum genotypes with low ecovalence values and higher grain yield.
Based on mean rank stability coefficients, G11 (3.167) and G2 (3.333) were ranked first and second. However, Jigurti (11.833) and G7 (9.833) were least stable genotypes. Means absolute differences of pairs of ranks (MADPR) identified Jigurti (1.933) and G2 (2.133) to be most stable genotypes; Miskir (5.867) and G5 (5.533) as least stable. According to variances of ranks, G2 (3.07) and G7 (3.77) were the first two stable genotypes, while G12 (23.47) and G5 (20.30) were the least stable.
Cultivar superiority and mean ranks stability coefficients ranked G11 first; while G2 was ranked first by variances of ranks, and second by the rest (five) of the stability coefficients. In contrast, Jigurti, Miskir and G5 were unstable genotypes.
3.4. AMMI analysis
The AMMI analysis of variance (Table ) showed that the genotypes (G), environments (E) and the interaction (GxE) are significant (P < 0.01). The G, E and GxE terms also explained 6.37, 83.01 and 10.6% of the treatment sum of squares (SS), respectively. Although the E term explained most of the variance, 83.01% in the present study, only the G and GxE terms are relevant as they affect the ranking of the genotypes (Gauch & Zobel, Citation1997). In line with this, Alagarswamy and Chandra (Citation1998) discovered 12, 61 and 27% of the total variation to be accounted for by differences in G, E and GxE, respectively. Adugna (Citation2007) reported 5.9, 73.8 and 20.3% to be attributed to G, E and GxE, respectively. Admas and Tesfaye (Citation2017) found out 4.61, 85 and 10.49% of the treatment variation to be explained by G, E and GxE, respectively. Similarly, Al-Naggar et al. (Citation2018) revealed that G, E and GxE contributed 14.17, 60.55 and 24.88% to the total variance, respectively.
Table 5. The AMMI analysis of variance for grain yield of 13 sorghum genotypes on six environments
The GxE was also partitioned into two significant (P < 0.01) Interaction Principal Component Axes (IPCAs), and the first and the second IPCAs explained 37.69 and 30.93% of the GxE, respectively (Table ). In congruence with the present finding, Alagarswamy and Chandra (Citation1998) indicated that 59% of the total variance of GxE was captured by the first (42%) and second (17%) interaction vectors. Adugna (Citation2007) explained the total interaction by the first (50.7%) and second (18%) significant IPCAs. Filho et al. (Citation2014) divided the GxE (GxL) effect into two significant (P < 0.01) IPCAs, contributing 65.98% to the interaction SS. Human et al. (Citation2011), however, explained the GxE by three significant (P < 0.05) IPCAs with 45.53, 29.87 and 13.21% contribution. In contrast, only one significant IPCA was reported by Admas and Tesfaye (Citation2017).
The AMMI1 biplot (Figure ) depicted that G11 and G2 were higher-yielding genotypes; genotypes G5, G9, G1, G4 and Miskir had more than average grain yield. Genotype G3 had grain yield as equal as the grand mean value; while G6, G10, G8 and G7 had below average grain yield. Nevertheless, Jigurti was the lowest yielder. Moreover, Jigurti, G8, G1 and G5 had high GxE. In contrast, G7, G3, G4, G6, G2 and G10 had lower GxE; the rest had moderate GxE.
Figure 1. AMMI biplot of main effects of sorghum genotypes and environments, and IPCA1 using symmetrical scaling. CH13 = Chefa 2013, CH14 = Chefa 2014, JR13 = Jari 2013, JR14 = Jari 2014, KB13 = Kobo 2013, KB14 = Kobo 2014. Abbreviations of genotypes are given in Table
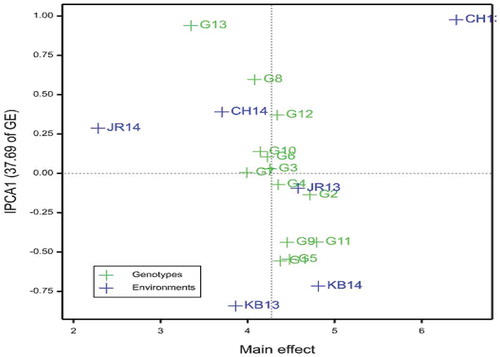
By the same token, environment CH13 had the highest grain yield. Environments KB14 and JR13 also had above average grain yield. Nonetheless, JR14, CH14 and KB13 had below average yield; hence they were low-yielding environments. Besides, CH13, KB13 and KB14 contributed higher to the interaction, in that order. Environment JR13 had the lowest contribution to the interaction while that of JR14 and CH14 was moderate (Figure ).
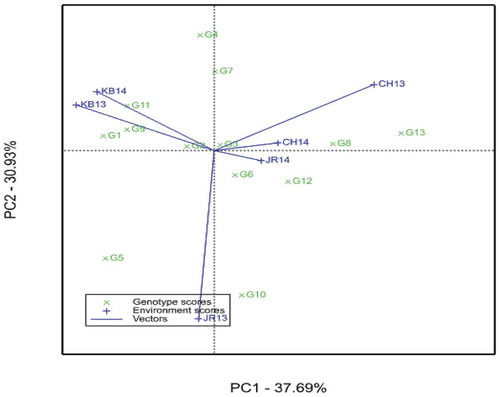
In the AMMI2 biplot, when G and E are plotted against PCA1 and PCA2, the length of the environmental vectors from the origin indicates the magnitude of interaction exerted by the environments on the genotypes (Voltas et al., Citation2002). Likewise, the distance of the genotypes from the origin shows the responsiveness of the genotypes to different environmental conditions. The AMMI2 biplot showed that CH13 and JR13 exerted higher interaction and hence these environments have higher genotype discriminating ability than the others; KB13 and KB14 exerted moderate interaction. Whereas JR14 and CH14 exerted the least GxE to the system, indicating that these two environments are more representative but least discriminating. Similarly, G13, G10, G5 and G4 had higher GxE (far from the origin), consequently they were more responsive to environmental changes and hence specifically adapted to the environments. In contrast, G2, G3 and G6 had lower interactions as they were close to the origin and hence were less sensitive to environmental changes; they are wide adapted genotypes. The rest, however, had moderate interaction (Figure ). Similar results were reported by Al-Naggar et al. (Citation2018).
Figure 2. AMMI biplot of sorghum genotypes and environments plotted against PCA1 and PCA2 using symmetrical scaling. CH13 = Chefa 2013, CH14 = Chefa 2014, JR13 = Jari 2013, JR14 = Jari 2014, KB13 = Kobo 2013, KB14 = Kobo 2014. Abbreviations of genotypes are given in Table
3.5. GGE analysis
In the GGE analysis (Figure ), the first two PCAs captured 74.7% (PCA1 = 55.09, PCA2 = 19.32) of the GGE variance. The present result is in agreement with Mare et al. (Citation2017) in that the authors reported 76.59 % (PCA1 = 50.72, PCA2 = 25.82%) of the variance to be accounted for by the first two PCAs. Gasura et al. (Citation2015) also reported 36.8 and 29.5% of the GGE variance to be explained by the first and the second PCAs, respectively. Ideal genotype should have both high mean performance (large PC1) and high stability (small absolute PC2) across environments (W. Yan & Hunt et al., Citation2000; W. Yan & Rajcan, Citation2002), and it is pointed by the arrow at the center of the concentric circles (W. Yan & Tinker, Citation2006).
Figure 3. GGE biplot of sorghum genotypes on 6 environments using genotype-centered scaling. CH13 = Chefa 2013, CH14 = Chefa 2014, JR13 = Jari 2013, JR14 = Jari 2014, KB13 = Kobo 2013, KB14 = Kobo 2014. Abbreviations of genotypes are given in Table
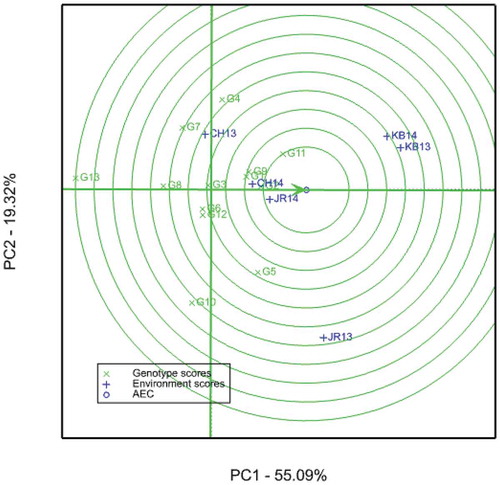
The ideal genotype is a reference used to identify suitable genotypes in comparison to it. Genotypes located closer to the ideal genotype are more desirable than others (W. Yan & Tinker, Citation2006). Hence, G11 and G2 are very close to the ideal genotype as compared to others. These two genotypes could be considered as suitable genotypes for the six environments. In contrast to this, Jigurti is the least suitable as it is very far from the concentric circle, ideal genotype (Figure ). Different authors such as Gasura et al. (Citation2015), Nida et al. (Citation2016), Mare et al. (Citation2017), and Al-Naggar et al. (Citation2018) used this stability parameter to identify suitable (high yielding and stable) sorghum genotypes.
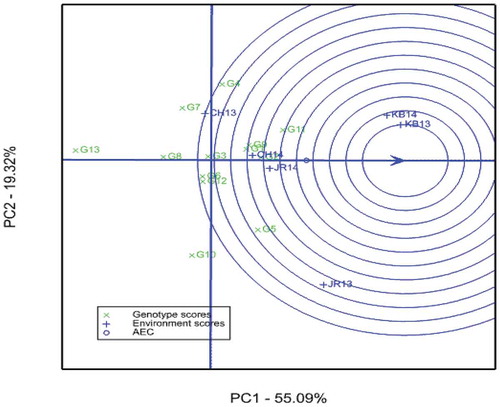
The length of the environment vectors is a measure of the discriminating ability of the environments (W. Yan & Tinker, Citation2006). Therefore, KB13 and KB14 are more discriminating environments (Figure ). Environment CH13, conversely, was the least discriminating or non-informative. A test environment with smaller angle with the average-environment axis (AEA) is more representative than the others (W. Yan & Tinker, Citation2006). Hence, CH14 and JR14 were more representative, but less discriminating as they had shorter distance from the origin. Environments KB13 and KB14 could be regarded as suitable environments as they are very close to the ideal environment. It is also stated by W. Yan and Tinker (Citation2006) that environments that are both discriminating and representative are good test environments for selecting generally adapted genotypes. Kobo (KB13 and KB14), therefore, is a good environment for selecting generally adapted lowland sorghum varieties. The result is in agreement with the finding of Adugna (Citation2007). The environment CH13, however, was the least suitable environment (Figure ). In congruence with the current investigation, Mare et al. (Citation2017) reported the presence of representative and poor discriminating, representative and discriminating, and discriminating and less representative sorghum growing environments in Zimbabwe.
Figure 4. GGE biplot view to rank the 6 sorghum growing environments using environment-centered scaling. CH13 = Chefa 2013, CH14 = Chefa 2014, JR13 = Jari 2013, JR14 = Jari 2014, KB13 = Kobo 2013, KB14 = Kobo 2014. Abbreviations of genotypes are given in Table
The genotype G2 was high yielding, stable and had other desirable traits like higher head weight and early maturity. This genotype has high level of adaptability to the northeastern lowland parts of Ethiopia where sorghum is economically important, moisture-deficit is common and the growth period of sorghum is becoming shorter and shorter. This genotype (G2; WSV-387 x E-36-2) was released by the name Alene following the approval of the National Variety Release Committee of Ethiopia in 2017 as it is suitable for the environments under consideration, lowlands of northeast Ethiopia.
Dissemination of this variety to a wider area would be not so difficult and the consequent adoption by target farmers would be fast. Furthermore, need-based large volume seed production of the variety would be convenient.
Cover Image
Source: Author
Acknowledgements
The research work was supported by the Amhara Regional Agricultural Research Institute (ARARI). The help of Solomon Mitiku and Yibeltal Eniyih is highly appreciated.
Additional information
Funding
Notes on contributors
Fisseha Worede
The research group is composed of researchers working on breeding of crops for dry lowland areas. The researchers are working on evaluation and selection of breeding lines adapted to terminal moisture stressed areas. The group has released a number of crop varieties adapted to Northeast part of Ethiopia. Research areas include tolerance to drought and biotic stress like disease, insects and parasitic weeds like Striga.
References
- Admas, S., & Tesfaye, K. (2017). Genotype-by-environment interaction and yield stability analysis in sorghum (Sorghum bicolor (L.) Moench) genotypes in North Shewa, Ethiopia. Agriculture and Environment, 9, 82–13. https://doi.org/10.1515ausae-2017-0008
- Adugna, A. (2007). Assessment of yield stability in sorghum. African Crop Science Journal, 15(2), 83–92. http://dx.doi.org/10.4314/acsj.v15i2.54421
- Alagarswamy, G., & Chandra, S. (1998). Pattern analysis of international sorghum multi-environment trials for grain-yield adaptation. Theoretical and Applied Genetics, 96, 397–405. https://doi.org/10.1007/s001220050755
- Al-Naggar, A. M. M., Abd El-Salam, R. M., Asran, M. R., & Yaseen, W. Y. S. (2018). Yield adaptability and stability of grain sorghum genotypes across different environments in Egypt using AMMI and GGE-biplot models. Annual Research and Review in Biology, 23(3), 1–16. https://doi.org/10.9734/ARRB/2018/39491
- Becker, H. C., & Leon, J. (1988). Stability analysis in plant breeding. Plant Breeding, 101, 11–23. https://doi.org/10.1111/j.1439-0523.1988.tb00261.x
- Beta, T., & Corke, H. (2001). Genetic and environmental variation in sorghum starch properties. Journal of Cereal Science, 34, 261–268. https://doi.org/10.1006/jcrs.2000.0379
- De Souza, V. F., Da Costa Parrella, R. A., Tardin, F. D., Costa, M. R., De Carvalho Júnior, G. A., & Schaffert, R. E. (2013). Adaptability and stability of sweet sorghum cultivars. Crop Breeding and Applied Biotechnology, 13, 144–151. https://doi.org/10.1590/S1984-70332013000200007
- Eberhart, S. A., & Russell, W. A. (1966). Stability parameters for comparing varieties. Crop Science, 6(1), 36–40. https://doi.org/10.2135/cropsci1966.0011183X000600010011x
- FAOSTAT. (2016). Retrieved January 12, 2018, from http://www.faostat.fao.org/site/567/default.aspx
- Filho, J. E. A., Tardin, F. D., Daher, R. F., Barbé, T. C., Paula, C. M., Cardoso, M. J., & Godinho, V. P. C. (2014). Stability and adaptability of grain sorghum hybrids in the off-season. Genetics and Molecular Research, 13(3), 7626–7635. https://doi.org/10.4238/2014.March.24.24
- Gasura, E., Setimela, P. S., & Souta, C. M. (2015). Evaluation of the performance of sorghum genotypes using GGE biplot. Canadian Journal of Plant Science, 95, 1205–1214. https://doi.org/10.4141/cjps-2015-119
- Gauch, H. G., & Zobel, R. W. (1997). Identifying mega-environments and targeting genotypes. Crop Science, 37, 311–326. https://doi.org/10.2135/cropsci1997.0011183X003700020002x
- Hassan, E. I., Gamar, Y. A., Elzein, I. N. E., Ali, A. M., & Ahmed, T. E. (2015). Performance of sorghum recombinant inbred lines (RIL) developed for rain-fed areas of Sudan. Journal of Agricultural Sciences, 60(4), 395–406. https://doi.org/10.2298/JAS1504395H
- Human, S., Andreani, S., Sihono, S., & Indriatama, W. M., & Sihono and Indriatama, W.M. (2011). Stability test for sorghum mutant lines derived from induced mutations with gamma-ray irradiation. Atom Indonesia, 37(3), 102–106. https://doi.org/10.17146/aij.2011.76
- Jackson, P., Robertson, M., Cooper, M., & Hammer, G. L. (1998). The role of physiological understanding in plant breeding: From a breeding perspective. Field Crops Research, 49, 11–37. https://doi.org/10.1016/S0378-4290(96)01012-X
- Kang, M. S. (1996). Using genotype-by-environment interaction for crop cultivar development. Advances in Agronomy, 62, 199–252. https://doi.org/10.1016/S0065-2113(08)60569-6
- Lin, C. S., & Binns, M. R. (1988). A superiority measure of cultivar performance for cultivar x location data. Canadian Journal of Plant Science, 68, 193–198. https://doi.org/10.4141/cjps88-018
- Mare, M., Manjeru, P., Ncube, B., & Sisito, G. (2017). GGE biplot analysis of genotypes by environment interaction on Sorghum bicolor L. (Moench) in Zimbabwe. African Journal of Plant Science, 11(7), 308–319. https://doi.org/10.5897/AJPS
- MoANR. (2016). Crop variety register (Issue No. 19). Plant variety release, protection and seed quality control directorate.
- Nassar, R., & Huehn, M. (1987). Studies on estimation of phenotypic stability: Test of significance for non-parametric measures of phenotypic stability. Biometrics, 43, 45–53. https://doi.org/10.2307/2531947
- Nida, H., Seyoum, A., & Gebreyohannes, A. (2016). Evaluation of yield performance of intermediate altitude sorghum (Sorghum bicolor (L.) Moench) genotypes using genotype x environment interaction analysis and GGE biplot in Ethiopia. International Journal of Trends in Research and Developement, 3(2), 2394–9333. http://www.ijtrd.com/papers/IJTRD3499.pdf
- Palé, S., Taonda, S. J. B., Bougouma, B., & Mason, S. C. (2010). Water and fertilizer influence on sorghum grain quality for traditional beer (dolo) production in Burkina Faso. African Journal of Food Science, 4(11), 723–734.
- Showemimo, F. A. (2007). Grain yield response and stability indices in sorghum (Sorghum bicolor (L.) Moench). Communications in Biometry and Crop Science, 2(2), 68–73.
- Teodoro, P. E., Filho, J. E. A., Daher, R. F., Menezes, C. B., Cardoso, M. J., Godinho, V. P. C., Torres, F.E., & Tardin, F. D. (2016). Identification of sorghum hybrids with high phenotypic stability using GGE biplot methodology. Genetics and Molecular Research, 15(2). https://doi.org/10.4238/gmr.15027914
- Voltas, J., Van, E. F., Igartua, E., Del Moral, L. F. G., Molina-Cano, J. L., & Romagosa, I. (2002). Genotype by environment interaction and adaptation in barley breeding: Basic concepts and methods of analysis. In G. A. Slafer, J. L. Molina-Cano, R. Savin, J. L. Araus, & I. Romagosa (Eds.), Barley Science: Recent advances from molecular biology to agronomy of yield and quality (pp. 205–241). The Harworth Press Inc.
- Wirnas, D., Sopandie, D., & Tesso, T., & Trikoesoemaningtyas. (2015). Genotypes x environment interaction effect on nutritional quality of sorghum lines in Indonesia. Ekin Journal of Crop Breeding and Genetics, 1–2, 26–31.
- Worede, F., Gashaw, A., Mamo, M., Gebre-Mariam, T., & Assefa, S. (2016). Response of sorghum genotypes in moisture stressed areas of eastern Amhara, Ethiopia. In A. Dejen, R. Hassan, & A. Tessema (Eds.), Proceedings of the 4th National Annual Research Conference (pp. 18–24). Wollo University, Dessie, Ethiopia. 7–8 May 2015.
- Wricke, G. (1962). Method of understanding the biological diversity in field research. Pfianzenzuchtg, 47, 92–146.
- Yan, W., Hunt, L. A., Sheng, Q., & Szlavnics, Z. (2000). Cultivar evaluation and mega-environment investigation based on GGE biplot. Crop Science, 40, 596–605. https://doi.org/10.2135/cropsci2000.403597x
- Yan, W., & Rajcan, I. (2002). Biplot analysis of test sites and trait relations of soybean in Ontario. Crop Science, 42, 11–20. https://doi.org/10.2135/cropsci2002.1100
- Yan, W., & Tinker, N. A. (2006). Biplot analysis of multi-environment trial data: Principles and applications. Canadian Journal of Plant Science, 86, 623–645. https://doi.org/10.4141/P05-169