
 ?Mathematical formulae have been encoded as MathML and are displayed in this HTML version using MathJax in order to improve their display. Uncheck the box to turn MathJax off. This feature requires Javascript. Click on a formula to zoom.
Abstract
Though climate change is a global agenda since the last few decades, local and regional changes are not well documented in third-world nations. Therefore, understanding the local circumstances of climate change is vital to exert context specific responses to allay its adverse effects. This study hence assessed small holder farmers’ perception and response mechanisms to climate change and their determinants in Tekeze lowland goat and sorghum livelihood zone, Northeast Ethiopia. Data collected from 260 sample respondents were analyzed in descriptive statistics and econometric model. Results revealed that 86.5% of the respondents observed changes in main climatic patterns, whereas 92.3% of them recognized variability in daily weather. Indeed, 76.8% and 83.5% of respondents perceived a rising temperature and decreasing rainfall, respectively. This finding is in line with the regression results of meteorological data recorded for 20 study years in the area. Among respondents who perceived the climate change, nearly two-third were responded through crop, livestock and nonagriculture-based livelihood initiatives. The probit model also discovered that educational status, farm/nonfarm income, extension contact, access to climate information and training were significant factors behind farmers’ response decision. As a result, future development interventions should provide prominent training and extension, local meteorological service and agricultural inputs on top of creating nonagricultural income generating opportunities, would play significant role in climate change adaptation.
PUBLIC INTEREST STATEMENT
A continuous nature of change in climate requires understanding how farmers are mindful to guide actions suitable for imminent intervention. As a result, it is pertinent to undertake location-specific investigation, since perceptions and responses to climate change are contextually and spatially inconsistent. Usually, understanding the local dimensions of climate change is indispensable for development practitioners for two main reasons: first, to put in place supportive actions as well as to device community wise policy directives. On the other hand, knowledge on the lived response mechanisms to climate change is worthwhile for stakeholders to capitalize on superb intervention options.
Competing Interests
The authors declares no competing interests.
1. Introduction
Nowadays, climate change is clapped as among the most difficult and complex problems challenging the world (IPCC, Citation2014). As it represents new threats and challenges to several households, social groups and regions worldwide, climate change has become the central scientific, political and socioeconomic concerns of the 21st century (Onyeneke & Madukwe, Citation2010). Climate change adversely affects the agricultural sector through increased water stresses, change in run-off patterns, seasonality fluctuation and temperature variations. According to IPCC (Citation2014), recent climate change projections indicated that severe adverse impacts on several countries across the world are distressingly growing. The impacts are more prevalent in developing nations like Africa, since their agriculture is mainly rain-fed with weaker adaptation capacity (Thornton et al., Citation2014).
Because of the terrible nature of climate change outcomes on human and natural systems, it has become a matter that human beings need to comprehend and react (Houghton, Citation2012). Climate change perceptions are the process of receiving information from the environment and transform it into psychological awareness (IPCC, Citation2014). Misunderstanding climate change and its related risks may result in to zero or maladaptation so that will increase its negative effects (Silvia et al., Citation2012). Therefore, consciousness to perception and response choices of climate change is vital entry points to policy makers in order to guide how and where to enhance adaptation capabilities of smallholder farmers (Mihiretu et al., Citation2019a). Climate change adaptation involves, perceiving the changes and then deciding whether or not to implement the measures. Farmers have longer adaptation records to climate change effects using series of practices (viz., crop/animal diversification, irrigation, soil and water management, disaster risk management and insurance) (Belayneh et al., Citation2012).
Although African farmers have low capacity to adapt to the observed changes, they survived through managing in different ways over time. Therefore, understanding how they have done is important for designing enticements to improve private adaptation (Dumenu & Obeng, Citation2016). Backing the local farmers adaptation strategies using suitable public policies and collect\ive actions can help to enhance the acceptances of adaptation measures (Nhemachena & Hassan, Citation2007). Millions of people are already experiencing the changing seasonal patterns of rainfall and increased temperature in Ethiopia. These changes are projected to depress particularly the livestock sector by the coming decades in arid agro-pastoral regions (Bryan et al., Citation2010). In Ethiopia, the pastoral and agro-pastoral communities who represent 12% of the entire population are living in arid and semiarid lowland areas. The frequent shocks and stresses of climate change are gradually deteriorating the resilience capacities of agro-pastoral farmers (Temesgen et al., Citation2009). Being part of the arid agro-pastoral region, the Tekeze lowland is identified as most affected livelihood zone in Ethiopia (Mihiretu & Abebaw, Citation2020).
Generally, different studies on climate change perception and its adaptation strategies were undertaken in Ethiopia. However, most of them were at macro level, which makes the result vague to generalize about the specific agro-ecology. Due to variations in agro-ecological zones, adaptation strategies need to be peculiar to each ecological zones and specific climatic features (Philip et al., Citation2019). Identifying the perceived changes and readiness to react at zonal level is hence vital for policy endorsements as part of the national program. Adaptation entails the farmers’ notice of changing climate and the ability to select best measures at frontline (Silvia et al., Citation2012).
The fact that climate has been changing in the past and continues to change in the future infers the need to realize how farmers are aware to guide actions fit for upcoming climate risk identification, public awareness campaign, adaptation and intervention (Bryan et al., Citation2010). It is relevant to conduct zonal level investigation to use of the knowledge and experiences of farmers in generating information important to viable adaptation in the face of climate change.
The current study is thus designed to assess the small holder farmers’ perception and response mechanisms to climate change, on top of identifying factors behind their response decision in Tekeze lowland goat and sorghum livelihood zone of Ethiopia. Usually, perceiving the local contexts of climate change is important for stakeholders to put in place supportive actions, more importantly to device community wise policy directives. Therefore, we trust that the findings of this study will help development practitioners to capitalize on superb response options in their intervention. The paper is organized as follows: the subsequent section is describing about empirical studies and the conceptual framework used during the study. The third section is presenting the study approaches. Results and major findings are presented under section four. The last section is providing study conclusion with brief policy suggestions.
2. Empirical studies and the conceptual framework
Studies in different parts of the world revealed that climate change adaptation is taking place in dynamic biophysical, socioeconomic and political contexts, which fluctuate across time and location (Bawakyillenuo et al., Citation2016). Farmers’ capacity to adapt with climate change effects is therefore a function of demographic, socioeconomic, institutional features of the households (Osumanu et al., Citation2017). However, the current study was reviewed literatures that were merely directed to semiarid agro-pastoral systems, which are very similar to the study area. Decline in livestock population was directly or indirectly linked to climate change. A study in Borana zone of southern Ethiopia revealed that households experience severe reduction in their assets. An average decline in livestock holdings by 80% over the last 10 years was primarily due to climate change (Zelalem et al., Citation2009). Livestock health problems such as Trypanosomiasis in lowlands of Arbaminch are among climate challenges that adversely affect the livestock sector (Kassaye, Citation2010). Farmers’ adaptation to climate change in Doba district of west Harerghe studied by Belayneh et al. (Citation2012), revealed that agro-ecological location, sex, family size, plot size, off-farm income, livestock holding, frequency of extension contact and training were factors influencing adaptation to climate change.
In addition, Temesgen et al. (Citation2009) assessed farmers’ adaptation to climate change in the Nile Basin of Ethiopia. Educational status of the household head, household size, sex of the household head, livestock ownership, extension and credit services were positively and ominously affected climate change adaptation. In fact, adaptation does not happen without influences from socioeconomic, geographical and institutional factors that shape the human-environment interaction. Thus, in this study, adaptation used to include only human adjustments to climate change, since adjustment of natural systems, ranging from ecosystem threshold to geographical limitations are influenced by social structures (Pauw, Citation2013).
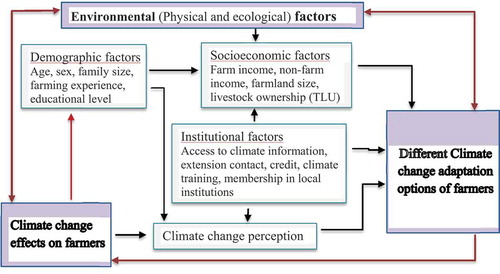
Therefore, based on theoretical concepts and related studies, determinant factors for climate change adaptation were hypothesized to be demographic, socioeconomic, institutional features of the households (Figure ). Demographic features such as being male, educational status, farming experience and climate change perception of the household head were assumed to have a positive effect on adaptation decision (Temesgen et al., Citation2014). Likewise, socioeconomic structures of households such as farm income and total livestock in tropical livestock unit (TLU) were hypothesized to influence farmers’ adaptation decision positively (Osumanu et al., Citation2017).
Institutional features such as membership in local institutions, access to climate information, climate related training, credit, frequency of contact with agricultural extension workers were supposed to have positive effect on climate change adaptation (Bawakyillenuo et al., Citation2016). Nonetheless, among socioeconomic factors, farmland size and nonfarm income of the household were expected to have a negative impact on adaptation decision (Amdu et al., Citation2012). On the other hand, demographic features of the household (i.e. age and family size) were assumed to influence climate change adaptation both positively and negatively (Mihiretu et al., Citation2019a).
Figure 1. The conceptual framework
3. Methodology
3.1. The study area
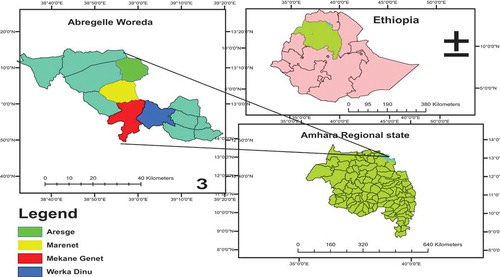
The study was carried out in Abergelle, a district located at 13°20ʹN’ latitude and 38°58ʹE’ longitude in Amhara region of Northeastern Ethiopia (Abeje et al., Citation2016). The district was selected randomly from 14 districts, which are found in Tekeze lowland goat and sorghum (TGS) livelihood zone of Amhara region (Figure ). This lowland livelihood zone encircles the foot of the great Ras-Dashen massif and is characterized by a very rugged terrain of hills and gorges together with escarpments (Mihiretu & Abebaw, Citation2020). It is a deforested area, and the remaining vegetation is bush scrub, scattered acacia trees and a small coverage of gum trees in pocket areas. The altitude of Abergelle district is ranges between 1150 to 2500 meters above sea level (Mihiretu et al., Citation2019b). It has a total area of 166,086 hectare, of which 58.7% is bush land and used for grazing, while the remaining has a potential for crop production and currently only 10.2% is under cultivation (AWOA (Abergelle Woreda Office of Agricultural Development), Citation2016). The soil types are a mix of sandy and clay and soils are mostly of low to moderate fertility (Mihiretu et al., Citation2019a).
The population density is low and settlements are sparse, but residentially more concentrated on the higher and less precipitous terrain where they can cultivate. Agricultural activities are dependent on a remarkably short rainy season that lasts not longer than 2 months: July and August (A. Mihiretu et al., Citation2019b). The mean annual temperature of the district is ranging between 23°C and 43°C, while the annual rainfall distribution is fluctuating between 250 and 750 mm, which displays the arid nature of the area (Halima et al., Citation2012a). In satisfactory years enough rain falls in that period to support crops; in fact the long term mean annual rainfall is not low for a low land area. But there is no area of Amhara region more prone to rain failure than this, especially south of the mountain massif, and this was the very center of the notorious drought and famine in 1973 and 1984 (Mihiretu et al., Citation2019a). The zone is annually in overall food deficit, and apart from the lower rainfall a major hazard is its erratic nature. Crop production is limited to some pocket areas having relatively fertile soil and moderate moisture. The main crop types cultivated in the area are sorghum, teff and haricot beans, which are often early maturing varieties adaptable to the rainfall conditions (Lijalem et al., Citation2013).
The steep slopes and bare plains with little flora cover, combined with erratic seasonal rainfall are major causes of decreased retention of ground water and high run-off, which in turn results in extensive soil erosion (Halima et al., Citation2012a). Much of the terrain is so steep or rocky that only goats can use it for browsing the bush cover. The district’s livelihood is mainly livestock based mixed farming system, and 88.2% of them engaged in goat farming (AWOA, Citation2016).
Figure 2. The study area
3.2. Sampling and data collection
Multistage sampling technique was employed to select the sample farmers. In the first stage, 4 kebeles out of 15 were selected in random systematic sampling. Kebele is the smallest community level administrative unit in Ethiopia (Mihiretu & Assefa, Citation2019). In the second stage, a total of 260 sample farmers were determined from the total study population using a simplified formula provided by Yamane (Citation1967). Finally, representative sample farmers were nominated systematically from the fresh list of household heads obtained from each kebele. The number of respondents per kebele was decided by probability proportional to size. The quantitative data were collected using interview schedule, while the qualitative data were collected using focus group discussions (FGDs) and key informant interviews (KIIs). Trained and local language speaking enumerators were hired to collect the quantitative data using structured questionnaire since most of the respondents were illiterate. Data collection was undertaken in the period between February and March 2016. The interviewed farmers were not exposed to climate information by the researchers who performed the study before the interview. The collected quantitative data were demographic, socioeconomic and institutional features of the farmers expected to exemplify the population under study.
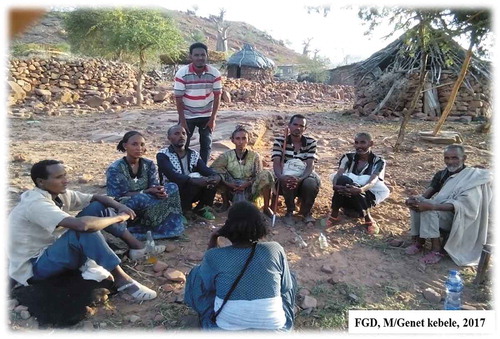
However, the qualitative data were farmers’ opinion on causes, indicators, effects of climate change and the adaptation mechanisms to react its adverse effects. To obtain the sincere qualitative information, 16 KIIs were conducted involving well-informed community fellows and experts from different concerned disciplines. They were selected purposively on the bases of experience and expertise to the phenomenon (Mihiretu et al., Citation2019c). Two FGDs were held consisting of eight discussants per group. The group members were selected on the bases of age, gender, education, and wealth status in order to have broader viewpoint from the diverse social segments. The discussions were held using the local language of the community (Khimitigna) because farmers were relaxing to confer their feelings.
Having the consent of participants, the FGDs and KIIs were recorded by digital voice recorder to transcribe verbatim, and then to translate into English. Therefore, there were no missed ideas due to language difference since one of the investigators was fortunately able to speak the language. Moreover, additional information about the study area, including metrological records was collected from different published and unpublished documents. Secondary data were collected to use as sympathetic to enrich and triangulate the information obtained from the survey.
Climate change and its effects have complex phenomenon, hence comprehensive and broader inquiry was prominent to deal with. Despite this fact, this study used a cross-sectional data, which limits the farmers’ long-term observation in adaptation choice changes. The head of the household was the unit of analysis hence it did not apprehend through opinions of all other members of the household. Therefore, this approach was to some extent exposed for intrahousehold bias mainly with respect to activities which were not carried out by the head of the household (Evengelista et al., Citation2013).
3.3. Data analysis and model estimation
A psychometric approach was used to assess farmers’ climate change perception in the study. Combined with meteorological evidences, psychometric approach can generate useful information to understand perception levels. Therefore, in the study, farmers were asked to indicate their agreement level for perception statements using Likert item questions (Likert, Citation1932). Cronbach’s alpha was tested for internal consistency among scale scores, since in the absence of consistency it is impossible to have valid composite score. Descriptive statistics was employed to analyze quantitative data, while the qualitative data were summarized, interpreted and quoted. Inferential statistics were also used to make comparison between households. Farmers’ perception on temperature and rainfall patterns were described and triangulated with trend analysis of 20 years climate records (1997–2016).
Adaptation to climate change was modeled as the choice between “using different adaptation options” and “no adaptation”. It was assumed that farmers would make decisions that would maximize their utility. Depending on assumed random disturbance, several choice models could be estimated including linear probability model, logit and probit models (Green, Citation2003). However, probit and logit models are the most common functional forms used in adoption studies with binomial dependent variable, as their probabilities are bound between 0 and 1. They can be derived from a fundamental latent variable model:
Where y* is unobserved or latent variable, x represents set of explanatory variables, ε is error term and 1[y*>0] defines the binary outcome. The difference between probit and logit model is the assumption of distribution in error term (ε). Thus, in the case of logit model, the error terms assumed to have standard logistic distribution, while in probit model they would have normal distribution. Despite the mismatch, economists tend to favor the normality assumptions of probit model. Since specification problems are easily analyzed for their normal dispersal properties (Wooldridge, Citation2006).
In this study, the probit model is used to determine factors for climate change adaptation decision from the set of independent variables, discussed under the empirical study and conceptual framework above (Section 2). Moreover, for ease interpretation of results, the marginal effect was calculated. It measures the expected change in probability of a particular choice with respect to a unit change in an explanatory variable (Mihiretu et al., Citation2019a). Signs of marginal effects and respective coefficients may be different, as the former depend on the sign and magnitude of all other coefficients (Temesgen et al., Citation2014).
4. Results and discussion
4.1. General information about sample respondents
Among studied farmers, 13.8% were female-headed while the rest were male-headed, with average age and farming experience of 45.4 and 18.5 year, respectively. Three-fourth of the respondents were ever been to school, and nonschooling was prevalent at the age of 55 and above. The mean family size per household was 3.9 in adult equivalent. Nearly all respondents were dependent on livestock based crop production with average livestock holding of 13.5 in TLU (Table ). Goats are dominant animals kept by large farmers for their milk, cash income and virtual tolerance to the harsh conditions. Annual farm income of the farmers was 26,490.6 ETB (USD 1151.9), obtained from sale of livestock and their products, mainly goats. In the survey month, 1 USD was exchanged at the rate of 23 ETB (Ethiopian Birr). Nearly one-third of the respondents had an average nonfarm income of 3244.2 ETB (USD 141.1), from sources like labor wage, petty trade and remittance. In combination, 89% of the farmers had annual income of 24,000 ETB (USD 1043.5), thus 11% of them were getting an annual income which is lower than the national per capita income (USD 784) in the same year. Most of the farmers were accessing credit from informal sources like churches and local lenders (Table ). Lesser bureaucracy, absence of group guarantee, lower interest rate and the chance of pending during risky seasons were reasons behind farmers choice to the informal sources.
4.2. Climate change perception and awareness
To adapt the climate change effectively, farmers must perceive that changes are taking place. As a result, 86.5% of respondents aware of the existence of changes in main climate patterns while 92.3% of them also recognized variability in daily weather. The farmers also inquired about the patterns of temperature and rainfall across the study years. Therefore, 76.8 and 83.5% of them perceived an increasing temperature and decreasing rainfall, respectively in main rainy season (Table ). This increasing temperature was confirmed by the FGD discussants opinion though they found tough to put the amount in number. So that, the discussants explained that:
“We couldn’t know what tomorrow will be since it’s normal to observe the dry and sunny day today and rainy and hot by tomorrow. Besides, it becomes too hot even in the early morning thus about 1:00AM movement is awkward due to extreme heat” (FGD-1, male).
Table 1. Farmers’ climate change perception levels disaggregated by age, education and sex (n = 260)
Climate change perception further examined by disaggregating in to diverse demographic sets since farmers in different sets are expected to have different awareness level (Nega et al., Citation2015). The disaggregation of climate change perception by different age groups (viz. young, adult and elder farmers) was indicated difference among the categories at 5% significance level (Table ). Thus, the younger farmers were less likely to perceive climate changes than their elder counterparts.
This is similarly to say that adult farmers, who are in the age cluster of 36–64, were better perceiving the changes than the young and elder farmers. On the other hand, disaggregation of farmers’ perception by education status revealed that there was significant difference among groups only in the direction that temperature is changing (p ≤ 0.1). As a result, literate farmer groups were perceived an increasing temperature than their illiterate counterparts. However, disaggregating farmers’ climate change perception by gender (sex) groups had no significant variation; this is literally to mean that the gender (sex) disparity had nothing to do with climate change perception. Furthermore, most farmers were observed changes in normal wind direction across the study periods. Therefore, the disaggregated result revealed that farmers who are in adult age group, educated and male in sex were better perceived changes in normal wind direction at 5% and/or below significant levels (Table ). The farmers’ perception was thus confirmed by the key informants’ viewpoint.
“Obviously in our experience, the wind used to blow in the direction of east to west, commonly in the on-setting months of the rainy season (May and June), owing the inference of good season. As a result, livestock keepers who were in migration with herds will return to their village having the faith of worthy season from the wind based indigenous prophecy. Nonetheless, in recent years the wind direction was altered to appear in unspecified ways and made the local prediction to be unreliable. As a result, recurrent incidences of merciless seasons (drought) caused poor livestock productivity on top higher death rates due to meager early preparedness for incidences” (KI-1 & 2, M/Genet and Arsgie kebeles).
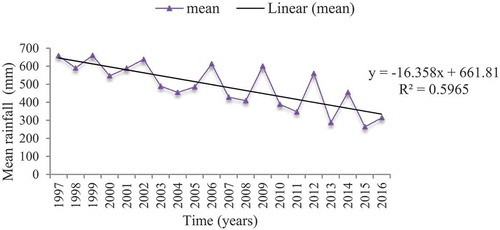
To verify the farmers’ perception with the trends of meteorological records, twenty years mean annual temperature and rainfall data of the study district was analyzed (Table ). The regression result across time therefore revealed that the mean annual temperature and rainfall were showed an increasing and decreasing trend, respectively by 0.66°C and 16.4 mm (Figures and ). Therefore, the farmers’ climate change perception was in agreement and supported by the actual meteorological records of the study district measured for 20 years.
Figure 3. Mean annual temperature trends of the district (1997–2016)
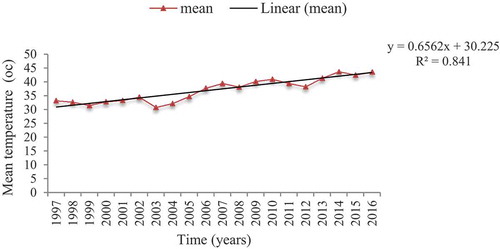
Figure 4. Mean annual rainfall trends of the district (1997–2016)
All the disaggregated perception levels are in percentage points, while values under parenthesis are frequencies
4.3. Causes, indicators and effects of climate change
Farmers in the study area were also uttered their perception on varied climate change properties, consequently the Likert item scores for each property were summed and averaged. However, before combining the item scores, the Cronbach’s alpha reliability test was checked for 12 items used (Table , in supplementary section). The alpha test coefficient allows the composite construction if and only if, α score is above 0.7. The value of α (0.79) was hence confirmed higher internal consistency for reliable combination of the item scores (Anastasiadou, Citation2010). Based on the combined scale result, the respondents were agreed that frequent drought, shortage of rainfall, higher temperature, short and erratic rainy season to be the key climate change indicators. Deforestation, poor resource management, lack of soil and water conservation, pressure on nature and the population growth were identified as causes for climate change. Therefore, it is acceptable to infer that farmers were mindful, as if climate change is not the mystical penance for creatures; rather it is human initiated problem that inborn from rash natural resource utilization and meager corrective actions (Table ). Similarly, nearly all respondents were experienced climate change caused disasters with varied degree of sway on their livelihood. Decline in crop produce, livestock and human diseases outbreak, declined in livestock productivity, recurrent wind storm, food insecurity and frequent conflict with the nearby communities for grazing land were farmers’ notable effects perceived due to climate change. This result was confirmed by the key informant’s observation from natural resource department, thus his view was summarized as:
“Due to recurrent drought, agricultural productivity is diminishing time to time. Thus, highly victimized crop farming with minimum and even zero yields cannot seal at least three months food rations of the household in regular production years. Likewise, the shirked livestock body weight halted from feed dearth and related diseases led to lower marketability and price. As a result, food insecurity is growing distressingly in the area across time. For instance in 2015, 43,187 people were reliant on food aid, among of them 24302 and 18885 were in chronic and transitory food insecurity status, respectively. (KI-13, district level expert).
Table 2. Perception on climate change causes, indicators and effects (combined responses of 5-point Likert item statement), n = 260
Table 3. Classification of farmers’ response mechanisms to climate change, multiple responses
Table 4. Estimation of independent variables in probit model, n = 260
Table A5. Likert statements’ reliability test statistics
Despite better climate change perception of farmers, the Pearson’s test revealed that there were significant differences between climate change adapting and nonadapting farmers in most property parameters. Except to erratic rainfall, lack of soil and water conservation and wind storm there was significant difference among climate change adapter and nonadapter farmers (p ≤ 0.1). Therefore, climate change adapting farmers were those who perceived changes in different climate properties (indicators, causes and effects) at varied levels.
4.4. Response options and barriers to climate change
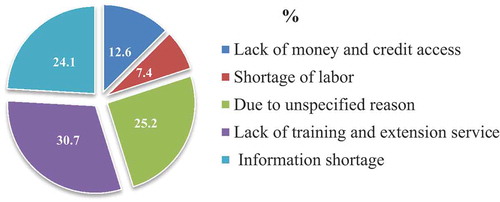
Farmers who claimed change were then asked for their reactions, thus from the perceived respondents only 63.5% were taking more than one adaptation options which are practical to their situation. This finding is thus in line with Belayneh et al. (Citation2012) who stated that a single strategy is scanty to adapt climate change, rather a group of options is likely to be more effective. In combination the farmers were pursuing crop, livestock and nonagriculture-based adaptation options with a plea to bear livelihoods in the face of dynamic and ever changing climatic status quo (Table ). However, farmers who did not take any adaptation measures to climate change were due to lack of training and extension service, due to unspecified reasons, lack and shortage of climate information, finance, credit and labor in descending order (Figure ). Most of the constraints were thus linked to the poverty status of farmers, for instance, lack of money would hamper farmers from accessing the required resources and inputs for climate change adaptation. This finding is thus in line with Nhemachena and Hassan (Citation2007), who stated that adaptation to climate change is costly and needs intensive labor, hence farmers who have not adequate eligible family members or the financial means to hire, could not be adapter to the climate change.
Figure 5. Barriers to climate change adaptation
4.4.1. Climate change adapter and nonadapter farmers: a household scenario
Explanatory variables that are expected reflect the demographic, socioeconomic, and institutional features of climate change adaptor and nonadaptor households were compared and statistically tested for their variations. The comparison of demographic features thus indicated that among male-headed farm households, climate change adapters were higher than their nonadaptors counterparts by 32%. Climate change adapting households were received an extra education compared to nonadapters. They were older in age and with better farm experience compared to their nonadapter counterparts by the years of two and four, respectively. However, family size was relatively medium for both adapting and nonadapting households, having an average of four members in adult equivalent.
In terms of socioeconomic status, climate change adapter farm households were better off by 26 total livestock in TLU as well as 8312.6 ETB (USD 361.4) annual farm income compared to nonadaptors. Considering the institutional characteristics of farm households, climate change adapter farmers were better in accessing services (viz., credit, climate related training and information) than the nonadaptor farmers. Likewise, climate change adapter farmers were higher by 26% and 25% than the nonadapters in their frequency of extension contact and climate perception levels, respectively.
Finally, these household variables were designated as covariates to analyze the farmers’ adaptation decision to climate change. For detailed information of independent variables, please refer to supplementary material section (Tables and ).
4.5. Probit model results
This section comprises the model results, thus except membership in local institutions, the influence of all covariates on the farmers’ climate change adaptation decision was examined. The covariate membership in local institutions is excluded because it was practiced by all farm households (similar across sample farmers). Earlier to running the model, variation inflation factor (VIF) test was commenced; the mean of 1.5 hence proofed that absence of multicollinearity among covariates (Table & ). Model estimation was directed in robust standard errors as it able to give relatively accurate probability without heteroscedasticity. Pearson’s test was also showed that overall “goodness of fit” of the model (p < 0.1). The result indicated that most of the covariates were affected the climate change adaptation decision of farmers, and the direction of influence was also as expected (Table ). The coefficient of regression model indicates direction of the effect rather than the magnitude hence the interpretation was using marginal effects. Factors that have positive effect on farmers’ decision to climate change adaptation were educational status, farm income, climate perception, frequency of extension contact, access to climate information and training. However, nonfarm income of the household had the negative effect on farmers’ adaptation decision. In Table below, ME represents marginal effect which is expected change in the probability of adaptation given a unit change in covariate’s mean value, ceteris paribus. Therefore, only statistically significant explanatory variables are discussed below.
Educational status of farmers was increased the probability of climate change adaptation (p < 0.1). Therefore, a 1-year increase in farmer’s formal schooling would cause a 7.5% increase in the probability of adaptation decision to climate change. This could be because educated farmers are more likely to respond to changes via making best adaptation choices based on their inclination and capabilities. The finding is in line with the result of Mihiretu et al. (Citation2019a) who described education advances the likelihood of adaptation by delivering better information on different choices.
Farm income of the household had positive and significant influence on farmers’ climate change adaptation though the marginal effect result shows negligible amount (p < 0.01). This is because increasing the financial power of farmers may be relaxing them to deal with costs of farming inputs that are relevant to deal with climate change. However, increased nonfarm income was negatively influenced farmers’ adaptation decision to climate change by 0.02% (p ≤ 0.05). The possible reason is that farmers may think of better economic gain from off-farm production opportunities. The study result repeated the finding by Amdu et al. (Citation2012) who conveyed that farmers with nonfarm income are supposed to have nonfarm job, thus might constrain adaptation as it competes the on-farm managerial time.
Farmers’ climate change perception level also positively affects their adaptation decision by 23.9% (p < 0.05). This is may be because perception strongly affects how farmers deal with climate induced risks and opportunities. Thus, a particular nature of interactive responses to climate change perception shapes their adaptation decision. This finding is in line with Philip et al. (Citation2019), who stated misconception of climate change and its risks may result in no adaptation or maladaptation in turn increases its adverse effects.
Though service provision on climate information is not formal, access to information from different sources had substantial influence on adaptation decision (p < 0.01). Hence, if a farmer is exposed to information on climate change, then the probability of adaptation increases by 43.2%. This suggests that information dissemination on climate change through extension services, weather reports and other channels would increase the likelihood of adaptation. This result is consistent with Temesgen et al. (Citation2009), which states availability of climate information helps to make comparative decision among alternative practices (to choose the best to cope better with changes).
Frequency of extension contact had significant positive influence on climate change adaptation and increased the probability of adaptation by 14.1% (p < 0.05). This result implies the importance of increasing institutional support so as to encourage the use of diverse practices to accustom with effects of climate change. Thus, it is confirmed with the findings of Negash (Citation2014), which justified farmers who have better extension contact had better chance of information on various farming practices that can used to adapt the changes. Likewise, access to climate related training had positive influence on farmers’ adaptation decision to climate change and increased the probability of adaptation by 17.2% (p < 0.05). This is because, training helps individuals to be aware of the diverse attributes of climate change, there by enrich their knowledge of applying varied adaptation measures to avert climate change effects.
5. Conclusion
The study presents that farmers in Tekeze lowland goat and sorghum livelihood zone perceived an increasing temperature and decreasing rainfall across the study periods. The farmers’ perception was thus in line with the regression result of 20 years metrological records, which displayed an increasing temperature and decreasing rainfall. According to farmers, shortage of rainfall, frequent droughts, higher temperature as well as short and erratic rainy season were the main climate change indicators in descending order. Increased deforestation, pressure on nature, poor natural resource management, lack of soil and water conservation and rapid population growth were identified as the main causes of climate change. Usually, the pragmatic effects of climate change were crop yield failure, outbreak of livestock/human diseases, deterioration in livestock productivity, wind storm, lower water quantity and access, conflict due to grassing land as well as food insecurity in their level of importance. Farmers who perceived the climate change were using crop, livestock and nonagriculture-related adaptation options to react its adverse effects. Nonetheless, lack of training and extension services, unspecified reason, lack of climate information, lack of money and credit access as well as shortage of labor were the major barriers mentioned by nonadapting farmers. The probit model result also revealed that educational status, farm income, access to climate information, climate change perception levels, frequency of extension contact and access to climate related trainings were considerably influenced the farmers’ adaptation decision to climate change. Therefore, placing pressure on the common land is not wise rather encouraging agricultural intensification through investing on inputs/technologies is efficient. In terms of policy implication, refining the education system through village wise vocational training on top of the formal schooling and extension services would do utmost in hastening climate change perception and adaptation. Moreover, government structures at different levels should establish local meteorological stations to provide too date climate information. Extension agents also should be proficient and sufficient for farmers to provide advices related to climate at the farm get. Finally, climate change and its effects have a complex phenomenon, hence comprehensive and broader inquiry was prominent to deal with. Despite this fact, the current study was undertaken at district level and has limitations that provide room for further studies. The study was used a cross-sectional data hence it limits the farmers’ long-term observation in adaptation decision changes. The household head was the unit of analysis hence it did not apprehend complete opinions of all other members of the household. So that, this approach is to some extent exposed for intrahousehold bias mainly with respect to activities which are not carried out by the head of the household.
Cover Image
Source: Author
Additional information
Funding
Notes on contributors

Ademe Mihiretu
Ademe Mihiretu is a honour graduate of Rural Development and Agricultural Extension (MSc) from Haramaya University, Ethiopia. Currently, he is a research fellow of socioeconomic and agricultural extension in Sekota Dry-land Agricultural Research Center, Amhara Region Agricultural Research Institute. In his career, Ademe has published significant number of research articles on environmental science, participatory research, rural sociology, agricultural extension and economics in reliable journals. He has also reviewed journal manuscripts related to his field of specialization, invited from recognized publishers worldwide, such as Taylor & Francis, Sage and Springer.
References
- Abeje, A., Mihiretu, A., Lijalem, A., & Tsega, D. (2016). Participatory evaluation of hybrid sorghum technologies: In mid and low land areas of Wag-Himra zone, Eastern Amhara, Ethiopia. Journal of Agricultural Extension and Rural Development, 8(5), 80–23. https://doi.org/10.5897/JAERD2016-0767
- Amdu, B., Ayehu, A., & Deressa, A. (2012). Farmers’ perception and adaptive capacity to climate change and variability in the upper catchment of Blue Nile, Ethiopia (African Technology Policy Studies Network, ATPS working paper No77). https://doi.org/10.1094/PDIS-11-11-0999-PDN
- Anastasiadou, S. (2010). Factorial validity evaluation of a measurement through principal components analysis and implicative statistical analysis. In D. X. Xatzidimou, K. Mpikos, P. A. Stravakou, & K. D. Xatzidimou (eds), 5th Hellenic conference of pedagogy company, pp. 341–348. Thessaloniki.
- AWOA (Abergelle Woreda Office of Agricultural Development). (2016). General crop and livestock basic information guide: Agricultural working report on: Livestock and livestock characteristics (Unpublished)
- Bawakyillenuo, S., Yaro, J. A., & Teye, J. (2016). Exploring the autonomous adaptation strategies to climate change and climate variability in selected villages in the rural northern savannah zone of Ghana. Local Environment, 21(3), 361e382. https://doi.org/10.1080/13549839.2015.1020020
- Belayneh, L., Yared, A., & Bewket, W. (2012). Smallholder Farmers’ perception and adaptation to climate variability and climate change in Doba district, Western Hararghe, Ethiopia. Asian Journal of Empirical Research, 33, Journal homepage, 251–265. http://aessweb.com/journal-detail.php?id=5004
- Bryan, E., Deressa, T., Gbetibouo, G. A., & Ringler, C. (2010). Adaptation to climate change in Ethiopia and South Africa: Options and constraints. Environmental Science & Policy, 12 (1), 413–426. http://www.sciencedirect.publications.com.
- Dumenu, W. K., & Obeng, E. A. (2016). Climate change and rural communities in Ghana: Social vulnerability, impacts, adaptations and policy implications. Environmental Science & Policy, 5(1), 208–217. https://doi.org/10.1016/j.envsci.2015.10.010
- Evengelista, P., Young, N., & Burnett, J. (2013). How will climate change spatially affect agriculture production in Ethiopia? Case studies of important cereal crops. An Interdisciplinary, International Journal Devoted to the Description, Causes and Implications of Climatic Change, 119(3), 855–873.
- Green, W. H. (2003). Econometric analysis (5th ed., pp. 331–334). Prentice Hall.
- Halima, H., Lababidi, S., Rischkowsky, B., & Tibbo, M. (2012a). Molecular characterization of Ethiopian indigenous goat populations. Tropical Animal Health and Production, 44(6), 1239–1246. https://doi.org/10.1007/s11250011-0064-2
- Houghton, J. T. (2012). Climate change: the scientific basis (Contribution of Working Group I to the third assessment report of the Intergovernmental Panel on Climate Change). Cambridge University Press.
- IPCC (2014). Climate Change: Impacts, Vulnerability and Adaptation (Contribution of Working Group III to the Third Assessment Report on the Intergovernmental Panel on Climate Change). Cambridge University Press.
- Kassaye, H. (2010). Climate change and the vulnerability context of livestock and effects on livestock based livelihoods in Ethiopia: The veterinary agenda. Proceedings of the 24th annual conference of Ethiopian Veterinary Association, July 21-22, 2014. Addis Ababa, Ethiopia.
- Lijalem, A., Tewodros, A., Luelseged, K., Haile, A., Rischkowsky, B., & Legese, G. (2013). Assessment of Abergelle goat value chain in northern Ethiopia: The case of Wag–Abergelle (Unpublished).
- Likert, R. (1932). A technique for the measurement of attitudes. Archives of Psychology, 22 (140), 5–55. R. S. Woodiyorte, Eorron, New York, USA.
- Mihiretu, A., & Abebaw, L. (2020). Scale-wide evaluation and promotion of improved Teff technologies under dryland scenario: Economic profitability, farmers’ preference and constraints in Northeast Amhara, Ethiopia. Cogent Food & Agriculture, 6(1), 1746228. https://doi.org/10.1080/23311932.2020.1746228
- Mihiretu, A., Asefa, N., & Wubet, A. (2019b). Participatory evaluation of sorghum technologies in the marginal dryland zones of Wag-lasta, Ethiopia. Cogent Food & Agriculture, 5(1), 1671114. https://doi.org/10.1080/23311932.2019.1671114
- Mihiretu, A., Asefa, N., & Wubet, A. (2019c). Participatory evaluation of sorghum technologies in the marginal dryland zones of Wag-lasta, Ethiopia. Cogent Food & Agriculture, 5(1), 1671114. https://doi.org/10.1080/23311932.2019.1671114
- Mihiretu, A., & Assefa, N. (2019). Comparative evaluation and demonstration of field pea production practices in intermediate altitudes of Northeastern Amhara, Ethiopia. Turkish Journal of Agriculture - Food Science and Technology, 7(11), 1901–1907. https://doi.org/10.24925/turjaf.v7i11.1901-1907.2857
- Mihiretu, A., Eric, N., & Lemma, T. (2019a). Determinants of adaptation choices to climate change in agro-pastoral dry lands of Northeastern Amhara, Ethiopia. Cogent Environmental Science, 5(1), 1636548. https://doi.org/10.1080/23311843.2019.1636548
- Nega, D., Caroline, M., Kerry, B., Ross, C., & David, M. (2015). Perception of climate change and its impact by smallholders in pastoral/agropastoral systems of Borana, South Ethiopia. Springer Plus, 9(4), 236. https://doi.org/10.1186/s40064-015-1012-9
- Negash, M. (2014). Determinants of farmers’ preference for adaptation strategies to climate change: Evidence from North Shoa of Amhara Region, Ethiopia. American Journal of Social Sciences, 2(4), 56–66. http://www.openscienceonline.com/journal/ajss
- Nhemachena, C., & Hassan, R. (2007). Micro-level analysis of farmers’ adaptation to climate change in Southern Africa (International Food Policy Research Institute (IFPRI) Discussion Paper No. 00714). Washington, D.C: Environment and Production Technology Division, IFPRI
- Onyeneke, R. U., & Madukwe, D. K. (2010). Adaptation measures by crop farmers in the southeast rainforest zone of Nigeria to climate change. Science World Journal, 5(1), 1597–6343. https://doi.org/10.4314/swj.v5i1.61483
- Osumanu, I. K., Aniah, P., & Yelfaanibe, A. (2017). Determinants of adaptive capacity to climate change among smallholder rural households in the Bongo district, Ghana. Ghana Journal of Development Studies, 14(2), 142e162. https://doi.org/10.4314/gjds.v14i2.8
- Pauw, P. (2013). The role of perception in subsistence farmer adaptation in Africa-enriching the climate finance debate. International Journal of Climate Change Strategies and Management, 5(3), 03–08. https://doi.org/10.1108/IJCCSM-03-2012-0014
- Philip, A., Millar, K., Kaunza, N. D., & Joseph, A. (2019). Smallholder farmers’ livelihood adaptation to climate variability and ecological changes in the savanna agro ecological zone of Ghana. Heliyon, 5(4), e01492. https://doi.org/10.1016/j.heliyon.2019.e01492
- Silvia, S., Elizabeth, B., Claudia, R., Mario, H., & Barrack, O. (2012). Climate change perception and adaptation of agro-pastoral communities in Kenya. Regional Environmental Change, 12(6), 791–802. https://doi.org/10.1007/s10113-012-0293
- Temesgen, D., Hassan, R. M., Ringler, C., Alemu, T., & Yesuf, M. (2009). Determinants of farmers’ choice of adaptation methods to climate change in the Nile Basin of Ethiopia. Global Environmental Change, 19(3), 248–255. https://doi.org/10.1016/j.gloenvcha.2009.01.002
- Temesgen, D., Yehualashet, H., & Rajan, D. S. (2014). Climate change adaptations of smallholder farmers in South Eastern Ethiopia. Journal of Agricultural Extension and Rural Development, 6(11), 354–366. https://doi.org/10.5897/JAERD14.0577
- Thornton, P. K., Ericksen, P. J., Herrero, M., & Challinor, A. J. (2014). Climate variability and vulnerability to climate change: A review. Global Change Biology, 20(11), 3313e3328. https://doi.org/10.1111/gcb.12581
- Wooldridge, J. M. (2006). Introductory econometrics, A modern approach. (3rd ed.). Thomson South Western.
- Yamane, T. (1967). Statistics: An introductory analysis. (2nd ed.) Academic Press.
- Zelalem, Y., Aynalem, H., & Emmanuelle, G. (2009). Effect of climate change on livestock production and livelihood of pastoralists in Borana, Ethiopia. Proceeding of 17th annual conference of the Ethiopian Society of Animal Production (ESAP), pp. 3–21. Sep.24-26, 2009. Ethiopia: Addis Ababa.
Appendix
Table A1. Sample households’ socioeconomic characteristics, n = 260
Table A2. Sample households’ institutional features, n = 260
Table A3. Multicollinearity test of continuous explanatory variables
Table A4. Multicollinearity test of dummy explanatory variables
Table A6. Climate data of Abergelle district (1997–2016)