
Abstract
Honey is an important bee product of greater nutritional value. Ethiopia is one of the main producers of it. Honey is known to accumulate trace metals which are essential as well as toxic. Moreover, as bees collect nectar from flora of nearly in an area of around 100 km radius, the level of toxic metals in honey is an important indicator for environmental pollution by toxic metals. Thus, in this study, the qualities of 12 Ethiopian multi-floral honey samples were evaluated in terms of common physicochemical parameters, namely, moisture content, pH, free acidity, lactonic acidity, and total acidity. The values found were moisture content from 14.23 to19.2 %; pH from 3.4 to 4.8; free acidity from 30.6 to 97.6 meq Kg−1; lactonic acidity from 8.06 to 14.4 meqKg−1, and Total acidity from 42.96 up to 107.4 meqKg−1. The analyzed samples showed proper maturity, absence of undesirable fermentation, and were in agreement with standard values (Codex Alimentarius) and reported literatures. The concentrations of trace heavy metals (Cd, Cr, Cu, Mn, Ni, Pb, and Zn) in 12 multi-floral honey samples were also evaluated using flame absorption spectrometry after wet digestion. The accuracy of the method was assessed by spiking honey samples with known amounts of standard metals and examining recovery. The contents of trace metals in honey samples were found to be in the range of Non-Detectable (ND)-0.017 μgg−1, ND-0.15 μgg−1, 0.02–1.15 μgg−1, ND-7.29 μgg−1, ND, ND-2.53 μgg−1and 9.96–16.03 μgg−1for Cd, Cr, Cu, Mn, Ni, Pb, and Zn, respectively. Results obtained are in agreement with a report in the literatures and with codex limits and thus they did not pose as such any health risk.
PUBLIC INTEREST STATEMENT
Honey is an important nutritional food consumed all over the world. Ethiopia is one of the main producers of this food. The chemical composition of honey may vary depending on floral source, seasonal and environmental factors.
Although Ethiopia had a wide geographical variation, plant flora, and environmental diversity hence thereof different agro-climatic conditions for honey production, the chemical composition of honey in different areas is not well investigated. Hence, this article studies the levels of trace metals (minerals in which some are essential to humans but some are non-essential and toxic) and physicochemical parameters (that indicate Honey quality) in Ethiopian honey selecting representative samples throughout the country. Based on the study consumers, nutritionists, and health professionals can judge the honey quality in Ethiopia with respect to the parameters investigated. The results found are within the international guidelines set up limits and thus the honey from Ethiopia can be determined as safe to human consumption with respect to the studied parameters.
Competing Interests
The authors declare no competing interests.
1. Introduction
Honey is a natural sweet substance produced by bees (Apis mellifera) from the nectar of different plants, as well as from honeydew (Codex Alimentarius Commission Standards, Citation2002). It is a highly hygroscopic and very concentrated aqueous solution of sugars with complex matrix. Its composition is variable owning to the differences in plant species, environmental conditions, climate, and beekeeper contribution (De Rodrı́guez et al., Citation2004; Küçük et al., Citation2007). Honey contains different sugars, organic acids, proteins, enzymes, hormones, yeast, vitamins, minerals, and heavy metals (Kujawski & Namieśnik, Citation2008; Wang & Li, Citation2011).
Honey is known to accumulate trace metals, cadmium, nickel, and lead which are known as toxic metals, and other essential metals like zinc, copper, manganese, and chromium which are important for health and development of human being in a certain limit (Hernández et al., Citation2005; Pohl, Citation2009). However, excess intake of such elements still can cause chronic toxicity (Ashenef, Citation2014).
It is a useful bio-monitoring mechanism for information related to the environment where the bees live, since honey bees readily fly up to 4 km in all directions from their apiary and thus have access to an area of about 50 km2. Thus, the bees come in contact not only with air but also with soil and water, the concentration of heavy metals in honey reflects their amount in the whole environment. Therefore, honey has been recognized as a biological indicator of environmental pollution (Silici et al., Citation2008).
The mineral and heavy metal contents of honey have been the subject of many studies using different analytical methods including Atomic absorption spectroscopy (FAAS, GFAAS) (Tuzen et al., Citation2007); inductively coupled plasma-optical emission and mass spectrometry (ICP-AES and ICP-MS) (Aghamirlou et al., Citation2015; Kılıç Altun et al., Citation2017); capillary zone electrophoresis (Suárez-Luque et al., Citation2005); Potentiometric stripping analysis (Muñoz & Palmero, Citation2006); particle-induced X-ray emission (PIXE) (Braziewicz et al., Citation2002); total reflection X-ray fluorescence (TXRF) (Khuder et al., Citation2010); ion chromatography (Buldini et al., Citation2001), and isotope dilution inductively coupled plasma mass spectrometry with direct injection nebulization (ID-ICP-MS) (Packer & Giné, Citation2001). The analytical methods employed as well as the values found for physicochemical parameters and metal content of Honey around the globe had been recently extensively reviewed by Solayman et al. (Citation2016).
Ethiopia is home to some of the most diverse flora and fauna in Africa and owing to its varied ecological, climatic conditions, it has a big honey production potential. Beekeeping is one of the oldest farming practices in the country. However, the products obtained from this subsector are still low as compared to the potential of the country (Deffar, Citation1998). Ethiopia, having the highest number of bee colonies and surplus honey with many sources of flora, is the leading producer of honey (41 million kilograms of honey/annum) and beeswax in Africa. According to the central statistics agency of Ethiopia 2009/2010 report (the latest available full census in Ethiopia), the total honey production was estimated to be 41 million kilograms and from which Southern Nation Nationality and people of Ethiopia (SNNP) (11,794,672 kg), Oromia (15,825,245 kg), Amhara (7,453,349 kg) and Tigray (3,203,088 kg) account the major portion of honey produced. The report enumerates the number of hives, frequency of honey production, and quantity of honey production per harvest (CSA, 2009/10).
Physicochemical and mineral contents of a specific region (Tigray) and other regions of Ethiopian honey have been studied by few researchers (Belay et al., Citation2013; Gebremedhin et al., Citation2013; Nigussie et al., Citation2012; Liben et al., Citation2018; Teka, Citation2018; Yohannes et al., Citation2018). Both studies perform the investigation either in a specific locality honey or commercial products in a specific city. There is no literature that studied and performed assessment that included the top honey-producing regions of Ethiopian honey with wider geographical coverage at a time. Therefore, the aim of this study was to assess the levels of trace metals in different regions of Ethiopian honey and to characterize it with respect to some physicochemical parameters. Such information is important to beekeepers, as it helps them to avoid possible contamination during honey processing, and to consumers about the quality of their honey thus its safety upon consumption.
2. Materials and methods
2.1. Sampling
The study was conducted on 12 multi-floral honey samples produced from different regions (12 locations) of Ethiopia (Figure ).
Figure 1. Honey samples collected from different regions of Ethiopia. Marked places (Green pins) are sites of Honey sample collection
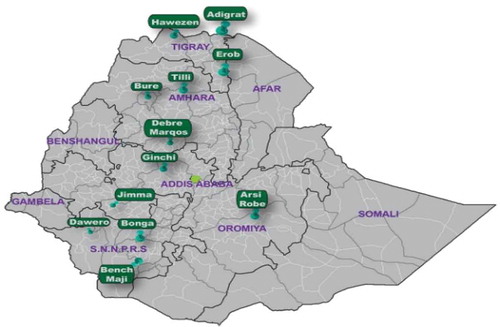
The samples were obtained by taking randomly four samples from commercial honey traders and/or beekeepers from each zone and/or district by the researchers. Then, the samples were mixed, homogenized, and preserved in plastic containers. The honey samples were immediately transferred to the laboratory and kept at 4–5°C until analysis.
2.2. Apparatus
Atomic absorption spectrophotometer: Flame & graphite furnace system (PG990, United Kingdom) equipment fitted with appropriate hollow cathode lamps was used for metal analysis. The operating parameters for the elements determined were set as recommended by the manufacturer (Table ). Flame measurement was done at a 10 cm long slot-burner head. A lamp and an air-acetylene flame were used. Analytical balances (Mettler Toledo, Switzerland), Abbe refractometer (ATAGO, UK), pH meter (JENWAY 3510, UK) were also used.
Table 1. Parameters of FAAS determination
2.3. Reagent
HNO3, H2O2, NaOH, KHP, all which are analytical grade from BDH, England, and stock solutions with 1000 mg/L concentration of Cd, Pb, Cu, Mn, Ni, Cr, and Zn, all from Inorganic Ventures, USA were utilized.
2.4. Methods
2.4.1. Physicochemical analysis
The samples of honey were analyzed according to the AOAC methods (Association of Analytical Communities [AOAC], Citation2000) in order to determine moisture content and acidity (free, lactone, and total). Moisture in honey was determined with the use of a refractometer, reading performed at 20°C and corresponding % moisture obtained from the table (AOAC, Citation2000). Acidity was determined as follows: briefly, 10 g of honey was dissolved in 75 ml of carbon dioxide-free water in a 250 ml beaker, and stirred with a magnetic stirrer. After homogenization was achieved, the pH electrode was immersed and then the pH was measured. Starting from this pH value, the sample solution was titrated against a standardized 0.05 M NaOH till pH 8.5, and addition of 0.05 M NaOH was stopped at pH 8.50 (free acidity), immediately a volume of 10 ml 0.05 M NaOH was added and, without delay, back-titrated with 0.05 M HCl to pH 8.30 (lactonic acidity). Total acidity results were obtained by adding free and lactone acidities (AOAC, Citation2000).
2.4.2. Metal analysis
The procedure described by (Tuzen et al., Citation2007) was followed for the digestion of honey samples. In this method, 1 g of honey sample, mixed and homogenized, was weighed and placed in a conical flask. Eight (8) ml of concentrated nitric acid and 4 ml of hydrogen peroxide were added to the flask containing the sample. Then, the sample mixture was placed on the water bath and heated for 4 h to dryness. The flask was removed from the water bath and cooled to room temperature. To the cooled sample, de-ionized water was added to dissolve the dried mass, and the content was filtered in a 10 ml volumetric flask with whatman no. 42 filter paper. Subsequently, the solution was made up to volume using de-ionized water. Similarly, reagent blank was prepared by taking a mixture of the reagents (concentrated nitric acid and hydrogen peroxide) and treating it in the same manner as the sample.
The content of the flask was then analyzed for the level of the selected heavy metals (Cd, Cr, Cu, Mn, Ni, Pb, and Zn) if any using atomic absorption spectrophotometer: Flame & graphite furnace system (PG990, United Kingdom). The parameters for the instrument were set per the company recommendation as shown above in Table . The instrument was calibrated by using standard solutions of studied metals. The whole procedure was done in triplicate.
3. Results and discussion
3.1. Physicochemical parameters
Results for the studied physicochemical parameters of honey from different regions of Ethiopia are summarized in Table .
Table 2. Statistical analysis of some studied physicochemical parameters of Ethiopian multifloral honey
The moisture content found was between 14.23% and 19.2%. Moisture level in honey is a quality criterion that determines the capability of honey to remain stable and to resist spoilage by yeast fermentation (Bogdanov et al., Citation2002). It is also an important character to determine its stability (the shelf life of honey) during storage (Nanda et al., Citation2003). None of the honey samples exceeded the permitted limit established by the European Community Directive (not more than 20%) (Codex Alimentarius Commission Standards, Citation2002). The values found correspond to mature honey, and it indicates that the beekeepers had followed the proper time of extraction. As moisture content is dependent on botanical origin, harvest season, and proper time of extraction, there was a significant variation between honeys from different regions. Similar results were obtained in previous studies in Turkey, 15.36–18.5%, (Özcan et al., Citation2006); Syria, 13.2–19.4%, (Khuder et al., Citation2010); New Zealand, 15.7–18.0%, (Vanhanen et al., Citation2011), Saudi Arabia, 14.40–15.95%, (Osman et al., Citation2007); Greek, 13.0–18.9% (Lazaridou et al., Citation2004)
The pH values of all honey samples collected from the different regions are in the acidic range (3.4–4.8). The lowest pH was found for honey samples collected from Benchi-Maji, and the highest pH from Debere Markos. Except the pH of honey collected from Benchi-Maji, all the mean pH values were within permitted limit established by the European Community Directive (3.5–5.5). The mean pH value of Ethiopian honey was similar to Turkey, 3.94 (Kahraman et al., Citation2010), Spain, 3.56–4.79 (Terrab et al., Citation2004), Saudi Arabia, 4.49–5.61 (Osman et al., Citation2007), Chili, 4.23 (Fredes & Montenegro, Citation2006), and Algeria, 3.49–4.43 (Ouchemoukh et al., Citation2007).
The acidity of honey is due to the presence of organic acids, particularly the gluconic acid, in equilibrium with their lactones or esters and also due to inorganic ions such as phosphate and chloride (Ouchemoukh et al., Citation2007). The mean values of free acidity in studied samples had exhibited the minimum value as30.6 meqKg−1 for Hawzene and the maximum free acidity value for Benchi-Maji (97.6 meqKg−1). The mean free acidity of Ethiopian honey (45.81 meqKg−1) was found to be the highest compared to the reported values from countries such as Turkey, 22.8 meqKg−1 (Kahraman et al., Citation2010), Spain, 17.59–39.81 meqKg−1 (Terrab et al., Citation2004), Slovenia, 11.67–17.11 meqKg−1 (Kropf et al, Citation2010), and India, 14.57–32.65 meqKg−1 (Nanda et al., Citation2003). Lactonic acidity, considered as the acidity reserve when the honeys become alkaline ranges from 8.06 meqKg−1 in the case of Dawero to 14.4 meqKg−1 for Erob. While total acidity was between 42.96 meqKg−1 for Hawzene and 107.4 meqKg−1 for Benchi-Maji. Twenty-five (25%) of honey samples exceeded the maximum limit of free acidity established by the European Community Regulation.
3.2. Determination of studied metals
The accuracy of the method was assessed by spiking honey samples with known amounts of standard metals, and examining recovery. Table shows the recovery and method detection limit (MDL) results for the studied metals. The results show the validity of the employed methods and a good repeatability for the analysis of honey samples. Reading of control solution between three consecutive samples showed the instrument’s precision (97.5%-102.1%). In addition, to evaluate the method detection limit (MDL), six blank solutions (all treatment procedures for the analysis of sample were done except the inclusion of the sample itself) were digested in triplicate and the absorbance was recorded. Then, MDL was calculated as three times the standard deviation of the blank (3σ blank).
Table 3. Method validation (% recovery) and MDL results of studied metals
Metals were measured in the honey samples utilizing the FAAS instrument by external calibration method. The concentration of metals in honey samples varied in the order of Zn >Mn> Cr >Pb> Cu > Cd > Ni (Table ).
Table 4. Trace metal contents in wet digested honey samples from different regions of Ethiopia (mean ± SD, n = 3), wet mass
Cadmium was detected in three honey samples ranging from 0.017 μgg−1- 0.035 μgg−1, the highest being from Bure and the lowest from Arsi. The high concentration of Cd in Bure might be attributed to the high traffic, poor sewage system, use of fertilizers, and use of animal waste product (Cow/Ox dung smoke) for the collection of honey from hives. The mean level of Cd in present studied honey samples (0.027 μgg−1) did not exceed the limit established by Codex Alimentarius Commission, 0.05 μgg−1 (Codex Alimentarius Commission Standards, Citation2002), Turkish codex 0.03 μgg−1 (Leblebici & Aksoy, Citation2008), Indian regulations, 1.5 μgg−1 (Nanda et al., Citation2003), Australia Food standard code (0.05 μgg−1), and Macedonia legislation, 0.03 μgg−1(Staniškienė et al., Citation2006). The mean value of cadmium from the present study (ND-0.017 μg g−1) was comparable with reports from Egypt, 0.01–0.5 μg g−1 (Rashed & Soltan, Citation2004), New Zealand, 0.01–0.45 μg g−1 (Vanhanen et al., Citation2011) and Turkey Central Anatolia, 0.09–0.24 μg g−1 (Leblebici & Aksoy, Citation2008).
Chromium level was the highest in honey samples obtained from Tillili, 6.66 μgg−1 followed by Bure, 5.89 μgg−1, Adigrat, 5.89 μgg−1, Erob, 0.16 μgg,−1 and Debre Markos, 0.15 μgg−1. Contact with stainless steel surfaces during the harvesting processing and/or preparation of honey for the market can generate high chromium content, due to the corrosive effect of honey acidity (Tuzen et al., Citation2007). The mean concentration of Cr in Ethiopian honey ranged from, ND—6.66 μg g−1, which was lower than values obtained for honey samples collected from Turkey, 2.4–37.9 μg g−1 (Tuzen et al., Citation2007) and Slovenia, 0.11–33.8 μg g−1 (Golob et al., Citation2005) but was much higher than values reported in Chile, 0.03–1.92 μg g−1 (Fredes & Montenegro, Citation2006), Italy (Siena), 2.0–54 μg g−1, (Pisani et al., Citation2008), Nigeria, 0.32 μg g−1 (Achudume & Nwafor, Citation2010).
Copper was one of the heavy metals detected in all honey samples analyzed except honey samples collected from Hawzene. The lowest and the highest copper concentrations were 0.02 μgg−1, in the honey sample from Bure and 1.15 μgg−1in honey sample from Debre Markos. The mean Cu levels in studied samples did not exceed the limit established by Codex Alimentarius Commission, 5 μgg−1 (Codex Alimentarius Commission Standards, Citation2002), Indian regulations (30 μgg−1), and Australia Food standard code (10 μgg−1). The level of copper observed in the present study (ND-1.15 μg g−1) was in agreement with results reported from Chile, 0.06–2.00 μg g−1 (Fredes & Montenegro, Citation2006), Czech, 0.11–0.88 μg g−1 (Lachman et al., Citation2007), Turkey black sea region, 9.75–35.8 μg g−1 (Silici et al., Citation2008), and Turkey middle Anatolia, 0.25–1.10 μg g−1 (Tuzen et al., Citation2007).
Only samples originated from Amhara regions (Bure, Debre Markos, and Tillili) showed the presence of manganese. It was found that the maximum concentration of Mn was 7.29 μgg−1 from Tillili, followed by Bure, 0.7 μgg−1 and Debre Markos, 0.36 μgg−1. It was observed that the value obtained was comparable with results reported by Madejczyk and Baralkiewicz, Citation2008 from Poland, 0.02–7.37 μg g−1, Almeida-Silva et al. (Citation2011), from Portugal, 0.83 μg g−1, Suárez-Luque et al. (Citation2005), from Spain, 2.3–5.0 μg g−1, and Tuzen et al. (Citation2007), from Turkey, 0.32–4.56 μg g.−1
Lead was detected in 33.3% (4/12) of the analyzed samples ranging from 0.23 μgg−1 to 2.53 μgg−1. The lowest and the highest lead concentrations were 0.23 μgg−1, in the honey sample from Adigrat and 2.53 μgg−1 in the honey sample from Debre Markos. The variation of the mean level of lead may be attributed to the presence of highways, presence of metal workshops, house construction tools, and use of extensive fertilizers for the production of crops. The lead level in Ethiopian honey was higher than the mean concentration reported by (Chudzinska, Citation2010) from Poland, LD-9.20 μg g−1, Turkey, 0.451 μg g−1(Özcan et al., Citation2006), Turkey central Anatolia, 0.02–1.50 μg g−1 (Leblebici & Aksoy, Citation2008), Turkey Black sea region, 1.54–36.7 μg g−1 (Silici et al., Citation2008), Nigeria, 0.13 μg g−1 (Achudume, 2010), New Zealand, ND-0.0170 μg g−1 (Vanhanen et al., Citation2011), Lithuania, 2.9–22.1 μg g−1 (Staniškienė et al., Citation2006), and Italy sienna, 28.2–304 μg g−1 (Pisani et al., Citation2008).
In this study, Zn was the only metal detected in all analyzed honey samples. The maximum concentration of Zn was found in a honey sample collected from Benchi-Maji, 16.03 μgg−1, and the lowest was from Debre Markos, 9.96 μgg−1. Usually, the use of galvanized containers is the most prominent source of contamination of honey besides the soil and flora differences of forage area (Tuzen et al., Citation2007). All the honey samples analyzed for the presence of Zn exceeded the maximum permitted level established by Codex Alimentarius Commission, 5 μgg−1 (Codex Alimentarius Commission Standards, Citation2002). The mean concentration of Zn reported from Poland, LD −39.7 μg g−1 (Chudzinska & Baralkiewicz, Citation2010), India, 2.55–16.77 μg g−1 (Nanda et al., Citation2003), Egypt, 5.00–9.3 μg g−1 (Rashed & Soltan, Citation2004), Canary Island, 0.18–19.1 μg g−1 (Hernández et al., Citation2005), and Slovenia, 0.55–11.2 μg g−1 (Golob et al., Citation2005) was comparable with the mean concentration of Zn in samples of honey collected from Ethiopia (9.96–16.03 μg g−1)
Figure 2. Distribution of trace metals in honey from different regions of Ethiopia
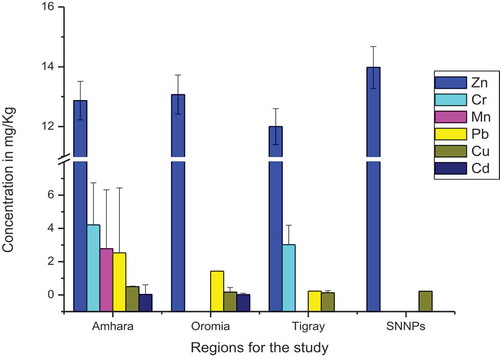
As shown in Figure , honey samples collected from SNNPRs had the highest Zn level, followed by Oromia, Amhara, and Tigray. Cu was found in the highest amount in samples collected from SNNP followed by Amhara, Oromia, and Tigray. Honey collected from SNNPRs and Oromia did not contain Cr while it was detected in samples from Amhara and Tigray regions. The amount of Cr in samples from Amhara region was observed to be higher than that of the Tigray region. Mn was found in honey samples collected from Amhara region only. Pb was detected in samples from the studied regions except SNNPRs. In addition, it has been shown that samples collected from Oromia and Amhara regions show the presence of Cd but it was not detected in honey samples originating from Tigray and SNNP regions. The difference might be associated with geographical causes, recent man-made activities and climatic conditions seen in this top honey-producing regions.
3.3. Evaluation of the nutritional value of Ethiopian honey
To evaluate the nutritional value, one and two tablespoons of each honey were weighed. Considering the concentration of the elements in the honey samples, the contents of those elements in one and two spoons were calculated and compared to their daily dose allowance (D.D.A.) in the human body (Almeida-Silva et al., Citation2011). This study tries to compare three studied metals (Cu, Mn, and Zn). Table summarizes the contribution of two spoons of honey on daily dose allowance. Since there is no stated daily consumption of honey in Ethiopia, it is difficult to compare the toxic effect of heavy metals studied with the continuous and immediate ingestion of honey. The ingestion of two tablespoons of Ethiopian honey represents between 0.035% and 7.29% of the D.D.A.
Table 5. Trace metal Concentrations, amount in one and two spoons of honey, and the contribution of two spoons of ingested honey to (Daily Dose Allowance) D.D.A
4. Conclusion
Honey from Ethiopia collected from different geographical areas was assessed for physicochemical parameters, namely, moisture content, pH, free acidity, lactonic acidity, and total acidity. Trace heavy metals (Cd, Cr, Cu, Mn, Ni, Pb, and Zn) levels were also determined. The values found are in agreement with Codex recommendations. However, the study showed a significant difference between samples collected from different regions in terms of studied physicochemical parameters and heavy metals. The variation may be attributed to greatly on geographical factors, distance of bee forage area from roadsides, soil composition, and anthropogenic sources.
correction
This article has been republished with minor changes. These changes do not impact the academic content of the article.
Acknowledgements
The authors are very grateful to Gemechis Sorsa for his unreserved assistance in laboratory works. The authors are also very grateful to Addis Ababa University, School of Pharmacy, for providing the necessary financial support.
Additional information
Funding
Notes on contributors
Esubalew Adugna
Esubalew Adugna is a lecturer at the Department of Pharmaceutical Chemistry and Pharmacognosy, School of Pharmacy, College of Health Sciences, Addis Ababa University, Ethiopia. His research focuses on analytical aspects of food adulteration detection and drug quality evaluation.
Ariaya Hymete
Ariaya Hymete is a Professor at the Department of Pharmaceutical Chemistry and Pharmacognosy, School of Pharmacy, College of Health Sciences, Addis Ababa University, Ethiopia. His research activities focus on herbal medicine, food and drug analysis as well medicinal chemistry.
Gebremariam Birhanu
Gebremariam Birhanu is an Assistant Professor and currently head Department of Pharmaceutics and social pharmacy, School of Pharmacy, College of Health Sciences, Addis Ababa University, Ethiopia. His research duties encompass nanotechnology, drug and food analysis.
Ayenew Ashenef
Ayenew Ashenef is an Assistant Professor at the Department of Pharmaceutical Chemistry and Pharmacognosy, School of Pharmacy, College of Health Sciences, Addis Ababa University, Ethiopia. He researches on themes that deal with drug and food quality evaluation and counterfeit detection, analytical methods development, health services evaluation and pharmaceutical regulation.
References
- Achumude, A. C., & Nwafor, B. N. (2010). The ecological assessment of metals in local brands of honey in south west nigeria. African Journal of Agriculture Research, 5(18), 2608-14. http://www.academicjournals.org/AJAR
- Aghamirlou, H. M., Khadem, M., Rahmani, A., Sadeghian, M., Mahvi, A. H., Akbarzadeh, A., & Nazmara, S. (2015). Heavy metals determination in honey samples using inductively coupled plasma-optical emission spectrometry. Journal of Environmental Health Science and Engineering, 13(1), 39. https://doi.org/10.1186/s40201-015-0189-8
- Almeida-Silva, M., Canha, N., Galinha, C., Dung, H. M., Freitas, M. D. C., & Sitoe, T. (2011). Trace elements in wild and orchard honeys. Applied Radiation and Isotopes, 69(11), 1592–1595. https://doi.org/10.1016/j.apradiso.2011.01.013
- Ashenef, A. (2014). Essential and toxic metals in tea (Camellia sinensis) imported and produced in Ethiopia. Food Additives and Contaminants: Part B Surveillance, 7(1), 30–36. https://doi.org/10.1080/19393210.2013.831951
- Association of Analytical Communities (AOAC). (2000). Official methods of analysis (17 ed.). Association of Official Analytical Chemists.
- Belay, A., Solomon, W. K., Bultosa, G., Adgaba, N., & Melaku, S. (2013). Physicochemical properties of the harenna forest honey, bale, ethiopia. Food Chemistry, 141(4), 3386-3392. doi: 10.1016/j.foodchem.2013.06.035
- Bogdanov, S., Martin, P., & Lullmann, C. (2002). Harmonised methods of the international honey commission. Swiss Bee Research Centre, FAM, Liebefeld. ihc-paltform.net/ihcmethods2009.pdf
- Braziewicz, J., Fijał, I., Czyżewski, T., Jaskóła, M., Korman, A., Banaś, D., & Zemło, L. (2002). PIXE and XRF analysis of honey samples. Nuclear Instruments and Methods in Physics Research Section B: Beam Interactions with Materials and Atoms, 187(2), 231–237. https://doi.org/10.1016/S0308-8146(01)00132-7
- Buldini, P. L., Cavalli, S., Mevoli, A., & Sharma, J. L. (2001). Ion chromatographic and voltammetric determination of heavy and transition metals in honey. Food Chemistry, 73(4), 487–495. https://doi.org/10.1016/S0308-8146(01)00132-7
- Chudzinska, M., & Baralkiewicz, D. (2010). Estimation of honey authenticity by multielements characteristics using inductively coupled plasma-mass spectrometry (ICP-MS) combined with chemometrics. Food and Chemical Toxicology, 48(1), 284–290. https://doi.org/10.1016/j.fct.2009.10.011
- Codex Alimentarius Commission Standards. (2002). Draft revised standard for honey. 9 - II February 2000. Joint FAO/WHO Food Standards Programme
- De Rodrı́guez, G. O., de Ferrer, B. S., Ferrer, A., & Rodrı́guez, B. (2004). Characterization of honey produced in Venezuela. Food Chemistry, 84(4), 499–502. https://doi.org/10.1016/S0308-8146(02)00517-4
- Deffar, G. (1998). Non-Wood Forest Production in Ethiopia. EC/FAO partner ship programme. Retrieved October, 2019, from http://www.fao.org/DOCREP/003/X6690E/X6690E00.htm
- Fredes, C., & Montenegro, G. (2006). Heavy metal and other trace elements contents in honey bee in Chile. Cien. Inv. Agr. (in English) 33 (1): 50-58. Ciencia E Investigación Agraria, 33(1), 50–58. https://doi.org/10.7764/rcia.v33i1.328
- Gebremedhin, G., Tadesse, G., & Kebede, E. (2013). Physiochemical characteristics of honey obtained from traditional and modern hive production systems in Tigray region, northern Ethiopia. Momona Ethiopian Journal of Science, 5(1), 115–128. https://doi.org/10.4314/mejs.v5i1.85335
- Golob, T., Doberšek, U., Kump, P., & Nečemer, M. (2005). Determination of trace and minor elements in Slovenian honey by total reflection X-ray fluorescence spectroscopy. Food Chemistry, 91(4), 593–600. https://doi.org/10.1016/j.foodchem.2004.04.043
- Hernández, O. M., Fraga, J. M. G., Jiménez, A. I., Jiménez, F., & Arias, J. J. (2005). Characterization of honey from the Canary Islands: Determination of the mineral content by atomic absorption spectrophotometry. Food Chemistry, 93(3), 449–458. https://doi.org/10.1016/j.foodchem.2004.10.036
- Kahraman, T., Buyukunal, S. K., Vural, A., & Altunatmaz, S. S. (2010). Physico-chemical properties in honey from different regions of Turkey. Food Chemistry, 123(1), 41–44. https://doi.org/10.1016/j.foodchem.2010.03.123
- Khuder, A., Ahmad, M., Hasan, R., & Saour, G. (2010). Improvement of X-ray fluorescence sensitivity by dry ashing method for elemental analysis of bee honey. Microchemical Journal, 95(2), 152–157. https://doi.org/10.1016/j.microc.2009.11.001
- Kılıç Altun, S., Dinç, H., Paksoy, N., Temamoğulları, F. K., & Savrunlu, M. (2017). International Journal of Analytical Chemistry. Analyses of Mineral Content and Heavy Metal of Honey Samples from South and East Region of Turkey by Using ICP-MS, 2017 pp. 1-6.. https://doi.org/10.1155/2017/6391454
- Kropf, U., Korosec, M., Bertoncelj, J., Ogrinc, N., Necemer, M., Kump, P., & Golob, T. (2010). Determination of the geographical origin of slovenian black locust, lime and chestnut honey. Food Chemistry, 121(3), 839-846. https://doi.org/10.1016/j.foodchem.2009.12.094
- Küçük, M., Kolaylı, S., Karaoğlu, Ş., Ulusoy, E., Baltacı, C., & Candan, F. (2007). Biological activities and chemical composition of three honeys of different types from Anatolia. Food Chemistry, 100(2), 526–534. https://doi.org/10.1016/j.foodchem.2005.10.010
- Kujawski, M. W., & Namieśnik, J. (2008). Challenges in preparing honey samples for chromatographic determination of contaminants and trace residues. TrAC Trends in Analytical Chemistry, 27(9), 785–793. https://doi.org/10.1016/j.trac.2008.07.004
- Lachman, J., Kolihova, D., Miholova, D., Košata, J., Titěra, D., & Kult, K. (2007). Analysis of minority honey components: Possible use for the evaluation of honey quality. Food Chemistry, 101(3), 973–979. https://doi.org/10.1016/j.foodchem.2006.02.049
- Lazaridou, A., Billiaderis, C. G., Bacandritsos, N., & Sabatini, A. G. (2004). Composition, thermal and rheological behavior of selected greek honeys. Journal of Food Engineering, 64(1), 9-21. https://doi.org/10.1016/j.jfoodeng.2003.09.007
- Leblebici, Z. E. L. I. H. A., & Aksoy, A. H. M. E. T. (2008). Determination of heavy metals in honey samples from Central Anatolia Using Plasma Optical Emission Spectrofotometry (ICP-OES). Polish Journal of Environmental Studies, 17(4), 549–555. http://www.pjoes.com/Determination-of-Heavy-Metals-in-Honey-Samples-r-nfrom-Central-Anatolia-Using-Plasma,88141,0,2.html
- Liben, T., Atlabachew, M., & Abebe, A. (2018). Total phenolic, flavonoids and some selected metal content in honey and propolis samples from south wollo zone, amhara region, ethiopia. Cogent Food & Agriculture, 4(1), 1475925. https://doi.org/10.1080/23311932.2018.1475925
- Madejczyk, M., & Baralkiwicz, D. (2008). Characterization of polish rape and honey dew honey according to their mineral contents using icp-ms and f-aas/aes. Analytical Chimica Acta, 617(1–2), 11–17. https://doi.org/10.1016/j.aca.2008.01.038
- Muñoz, E., & Palmero, S. (2006). Determination of heavy metals in honey by potentiometric stripping analysis and using a continuous flow methodology. Food Chemistry, 94(3), 478–483. https://doi.org/10.1016/j.foodchem.2005.01.022
- Nanda, V., Sarkar, B. C., Sharma, H. K., & Bawa, A. S. (2003). Physico-chemical properties and estimation of mineral content in honey produced from different plants in Northern India. Journal of Food Composition and Analysis, 16(5), 613–619. https://doi.org/10.1016/S0889-1575(03)00062-0
- NIgussie, K., Subramanian, P. A., & Mebrahtu, G. (2012). Physicochemical analysis of tigray honey: an attempt to determine major quality markers of honey. Bulletin of The Chemical Society of Ethiopia, 26(1), 127-133. http://dx.doi.org/10.4314/bcse.v26il.14
- Osman, K. A., Al-Doghairi, M. A., Al-Rehiayani, S., & Helal, M. I. (2007). Mineral contents and physicochemical properties of natural honey produced in Al-Qassim region, Saudi Arabia. Journal of Food Agriculture and Environment, 5(3/4), 142–146. www.world-food.net
- Ouchemoukh, S., Louaileche, H., & Schweitzer, P. (2007). Physicochemical characteristics and pollen spectrum of some Algerian honeys. Food Control, 18(1), 52–58. https://doi.org/10.1016/j.foodcont.2005.08.007:
- Özcan, M., Arslan, D., & Ceylan, D. A. (2006). Effect of inverted saccharose on some properties of honey. Food Chemistry, 99(1), 24–29. https://doi.org/10.1016/j.foodchem.2005.07.009
- Packer, A. P., & Giné, M. F. (2001). Analysis of undigested honey samples by isotope dilution inductively coupled plasma mass spectrometry with direct injection nebulization (ID-ICP-MS). Spectrochimica Acta Part B: Atomic Spectroscopy, 56(1), 69–75. https://doi.org/10.1016/S0584-8547(00)00294-9
- Pisani, A., Protano, G., & Riccobono, F. (2008). Minor and trace elements in different honey types produced in Siena County (Italy). Food Chemistry, 107(4), 1553–1560. https://doi.org/10.1016/j.foodchem.2007.09.029
- Pohl, P. (2009). Determination of metal content in honey by atomic absorption and emission spectrometries. TrAC Trends in Analytical Chemistry, 28(1), 117–128. https://doi.org/10.1016/j.trac.2008.09.015
- Rashed, M., & Soltan, M. (2004). Major and trace elements 111 different types of Egyptian mono-floral and non-floral bee honeys. Journal of Food Composition and Analysis, 17(6), 725–735. https://doi.org/10.1016/j.jfca.2003.10.004:
- Silici, S., Uluozlu, O. D., Tuzen, M., & Soylak, M. (2008). Assessment of trace element levels in Rhododendron honeys of Black Sea Region, Turkey. Journal of Hazardous Materials, 156(1–3), 612–618. https://doi.org/10.1016/j.jhazmat.2007.12.065
- Solayman, M., Islam, M. A., Paul, S., Ali, Y., Khalil, M. I., Alam, N., & Gan, S. H. (2016). Physicochemical properties, minerals, trace elements, and heavy metals in honey of different origins: A comprehensive review. Comprehensive Reviews in Food Science and Food Safety, 15(1), 219–233. https://doi.org/10.1111/1541-4337.12182:
- Staniškienė, B., Matusevičius, P., & Būdreckienė, R. (2006). Honey as an indicator of environmental pollution. Environmental Research, Engineering & Management, 36(2), 53–68. https://hdl.handle.net/20.500.12512/12302
- Suárez-Luque, S., Mato, I., Huidobro, J. F., & Simal-Lozano, J. (2005). Capillary zone electrophoresis method for the simultaneous determination of cations in honey. Journal of Chromatography A, 1083(1–2), 193–198. https://doi.org/10.1016/j.chroma.2005.06.011
- Teka, A. E. (2018). Levels of some selected trace and essential elements in honey from selected woredas of sidama zone, southern region, ethiopia. J Agric Sci, 2(1), 12-18. doi: 10.35841/2591-7897.2.1.12-18
- Terrab, A., Recamales, A. F., Hernanz, D., & Heredia, F. J. (2004). Characterisation of Spanish thyme honeys by their physicochemical characteristics and mineral contents. Food Chemistry, 88(4), 537–542. https://doi.org/10.1016/j.foodchem.2004.01.068
- Tuzen, M., Silici, S., Mendil, D., & Soylak, M. (2007). Trace element levels in honeys from different regions of Turkey. Food Chemistry, 103(2), 325–330. https://doi.org/10.1016/j.foodchem.2006.07.053
- Vanhanen, L. P., Emmertz, A., & Savage, G. P. (2011). Mineral analysis of mono-floral New Zealand honey. Food Chemistry, 128(1), 236–240. https://doi.org/10.1016/j.foodchem.2011.02.064
- Wang, J., & Li, Q. X. (2011). Chemical composition, characterization, and differentiation of honey botanical and geographical origins. In S. Taylor (Ed.), Advances in food and nutrition research (Vol. 62, pp. 89–137). Academic Press. https://doi.org/10.1016/B978-0-12-385989-1.00003-X
- Yohannes, W., Chandravanshi, B. S., & Moges, G. (2018). Assessment of trace metals and physicochemical parametres of commercially available honey in ethiopia. Chemistry International, 4(2), 91-101. https://bosaljournals.com/chemint/images/pdffiles/18-12.pdf