
Abstract
The optimum nitrogen (N) level and planting density (PD) have not been studied for the newly introduced BH-QPM-545 maize variety in the Jabitahinan district agroecology. To determine the optimum N level and PD, field experiments were conducted in the 2014 and 2015 rainy seasons. A factorial arrangement of three N levels (120, 240 and 360 kg ha−1) and four PD (53,333, 61,538, 83,333 and 90,900 plants ha−1 with a corresponding plant spacing of 75 × 25, 60 × 25, 60 × 20 and 55 × 20 cm, respectively) were compared using randomized complete block design with three replications. Analysis of variance (ANOVA) was computed using SAS (version 9.0). The ANOVA showed that plant height, cob number per plant, and cob length were significantly affected by the main effects of N and PD (P < 0.05). But thousand-grains weight was significantly affected by the main effect of planting density only (P < 0.05). All maize yield contributing traits were not significantly affected by the interaction effects of N and PD (P > 0.05). However, Stover and grain yields were significantly influenced by the main effects of N, PD, and their interaction (P < 0.05). Cob length, cob number per plant, stover, and grain yields were increased with increasing N level from 120 to 360 kg ha−1. Besides, cob length, cob number per plant, and thousand-grains weight were decreased with increasing PD from 53,333 to 90,900 plants ha−1. However, stover and grain yields were significantly increased with increasing PD from 53,333 to 90,900 plants ha−1. The highest grain yield was recorded from the combination of the highest N level (360 kg ha−1) and the highest PD (90,900 plants ha−1). But economical grain yield was recorded under the application of 240 kg ha−1 N and 90,900 plants ha−1 although further research using different environments are needed.
PUBLIC INTEREST STATEMENT
Maize is a commonly grown cereal food security crop in Ethiopia. It can be consumed as a boiled, roasted, pancake, and in the form of local drinks prepared from it. The unit cost of calories per US dollar for maize is one and a half and two times lower than wheat and tef respectively. Maize is also a low-cost source of protein in comparison to other cereals. Despite its increment demand for food, yield across the farmers are still low as compared to its potential due to poor production agronomic practices such as inappropriate planting density and fertilizer use. By investigating planting density and nitrogen, the optimum levels of maize plants and nitrogen rates were determined. The results benefit the framers to improve the productivity of BH-QPM-545 maize variety per unit area and would add to the database to develop other recommendations for different varieties and locations
Competing interests
The authors declare no competing interests.
1. Introduction
Maize (Zea mays L.) belongs to the Gramineae family, which originated from America. It was first cultivated in Mexico 7,000 years ago (Hilaire, Citation2000). Though many other portions of cereal are used as food, maize is the most widely consumed crop in Ethiopia. It is a major cereal crop in terms of area coverage, total production, and the number of farm holdings in Ethiopia. Nationally, above 9 million private peasant holders have grown maize on about 2.1 million hectares of land in the 2015 main cropping season (Central Statistical Authority [CSA], Citation2015). The wider adaptability of the crop and the potential to produce more calories were important factors in considering maize as part of the national food security crop (Abate et al., Citation2015). The Amhara region contributed 20% of the total production in the country in 2015 (CSA, Citation2015). The growing demand for food self-sufficiency, increased awareness about maize food value, a wide range of uses, and the introduction of high yielding varieties are the major responsible factors for the increment of maize area coverage in the Amhara region. Despite its increment in area coverage and demand for food, yield across the Amhara region is low and currently, its productivity is about 3.5 t/ha (CSA, Citation2015). The major responsible factors for the low productivity of maize are inappropriate plant spacing, rapid reduction in soil fertility caused by intensive cultivation and mono-cropping, inadequate improved varieties, drought, pests, and diseases. However, with good agronomic practices, the yield potential of the improved hybrid maize varieties is reached about 8 t ha-1 in the Amhar region.
Among others, plant population and nitrogen are the two key determining factors for maize yield increment. Increased plant population together with optimum climate and other agronomic management condition resulted in increased grain yield (Bavec & Bavec, Citation2002). Grain and biological yields increased with an increase in plant population and N level up to optimum levels (Arif et al., Citation2010). However, plant population and N level are highly determined by the environment and the type of the cultivars used. In Ethiopia, different plant populations and N rates were recommended based on the environmental conditions and cultivars used. Medium to late maturing maize varieties produced better yields for densities ranging from 53,000 to 67,000 plants ha−1 in better rainfall areas while lower plant densities in moisture deficit areas gave better yields (Nigussie et al., Citation2002). Similarly, the maximum maize yield was obtained with the application of 92 kg ha−1 N and 69 kg ha−1 P2O5 using a planting density of 44,444 plant ha−1 in Bako areas of Ethiopia (Nigussie et al., Citation2002). Moreover, a fertilizer rate of 120–92 N-P2O5 kg ha−1 and 128–92 N-P2O5 kg ha−1 were recommended for maize in Burie and Dera areas of the Amhara region, respectively, using a planting density of 44,444 plants ha−1 (Tadesse et al., Citation2007). This implied that for each production system and variety used, there is a population that maximizes the utilization of available resources, allowing the expression of maximum attainable grain yield on that environment. There is no single recommendation for all conditions because the optimum density varies depending on nearly all environmental factors as well as on controlled factors, such as soil fertility, cultivars, planting date, and planting pattern, among others (Sangoi et al., Citation2002).
Traditionally, farmers and private sectors in the study area are growing BH-660 and BH-540 hybrid maize varieties using a planting spacing of 80 × 20 cm by applying one seed per hole or 80 × 40 cm by applying two seeds per hole. Some of the growers are also using narrower spacing for the same varieties i.e. 60 × 20 cm, 70 × 20 cm or 75 × 20 cm or 70 × 25 cm using one seed per hole, although most of the farmers are using the same range of fertilizer rate (up to 138–92 N-P2O5 kg ha−1). But, nitrogen demand increase as planting density increases (Buah et al., Citation2010). Otherwise, increasing maize plant population per unit area without increasing nutrients can affect maize during the growing period due to competition for nutrients, light, water, oxygen, etc.
Since 2012, CIMMYT has been working with the Ethiopian Institute of Agricultural Research (EIAR) and the Ministry of Agriculture and other strategic partners to improve food and nutritional security in Ethiopian through the promotion of quality protein maize (QPM) under the Nutritious Maize for Ethiopia (NuME) project (Yasabu, Citation2019). As a result, Non-Governmental Organizations like SIMLESA project in collaboration with Bureau of Agriculture (BoA), and Adet Agricultural Research Center have introduced a new maize variety, BH-QPM-545, and promoting the production of quality protein maize in the Jabitahinan district agroecology of Amhara region (Adet Agricultural Research Center [AARC], Citation2015). However, the optimum N fertilizer requirement and plant population have not been determined for the newly introduced variety in the district. Keeping in view the importance of determining plant density and nitrogen level for the newly introduced variety, the objective of this study was, therefore, to determine the optimum planting density and nitrogen rate for BH-QPM-545 hybrid maize variety production in the Jabitahinan district agroecology.
2. Materials and methods
2.1. Experimental site
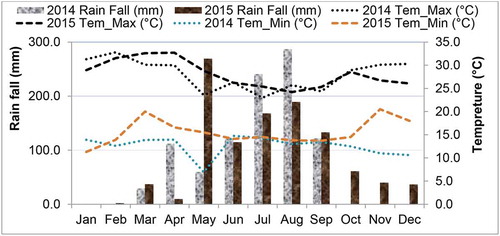
Field experiments were conducted in the Jabitahinan district of the Amhara region in a farmer’s field from the 2014–2015 rainy seasons. Geographically, Jabitahinan has located 10° 41ʹ N latitude and 37°15ʹ E longitude at an altitude of 1941 masl. The sites were representative of the soils and environmental conditions used for maize production in the district, and the farmers were selected with due consultation with the extension workers of the Bureau of Agriculture (BoA). The study area was, characterized by a high rainfall area with a mean annual temperature ranging from 12.72 °C to 29.49 °C with a total annual rainfall of 1271.2 mm. The rainy seasons are from April to November and maximum rain received from June to September. The data on climatic parameters such as rainfall, maximum and minimum temperature recorded at national meteorological stations in the study area in 2014 and 2015 rainy seasons are indicated in Figure . The soils in the district have a clay texture, inherently medium in natural fertility, and a high moisture retention capacity. The predominant soil is deep with red-brown color (Nitosols).
2.2. Experimental treatments, design, and layout
Factorial arrangement of three N levels (120, 240, and 360 kg ha−1) and four planting densities (53,333, 61,538, 83,333, and 90,909 plants ha−1) were compared using BH-QPM-545 maize variety seeds in a randomized complete block design (RCBD) with three replications. Following the specifications of the design, a field layout was prepared and each treatment was assigned randomly to experimental plots within a block. The blocks were separated by a 1.5 m wide-open space, whereas the plots within a block were 0.5 m apart from each other. Each treatment had 5, 6, 6, and 7 rows in 5 m width with a corresponding spacing of 75 × 25, 60 × 25, 60 × 20, and 55 × 20 cm respectively, and two border rows and two plants from the top and bottom side were left without harvesting to avoid border effects.
2.3. Trial management
The experimental field was prepared following the conventional tillage practice before planting in both years. The land was leveled using manual power. Ditches and bunds were constructed for the whole experimental field and each replication. In the first and second year planting was done on 2 June 2014, and 26 May 2015, respectively. Two seeds were sown per stand and 2 weeks after emergence, the seedlings were thinned by hand to leave one per stand to achieve the desired plant population for each plot. Basal application of P at a rate of 138 kg P2O5 ha−1 was made at sowing for each plot treated by nitrogen fertilizer. The N application was split and 1/3rd of the N was applied at sowing and the remaining 2/3rd was applied at the knee height stage of the crop to maximize N efficiency. Urea and TSP were used as sources of N and P2O5, respectively. Two inter-cultivation and weeding were carried out to keep the plots free from weeds and to provide better aeration.
2.4. Soil sampling and laboratory procedures
Before planting composite soil samples were collected from each field at 0–30 cm soil depth. For determination of soil pH-H2O, organic carbon (OC), total nitrogen (TN), available phosphorus (AP), exchangeable potassium (K), cation exchange capacity (CEC). Soil samples were analyzed following standard procedures as outlined in Van Reeuwijk (Citation2006) at Adet Agricultural Research Center soil fertility laboratory. The pH-H2O was measured using 1:2.5 soil to solution suspension using a pH meter. The Walkley and Black method was applied to determine the OC content while TN was determined using the Kjeldahl method (Bremner, Citation1982). The AP (Olsen) was measured using a sodium bicarbonate extraction solution. Exchangeable K+ was determined after leaching the soils with ammonium acetate using a flame photometer following the procedure of Sertse and Bekele (Citation2000).
2.5. Data collections
Growth, yield, and yield contributing traits were collected from the net plot area of each plot to avoid border effects using the standard procedures described below. At physiological maturity, five plants from each plot were randomly selected and tagged to measure yield contributing traits. Plant height, cob number per plant, cob length, thousand-grains weight, stover and grain yields were considered in data collection
2.5.1. Plant height (cm)
It was measured from the base the plant/soil surface to the flag leaf/base of the tassel on the formerly five randomly selected and tagged plants and the average plant height was computed and expressed in centimeters.
2.5.2. Cob number per plant (nos)
It was recorded by counting the number of cobs from the formerly five randomly selected and tagged plants and the average value was computed and expressed in numbers
2.5.3. Cob length (cm)
It was collected by measuring the lengths of the upper cobs after de-husking from 5 randomly selected and tagged plants and the average was worked out and expressed in centimeters for further analysis.
2.5.4. Thousand-grains weight (g)
It was measured by counting thousands of air-dried threshed grains from the bulk harvest in each plot and adjusted to 12.5 % moisture content by weight and expressed in grams for further analysis.
2.5.5. Stover yield (t ha−1)
At harvest, plants from the net plot area were harvested from each plot. After cobs detachment, the stover was air-dried. The weight of these plants was determined using a simple analytical balance. The average measurements of these plants were converted to the weight of stover in t ha−1.
2.5.6. Grain yield (t ha−1)
After harvesting, the cobs were manually threshed on plot bases. Harvesting of plots was done separately per each treatment. De-husking, threshing, and winnowing were manually done. Threshed grains were air-dried and adjusted to 12.5 % moisture content by weight since the standard moisture content of maize and other cereals in Ethiopia is 12.5% (Balemi et al., Citation2019; Chimdessa, Citation2016; Gebreselassie, Citation2015; Giday, Citation2019). Then weighed grains were converted into weight per unit area and expressed as t ha−1.
2.6. Data analysis
2.6.1. Agronomy data analysis
The data collected from the experiment at different growth stages were subjected to statistical analysis. Analysis of variance (ANOVA) was computed for all data using SAS version 9 software (SAS Institute Inc, Citation2007). Homogeneity of error variances was tested using the F test as described by Gomez and Gomez (Citation1984) and the F test was not significant. Thus, a combined analysis of the two years’ data was performed. LSD at the 5 % probability level was carried out for mean separation. Correlation analysis was carried out to study the nature and degree of relationship between yield and various growth and yield components. A correlation coefficient value (r) was calculated and the test of significance was analyzed using the Pearson correlation procedure. The main effects and all interactions were considered significant when P < 0.05.
2.6.2. Partial budget analysis
Partial budget analysis to determine the treatment combination that would give acceptable returns at low risk to farmers was performed using CIMMYT Economics Program, International Maize & Wheat Improvement Center (Citation1988) procedures. The grain yield obtained from each treatment was adjusted downwards by 10% as farmers using the same technologies would obtain yields 10% lower than the yields obtained by researchers because under the experimental condition there was better crop management and small plot size. During the partial budget analysis, the average seed, fertilizer, and grain prices for the two years were considered and performed using Ethiopian Birr (ETB) as a common denominator during the time of input use and maize grain yield at the time of harvest at the local market condition. All costs and benefits were calculated on a hectare basis. The average prices of 1 kg urea, seeds, and grains were 10.13, 44.80, and 4.60 ETB, respectively in the Jabitahinan district. Therefore, the gross benefit (GB) was obtained by multiplying the adjusted grain yield with grain unit price as follows: GB = adjusted grain yield x grain unit price. Total variable cost (TVC) is the aggregate amount of all variable costs associated with the costs of inputs purchased during planting and calculated as follows: TVC = [(amount of urea x urea unit price)+(amount of seed x seed unit price)]. Net benefit (NB) is determined by subtracting all variable costs from the gross benefit as follows: NB = GB -TVC. The cost that varied for each treatment was ranked in order of ascending variable costs for dominance analysis. Dominance analysis was used to eliminate those treatments which cost more but produced the lower net benefit. The marginal rate of return (MRR) was calculated for two non-dominated treatments (say 1 & 2) using the formula: [change in net benefit (NB2−NB1)/change in TVC (TVC2−TVC1)] × 100 and a minimum acceptable MRR of 100% was assumed. Therefore, 100% MRR indicates that for every one Birr invested for variable inputs, there is one Birr return on.
3. Results and discussion
3.1. Soil physico-chemical properties of the experimental site
The results of the soil analysis are presented in Table . The soil had a pH of 5.15 (1:2.5 in water), 2.142 % organic carbon (OC), 0.19 % total N(TN), 8.36 ppm available (Olsen) P, 0.95 cmol(+) kg−1K, and cation exchange capacity (CEC) of 29.68 cmol(+) kg-1. According to Landon (Citation1991), the soil is strongly acidic, has high CEC, Low OC, and TN and medium available P. According to FAO (Citation2006) the soil of the experimental site has high exchangeable potassium.
Table 1. Soil physical and chemical properties of experimental soils at Jabitahinan
3.2. Effects of growing seasons, nitrogen and planting density on maize yield and yield components
Analysis of variance (ANOVA) for the effects of the growing year, nitrogen, planting density, and their interactions on all maize yield and yield contributing traits measured during the investigation are presented in Table . The interaction between nitrogen level and planting density had a non-significant effect on plant height, cob number plant per plant, cob length, and thousand-grains weight at P > 0.05. However, the interaction between nitrogen level and planting density had a significant effect on maize stover and grain yields at P < 0.01. The interaction between growing years and nitrogen level, and growing years and planting density were significant only for maize stover and grain yields. The interaction among growing years, nitrogen level, and planting density were significant only for stover and grain yields. Maize yield and yield contributing traits were significantly influenced by the growing years (Table ). The difference between growing years for the measured traits is expected because the two growing years have distinct rainfall conditions. During the second growing year, almost all the measured yield and yield contributing traits were significantly better than the first growing year due to the presence of extended rainfall from February to December in the second growing year (Figure ). This may favor the crop to have a better cob length and cob numbers which finally influence the grain yield.
Table 2. Mean square values for effects of year, nitrogen, planting density and their interaction on maize grain yield & yield components at Jabitahinan (2014 & 2015 years)
The ANOVA depicted that the measured yield and yield contributing traits such as cob length, stover, and grain yields were significantly affected by the main effects of N and PD at P < 0.01. Plant height and the number of cobs per plant were significantly affected by the main effect of N and PD, respectively at P < 0.01. Moreover, plant height and the number of cobs per plant were significantly affected by the main effect of PD and N, respectively at P < 0.05. However, thousand-grains weight was not significantly influenced by the main effect of nitrogen level at P > 0.05 though it was influenced by the main effects of planting density at P < 0.01.
Figure 1. Monthly rainfall, mean monthly maximum and minimum temperature of the study area for the year 2014 and 2015 cropping seasons in Jabitahinan district.
3.2.1. Plant height
Plant height is ranged from 242.6 to 259.02 cm (Table ). The shortest plants were recorded from the lowest nitrogen level (120 kg ha−1) while the tallest plants were recorded from the application of 240 kg N ha−1. But, no significant plant height difference was observed between the treatments that received a nitrogen level of 240 and 360 kg ha−1. Increasing the general trend was observed for plant height with increasing nitrogen level from 120 to 360 kg ha−1 (Table ). Higher N applications increase the cell division, cell elongation, green foliage. This might increase the chlorophyll content to facilitate the rate of photosynthesis and extension of stem resulting in increased plant height. This result agreed with Dawadi and Sah (Citation2012) and Rafiq et al. (Citation2010) who investigated that plant height increased with increasing nitrogen levels. Similarly, there was an increasing general trend of plant height with increasing plant density from 53,333 to 90,909 plants ha−1 (Table ). Significantly the tallest plants were recorded from a planting density of 61,530 plants ha−1 while the shortest plants were obtained from the lowest planting density (53,333 plants ha−1). However, there is no significant difference between 61,530, 83,333, and 90,909 plants ha−1 in terms of plant height. The tallest plants from the highest planting density might be due to competition for light may influence the plants to grow up at a higher planting density than the lower planting density. This result agreed with Imran et al. (Citation2015), Rafiq et al. (Citation2010), and Dawadi and Sah (Citation2012) who investigated that plant height increased with planting density.
Table 3. Maize grain yield and yield-related traits as affected by nitrogen fertilizer level and planting density at Jabitahinan (Combined over seasons, 2014 and 2015)
3.2.2. Cob length
Cob length was significantly affected by the main effects of nitrogen level and planting density. The tallest cobs were recorded from the highest nitrogen level (360 kg ha−1) whereas the shortest cobs were recorded from the lowest nitrogen level (120 kg ha−1) (Table ). This result agrees with the result of Mahdi and Ismail (Citation2015) who reported that cob length increased with increasing nitrogen level. In the case of planting densities, the tallest cobs were recorded from lowest plant density (53,333 plants ha−1) whereas the shortest cobs were recorded from the highest planting densities (90,909 plants ha−1). A similar result was confirmed by Saha et al. (Citation1994) who reported that cob length tended to decline with increasing plant population.
3.2.3. Cob number per plant
Cob number per plant was significantly influenced by the main effects of nitrogen level and planting density. Cob number per plant was consistently increased with increasing nitrogen levels from 120 kg ha−1 to 360 kg ha−1 (Table ). The highest number of cobs from a plant was recorded from the highest nitrogen level (360 kg ha−1) whereas the lowest number of cobs from a plant was recorded from a treatment receiving the lowest nitrogen level (120 kg ha−1). Higher accumulation of dry matter in plant and effective translocation of photosynthates from source to sink might have further improved this yield attribute. A similar finding was reported by Moraditochaee et al. (Citation2012) who stated that the number of cobs per plant increased with increasing nitrogen level. Significantly the highest number cobs from a plant were recorded at a lower planting density (53,333 plants ha−1) while the lowest number of cobs from a plant was recorded from the highest planting density (90,909 plant ha−1). The highest number of cobs per plant with wider spacing was due to lower competition for light, moisture, nutrient, and air. A similar result was reported by Rahman and Paul (Citation2016) who stated that cob number per plant increased with decreasing planting density.
3.2.4. Thousand-grains weight
Thousand-grains’ weight was not significantly affected by the main effect of the nitrogen level. But the main effect of planting density significantly affected a thousand-grains weight. Numerically, a thousand-grains weight was increased with increasing nitrogen levels (Table ). The increment in thousand-grains weight with nitrogen level might be due to increased assimilate partitioning to the seeds with increasing nitrogen level. Thousand-grains weight was significantly decreased with increasing plant density. Significantly, the maximum thousand-grains weight was recorded from the lowest planting density (53,333 plants ha−1) though no significant difference was observed among the planting densities of 61,538, 83,333, and 90,909 plants ha−1. The highest thousand-grains weight from the lowest planting density might be due to lower competition for light, moisture; nutrient, and air that increased assimilate partitioning to the grains. Similar results were reported by Kamara et al. (Citation2016) on cowpea and Rahman and Paul (Citation2016) on maize who stated that higher grains weight was recorded at lower planting density.
3.2.5. Grain and stover yields
Grain and stover yields were significantly affected by the main effects of nitrogen level, planting density, and their interaction. They were consistently increased with increasing nitrogen levels from 120 kg ha−1 to 360 kg ha−1 (Table ). The maximum and the minimum grain and stover yields were recorded from the highest (360 kg ha−1) and the lowest (120 kg ha−1) nitrogen level, respectively. In this study, variations in the level of nitrogen can powerfully affect grain and stover yields significantly. Many researchers have reported that as increased maize grain and stover yields due to increased nitrogen levels up to optimum levels (Arif et al., Citation2010; Moraditochaee et al., Citation2012; Satchithanantham & Bandara, Citation2001). This might be due to increased availability of N, causing accelerated photosynthetic rate, and thus leading to the production of more carbohydrates resulted in high cob lengths, thousand-grains weight, and cob number per plant. These finally contributed to the higher grain and stover yields. These results are agreed with Mahmood et al. (Citation2001) and Moraditochaee et al. (Citation2012) findings. In the case of planting densities, the maximum grain and stover yields were recorded from the highest planting density (90,909 plants ha−1) whereas the minimum grain and stover yields were recorded from the lowest planting density (53,333 plant ha−1). The increase in grain and stover yields consistently with increasing plant density is due to the number of plants or cobs per unit area. These results are in closed conformity with the results of Arif et al. (Citation2010) who reported that maximum economic grain yield was obtained with increasing plants per unit area.
The interaction effects of nitrogen fertilizer and planting density on grain yield and stover yield at P < 0.01 probability level was significant (Table ). As shown in Table , comparison of means between interaction effect showed that the highest grain (13.93 t ha−1) and stover (17.57 t ha−1) yields were recorded from the highest nitrogen level (360 kg ha−1) and the highest planting density (90,909 plants ha−1) whereas the lowest grain (8.7 t ha−1) and stover (10.11 t ha−1) yields were recorded from the lowest nitrogen level (120 kg ha−1) and the lowest planting density (53,333 plants ha−1). These results implied that there is a possibility of maximizing grain and stover yields per unit area by increasing plant density with adequate plant nutrients and favorable environmental conditions. Because nitrogen demand may increase as planting density increases (Buah et al., Citation2010). Otherwise, increasing maize population per unit area without increasing nutrients can affect maize during the growing period due to competition in using nutrients, light, water, oxygen, etc.
Table 4. The interaction effect of nitrogen fertilizer and planting density on straw and grain yield at Jabitahinan (combined over seasons, 2014 and 2015)
3.3. Correlations among maize yield components
As it is indicated in Table , the correlation studies among maize agronomic parameters were quantified and the week and strong correlation were observed between grain yield and yield-related traits. Overall, grain yield was positive and strongly correlated with plant height and stover yield. However, cob length and cob number had a weak correlation with grain yield, and a thousand-grains weight had a week and negative correlation with grain yield implied that grain yield is due to the number of cobs per plant per unit area rather than due to grain weights.
Table 5. Correlation of yield and yield-related traits of maize as affected by nitrogen and planting density
3.4. Partial budget analysis of grain yields in response to nitrogen level and planting density
The best treatments that gave the highest grain yield were identified but it might not be economical for final recommendation. The computation of total variable cost (TVC), net benefit analysis (NB), dominance analysis and the marginal rate of return (MRR) revealed that the best economical treatment combination was recorded from the application of 240 kg ha−1 nitrogen and 90,900 plants ha−1 that gave the grain yield of 12.84 t ha−1 with the net benefit value of 45,979.66 Birr ha−1 and MRR 3168.15 % (Table ). Thus, for BH-QPM-545 hybrid maize, returns to fertilizer and seed use is more than the 100% rate of return is assumed to be the minimum requirement for the technology to be adopted widely by smallholder farmers in developing countries. Under a 100% MRR is low and unacceptable by farmers (CIMMYT Economics Program, International Maize & Wheat Improvement Center, Citation1988). This is because such a return would not offset the cost of inputs. Thus, the change from farmers’ former practice of fertilizer and seed usage to the application of 240 kg N ha−1 and a planting density of 90,909 plants ha−1 is a promising new practice for farmers under the prevailing price structure.
Table 6. Total variable cost, gross benefit, net benefits and marginal rate of return for nitrogen rate and planting density in response to maize grain yield
4. Conclusions
Performing a 2-year field experiment in Jabitahinan agroecology, BH-QPM-545 maize grain yield could be improved through the application of optimum nitrogen and plant population. The highest economical grain yield was recorded under 240 kg ha−1 N and 90,909 plants ha−1 with a corresponding planting spacing of 55 × 20 cm which can be recommended for the study area. Further research on nitrogen level and planting density across a wide range of environments are needed, particularly on those sites where different environmental conditions prevail since the research was limited to one location.
Authors’ contributions
Abebe Worku coordinated and executed experiments. Moreover, he analyzed the data and wrote the manuscript. Bitwoded Derebe performed the experiments and collected and organized all the necessary data. Yayeh Bitew proposed the experiment and set the design of this experiment. Gobeze Cheklie performed the experiments and collected all the necessary data. Mequanint Andualem participated in data collection. All authors approved the manuscript.
Acknowledgements
The Adet Agricultural Research Center is highly acknowledged in the financial as well as vehicle support rendered to conduct this study.
Additional information
Funding
Notes on contributors
Abebe Worku
Abebe Worku holds a Masters’s degree in Agronomy from Bahir Dar University, Ethiopia in July 2015. Then, he was employed by Bahir Dar University and serving as a research expert in CASCAPE project. His key areas of interest are Agronomy and soil fertility and the like.
Bitwoded Derebe
Bitwoded Derebe obtained his MSc degree in Agronomy from Bahir Dar University, Ethiopia. Then, he was employed by Adet Agricultural Research Center and serving as assistant researchers II. His key research interests are agronomy and soil fertility management.
Yayeh Bitew
Yayeh Bitew holds his MSC degree from Mekele University, Ethiopia. Then, he was employed by Adet Agricultural Research Center and serving as associate researchers II. His key research interests are agronomy and soil fertility management.
Gobezie Chakelie
Gobezie Chakelie obtained his BSc degree from Hawassa University, Ethiopia. Then, he was employed by Adet Agricultural Research Center and serving as assistant researchers I.
Meqanint Andualem
Meqanint Andualem obtained his BSc degree from Debre Markos University, Ethiopia.
References
- AARC Adet Agricultural Research Center (AARC). (2015). Unpublished progress report of the period 2014/2015.
- Abate, T., Shiferaw, B., Menkir, A., Wegary, D., Kebede, Y., Tesfaye, K., Kassie, M., Bogale, G., Tadesse, B., & Keno, T. (2015). Factors that transformed maize productivity in Ethiopia. Food Security, 7(5), 965–14. https://doi.org/10.1007/s12571-015-0488-z
- Arif, M., Amin, I., Jan, M. T., Munir, I. Q. B. A. L., Nawab, K. H. A. L. I. D., Khan, N. U., & Marwat, K. B. (2010). Effect of plant population and nitrogen levels and methods of application on-ear characters and yield of maize. Pakistan Journal of Botany, 42(3), 1959–1967.
- Balemi, T., Rurinda, J., Kebede, M., Mutegi, J., Hailu, G., Tufa, T., Abera, T., & Sida, T. S. (2019). Yield response and nutrient use efficiencies under different fertilizer applications in maize (Zea mays L.) in contrasting agro ecosystems. International Journal of Plant & Soil Science, 29(3), 1–19. https://doi.org/10.9734/ijpss/2019/v29i330141
- Bavec, F., & Bavec, M. (2002). Effects of plant population on leaf area index, cob characteristics, and grain yield of early maturing maize cultivars (FAO 100–400). European Journal of Agronomy, 16(2), 151–159. https://doi.org/10.1016/S1161-0301(01)00126-5
- Bremner, J. M. (1982). Total nitrogen. Methods of soil analysis (Vols. 10, 2). American Society of Agrononmy Mongraph.
- Buah, S. S. J., Abatania, L. N., & Aflakpui, G. K. S. (2010). Quality protein maize response to nitrogen rate and plant density in the Guinea Savanna zone of Ghana. West African Journal of Applied Ecology, 16(1), 9–21. https://doi.org/10.4314/wajae.v16i1.55865
- Central Statistical Authority (CSA). (2015). Agricultural sample survey 2014/2015 Report on Area and Production of Major Crops for 2014/2015 in Main (Meher) Season, Ethiopia. Agricultural Sample Survey Statistical Bulletin (Vol. 1).
- Chimdessa, D. (2016). Blended fertilizers effects on maize yield and yield components of Western Oromia, Ethiopia. Agriculture, Forestry and Fisheries, 5(5), 151–162. https://doi.org/10.11648/j.aff.20160505.13
- CIMMYT Economics Program, International Maize, & Wheat Improvement Center. (1988). From agronomic data to farmer recommendations: An economics training manual (No. 27). CIMMYT.
- Dawadi, D. R., & Sah, S. K. (2012). Growth and yield of hybrid maize (Zea mays L.) in relation to planting density and nitrogen levels during winter season in Nepal. Tropical Agricultural Research, 23(3), 218–227. https://doi.org/10.4038/tar.v23i3.4659
- FAO. (2006). Guideline for soil description (4th ed.). Food, and Agriculture Organization of the UN.
- Gebreselassie, Y. (2015). The effect of N fertilizer rates on agronomic parameters, yield components, and yields of maize grown on Alfisols of North-western Ethiopia. Environmental Systems Research, 4(1), 21. https://doi.org/10.1186/s40068-015-0048-8
- Giday, O. (2019). Effect of type and rate of urea fertilizers on nitrogen use efficiencies and yield of wheat (Triticum aestivum) in Northern Ethiopia. Cogent Environmental Science, 5(1), 1655980. https://doi.org/10.1080/23311843.2019.1655980
- Gomez, K. A., & Gomez, A. A. (1984). Statistical procedures for agricultural research. John Wiley & Sons Inc.
- Hilaire, L. (2000). Corn: An American native. Spanning the Gap the Newsletter of Delaware Water Gap National Recreation Area, 22(1), 2.
- Imran, S., Arif, M., Khan, A., Khan, M. A., Shah, W., & Latif, A. (2015). Effect of nitrogen levels and plant population on yield and yield components of maize. Advances in Crop Science and Technology, 3(2), 1–7. http://www.bioline.org.br/abstract?id=cs94010&lang=en
- Kamara, A. Y., Tofa, A. I., Boahen, S. K., Solomon, R., Ajeigbe, H. A., & Kamai, N. (2016). Effects of plant density on the performance of cowpea in Nigerian Savannas. Experimental Agriculture, 1–13. doi: 10.1017/S0014479716000715
- Landon, J. R. (1991). Booker tropical soil manual: A handbook for soil survey and agricultural land evaluation in the tropics and subtropics. John Wiley & Sons Inc.
- Mahdi, A. H., & Ismail, S. K. (2015). Maize productivity as affected by plant density and nitrogen fertilizer. International Journal of Current Microbiology and Applied Sciences, 4(6), 870-877.
- Mahmood, M. T., Maqsood, M., Awan, T. H., & Rashid, S. (2001). Effect of different levels of nitrogen and intra-row plant spacing on yield and yield components of maize. Pakistan Journal of Agricultural Sciences, 38, 1–2.
- Moraditochaee, M., Motamed, M. K., Azarpour, E., Danesh, R. K., & Bozorgi, H. R. (2012). Effects of nitrogen fertilizer and plant density management in corn farming. ARPN Journal of Agricultural and Biological Science, 7(2), 133–137.
- Nigussie, M., Tanner, D., & Twumasi-Afriyie, S. (Eds.). (2002). Enhancing the contribution of maize to food security in Ethiopia. Proceedings of the second national maize workshop of Ethiopia: 12-16 November 2001, Addis Ababa, Ethiopia: CIMMYT.
- Rafiq, M. A., Ali, A., Malik, M. A., & Hussain, M. (2010). Effect of fertilizer levels and plant densities on yield and protein contents of autumn planted maize. Pakistan Journal of Agricultural Science, 47(3), 201–208. http://www.pakjas.com.pk
- Rahman, M. M., & Paul, S. K. (2016). Effects of spacing and nitrogen levels on yield and yield contributing characters of maize. Journal of the Bangladesh Agricultural University, 14(1), 43–48. https://doi.org/10.3329/jbau.v14i1.30595
- Saha, H. M., Gacheru, E. N., Kamau, G. M., O’Neill, M. K., & Ransom, J. K. (1994). Effect of nitrogen and plant density on the performance of pwani hybrid maize. African Crop Science Journal, 2(1), 63–67. http://www.bioline.org.br/abstract?id=cs94010&lang=en
- Sangoi, L., Gracietti, M. A., Rampazzo, C., & Bianchetti, P. (2002). Response of Brazilian maize hybrids from different eras to changes in plant density. Field Crops Research, 79(1), 39–51. https://doi.org/10.1016/S0378-4290(02)00124-7
- SAS Institute Inc. (2007). SAS guide for personal computers (9th ed.).
- Satchithanantham, S., & Bandara, D. C. (2001). Effects of nitrogen fertilizer and irrigation on growth performance of maize (Zea mays L.) in the mid-country of Sri Lanka. Tropical Agricultural Research, 13, 431–434.
- Sertse, S., & Bekele, T. (2000). Procedures for soil and plant analysis technical paper. Ethiopian Agricultural Research Organization, National Soil Research Center.
- Tadesse, T., Liben, M., Assefa, A., & Marie, A. (2007). Maize fertilizer response at the major maize growing areas of northwest Ethiopia. In E. Abate, A. Teshome, M. Wale, T. Desalegn, & T. Tadesse (Eds.), Proceedings of the 1st regional conference on completed crop research activities, August 14–17, 2006, Bahir Dar, Ethiopia: Amhara Regional Agricultural Research Institute.
- Van Reeuwijk, L. (2006). Procedures for soil analysis (6th ed.). International soil reference and information center (ISRIC).
- Yasabu, S. (2019, May 14). Sustaining the production and demand of quality protein maize in Ethiopia. Health and Nutrition. https://www.cimmytorg/news/sustaining-the-production-and-demand-of-quality-protien-maize-in-ethiopia/