
Abstract
Sorghum is the most important cereal crop in moisture deficit areas of eastern ethiopia. It is widely distributed throughout Ethiopia and it is the most important cereal in the lowland areas because of its drought tolerance. Eight released sorghum varieties were evaluated in four environments in the Wag-Hemra and Lasta in the main production season for two consecutive years (2016 and 2017). The objective of the trial was to identify high yielding sorghum varieties that possesse farmers preferred traits for production in both testing sites. The trial was conducted using a randomized complete block design with three replications. The GGE statistical model was used to analyze genotype by environment interaction and to assess the stability of sorghum variety for grain yield. A combined analysis of variance for grain yield and yield-related traits showed that the main effects of both genotypes and environments, and the interaction effect, were highly significant (P ≤ 0.001). The mean values of grain yield ranged from 1300 kg ha−1 (Dagim) to 2800 kg ha−1 (Melkam) with the overall mean values of 2100 kg ha−1. Based on the GGE biplot analysis, high yielding variety Melkam (2800 kg ha−1) showed better performance and stability across the test environments. In addition, the result of participatory variety selection (PVS) revealed that Melkam ranked first and second preferred sorghum variety in Lasta and Waghimira agro-ecologies, respectively. Therefore, we recommend Melkam for production in both agro-ecologies and similar areas of the country. This variety will play a role in enhancing farmers’ income through increasing grain yield, especially in the dry lowlands areas of Wag-himra and Lasta.
Key words:
PUBLIC INTEREST STATEMENT
The eastern part of Amhara Region including Wghmira zone is one of the most suitable areas for sorghum production and it is mostly produced by smallholders and farmers. In spite of its importance the production is manly constraints by the lake of improved variety majorly and lake of the use of improved technology. In the dry land area like sekota, wollo, Ethiopia, Sorghum is the major staple crop and farmers know currently use the local variety which is low yielder and late maturing (above 6 months) and different stakeholders needs the research activity. So the use of improved variety such as Melkam is very important for better yield and early maturing in the production area.
Competing Interests
The authors declares no competing interests.
1. Introduction
Sorghum (Sorghum bicolor(L.)Moench.) is an important cereal crop, particularly in the world’s semi-arid tropics. It is a major food crop in sub-Saharan Africa and South Asia and is the staple food for the most food-insecure people in the world (Bibi et al., Citation2010). It is the world’s fifth most important cereal, after wheat, rice, maize and barley (FAO, Citation2010). More than 105 countries in Africa, Asia, Oceania and the Americas grow sorghum on 40 million hectares (Kumar et al., Citation2011), and 60% of this land is in Africa, where it continues to play an important food security role (Mutegi et al., Citation2011). Ethiopia is the center of origin and diversity for sorghum (Doggett, Citation1988; Mekbib, Citation2006). It is widely distributed throughout Ethiopia and it is the most important cereal crop in the lowland areas because of its drought tolerance (Kebede, Citation1991).
Sorghum is the most important crop in the moisture deficit areas of eastern Amhara. It used as whole flour mostly for making injera. The flour is also used for the preparation of kita (non-fermented unraised bread or unleavened bread) and local alcoholic drinks (Central Statistical Agency [CSA], Citation2017). Besides the grain, sorghum straw is an important feed for livestock. However, the productivity of sorghum is low 1520 kg/ha in Wag-himra (CSA, Citation2017). The low productivity is contributed by drought, poor soil fertility and lower-yielding varieties.
Because of the significance of sorghum for food security in the drought prone areas, development of early maturing varieties with reasonable yields have been a main focus of breeding programs in Ethiopia and in Sub-Saharan Africa (Adugna, Citation2007; McGuire, Citation2005; Mekbib, Citation2006). For the past five decades, many early maturing sorghum varieties were developed and released for lowland parts of Ethiopia by the Federal and Regional Agriculture Research Centers and Universities. Therefore, the objective of this study was to select high yielding and farmers preferred sorghum varieties for the low land areas of wag lasta.
2. Material and methods
2.1. Plant materials, experimental site and experimental design
Eight nationally and regionally released sorghum varieties and a local check were evaluated in 2016 and 2017 during the main cropping seasons at Aybera and Lalibela testing trial sites. Both testing sites represent the low land sorghum growing environments of the Waghimra and Lasta. Description of the experimental location and the sorghum varieties is presented in Tables and .
Table 1. Description of the experimental area used for evaluation of the sorghum varieties
Table 2. Description of the tested sorghum varieties
The experiment was laid out on Randomized Completely Block Design (RCBD) with three replications. Each variety was planted on a plot size of 18.75 m2 (5 m length by 3.75 m width), with an intra- and inter-row spacing of 0.15 and 0.75 cm, respectively. Nitrogen and Phosphorous fertilizers were applied in the form of Urea and NPS at the rate of 41 kg ha−1 N and 46 kg ha−1P2O5, respectively. All the recommended P2O5 and half of the Nitrogen were applied during planting whereas the remaining half of Nitrogen was top-dressed at the knee-height stage.
2.2. Data collection and statistical analysis
Phenotypic data on quantitative traits were collected on plant and plot basis. Days to 50% heading (DH), and days to 90% maturity (DM) were measured on plots basis. Plant height (PH, in cm), head length (HL, in cm), and head weight (HW, in cm) were measured on five randomly selected plants per plot. Grain yield (GY; grams of grain produced per plot, which is later converted in kg/ha) and thousand seed weight (TSW) were measured on the plots basis as per IBPGR and ICRISAT (Citation1993).
Farmers’ participatory varietal selection was conducted to select sorghum variety that possesses farmers’ preferred traits and farmers make a selection on the four baby trials. The baby trials were a single replication and the farmers land which the baby is planning is considering as a single replication. A total of 16 farmers (Men = 12, Women = 4) have participated in the participatory selection of sorghum variety at the physiological maturity stage of the crop. Farmers listed the traits they used to evaluate a sorghum variety, which were ranked by their importance. Each sorghum variety was evaluated by farmers based on the overall performance of each variety related to the three farmer traits including earliness, head length and seed color.
The R statistical software was used to plot histogram and boxplot to check the distribution of pheno-agronomic traits. Analysis of variance was computed using SAS software V9.0 (SAS Institute, Cary, USA). Combined data analysis was computed after testing the homogeneity of error variances using Bartlett’s test (Gomez & Gomez, Citation1984). Mean separation was carried out using least significant difference (LSD) at 5% level of significance. The correlation was plotted among pheno-agronomic traits using R/corrplot using corrplot function. Genotype and genotype by environment interaction biplot analysis (Yan, Citation2002) and correlation analysis were computed using GENSTAT software program 18th edition.
3. Result and discussion
3.1. Grain yield and yield-related traits
The distribution of phenol-agronomic traits was normal or nearly normal for combined over sites (Figure ). These traits were different under the four environments (Figures and ). A combined analysis of variance for seven traits of the eight sorghum varieties and one local check tested across four environments is presented in Table . The analysis of variance for grain yield and yield-related traits showed that the main effects of both genotypes and environments, and the interaction effect, were highly significant (P ≤ 0.001). This indicates that genotype, environment and their interaction are important in governing the expression of these traits. The significant genotype by environment interaction resulted either from differential responses of the variety to the test growing environments for these traits or changes in the relative ranking of genotypes (Figures and ). Adugan (Citation2008) in sorghum reported a similar results which showed a significant difference of genotypes, environment and genotype by environment effect for grain yield in dry hot lowlands of Ethiopia see Table .
Table 3. Combined analysis of variance from nine sorghum varieties for seven traits
Table 4. Mean values of grain yield and yield-related traits of sorghum varieties tested at four environments
The number of days to maturity combined over four environments ranged from 117 days (Meko and Melkam) to 132 days (Geremew) with an average day of 123. The mean values of head length ranged from 17 cm (Chare) to 28 cm (Dagim), with a mean of 22 cm. The mean value of thousand kernel weight ranged from 18 gm (Geremew) to 31 gm (Meko and Mesay) with the average values of 26 gm. The mean values of grain yield ranged from 1300 kg ha−1 (Dagim) to 2800 kg ha−1 (Melkam) with the average values of 2100 kg ha−1. These results show that there was a reduction in grain yield as compared to the national productivity of sorghum in Ethiopia, which is 2525 kg ha−1(CSA, Citation2017), indicating the effect of moisture deficit on the yield of sorghum at Wag–himra and Lasta is very important. In general, these areas are characterized by a highly unreliable rainfall with a limited amount and erratic distribution, which causes significant yield reduction and sometime total failure of sorghum in the areas (SDARC Annual Progress Research Reports for the period 2006/07 to 2014/15). Previous reports indicated that the major cause of grain yield reduction during moisture deficit is mainly associated with a reduction in grain size (Blum et al., Citation1989; Yadav et al., Citation2003 in sorghum; Ozturk & Aydin, Citation2004 in wheat).
Figure 1. Pheno-agronomic traits distribution for combined data over sites. On the x-axis, the mean value of traits are indicated according to legend. On the y-axis, the frequency of the sorughum varieties per traits in percent. The bell-shaped distributions for the majority of the traits, confirming the normality of the data.
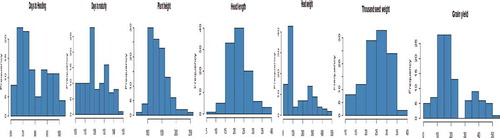
Figure 2. Agronomic traits comparison between sorghum varities over 4 test environments. On the x-axis, the test environmets as Ev1 = Aybra 2008/2009; Ev2 = Aybra 2009/2010; Ev3 = Lalibela 2008/2009; Ev4 = Lalibela 2009/2010. On the y-axis, the estimated agronomic traits, values for days to maturity (DM, days)m, plant height (PH, cm), Head length (HL, cm), Head weight (HW, gm), 1000 kernel weight (TKW, gm) and Grain yield (GY, kg/ha). The box plot shown the varation per testing sites for each trait in maching colors for each genotypes as V1 = Melkam; V2 = Dekeba; V3 = Dagim; V4 = Geremew; V5 = Chare; V6 = Mesay; V7 = Gambella; V8 = Meko; V9 = Local, according to the legend.
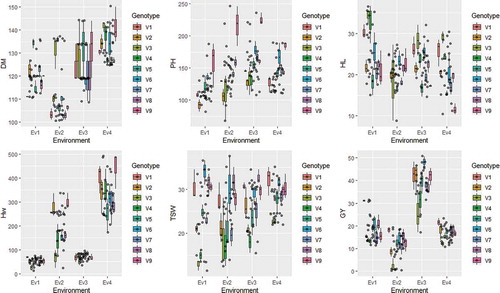
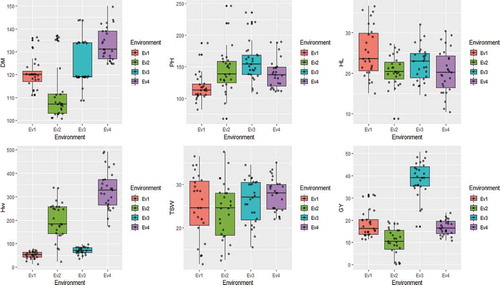
Figure 3. Comparison of gronomic traits of sorghum varieties over 4 testing environments. On the x-axis, the test environmets as Ev1 = Aybra 2008/2009; Ev2 = Aybra 2009/2010; Ev3 = Lalibela 2008/2009; Ev4 = Lalibela 2009/2010, according to the legend. On the y-axis, the estimated agronomic traits, values for days to maturity (DM, days)m, plant height (PH, cm), Head length (HL, cm), Head weight (HW, gm), 1000 kernel weight (TKW, gm) and Grain yield (GY, kg/ha). The box plot shown the variation per testing sites for each trait in maching colors for each genotypes, according to the legend.
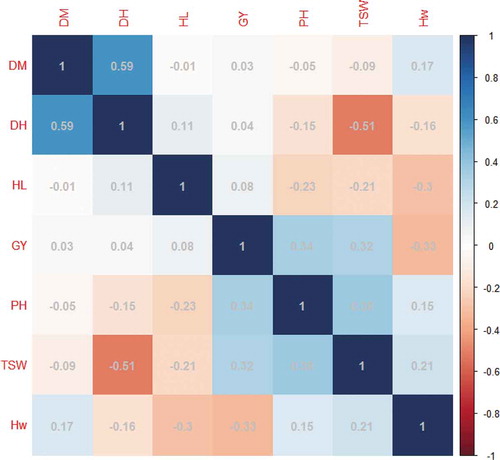
The correlation among traits is presented in Figure . Grain yield had a positive and significant association with a thousand kernel weight and plant height. The results agree with previous studies by (Bezabih et al., Citation2017; Kadam et al., Citation2002; Khizzah & Miller, Citation1992) in sorghum who reported a positive correlation between grain yield with plant height and thousand kernel weight. A significant association was observed in the following pairs of traits; days to heading with days to maturity and thousand kernel weight, plant height with thousand kernel weight and head length; head weight with head length and thousand kernel weight. The presence of association is the indication that those traits are conditioned by the same set of gene, is it in the positive or negative direction (Falconer, Citation1989). Therefore, selection for one trait can indirectly introduce changes in the other trait in positive or negative direction due to either genetic linkage or the existence of a pleiotropic gene effect or both (Falconer, Citation1989).
Figure 4. Correlations among pheno-agronomic traits. Direction and the strength of the correlation is indicated by color, red and blue for negative and positive direction, respectively.
3.2. Participatory variety selection (PVS)
Results of PVS showed that, local check was the least preferred variety in both testing sites (Data not shown), this approach is useful to address farmer preference varieties to increase the adoption of improved varieties thereby increase productivity. At Lalibela site variety Melkam ranked first, followed by Dekeba and Geremew whereas, at Aybra site the highest rank value was recorded for variety Meko followed by Melkam and Dekeba. The reasons of the preference for these varieties were related to earliness, head length and seed color. Similar to farmers, researchers may use sorghum head-related traits to predict the yield potential of a specific type of sorghum variety (Bezabih et al., Citation2017; Blum et al., Citation1989; Haussmann et al., Citation1999; Subba Reddy & Rao, Citation1971). Several authors reported the importance of farmers involvement (PVS) in variety selection in order to use their indigenous knowledge for variety use related traits and share their traits preference (Gyawali et al., Citation2010 in rice; Abakemal et al., Citation2013, in maize; Nkongolo et al., Citation2008, in sorghum; Mancini et al., Citation2017 in durum wheat). Joshi et al. (Citation1995) reported that in addition to grain yield, farmers also consider other parameters like growing period, plant height, thresh ability, milling recovery, taste and other characters of rice.
3.3. Genotype and genotype by environment interactions biplot analysis for grain yield
GGE biplot based on PC1 and PC2 is indicated (Figure ). Genotypes located at the vertices of the polygon performed either the best or the poorest in one or more locations since they had the longest distance from the origin of biplot (Yan & Kang, Citation2003). Accordingly, the vertex genotypes in this study were V1, V6, V4, and V3 which were the best or the poorest varieties in some or all of the environments because they were farthest from the origin of the biplot.
Polygon view of a biplot is most relevant to the investigation of the mega-environments and visualization of the which-won-where pattern of multi-environment trial data (Yan, Citation2001) and it is important for studying the possible existence of different mega-environments in a region (Gauch & Zobel, Citation1997). V1 was high yielding variety at the first mega environment which contains the test environments; EV1, EV2 and EV3; the second mega environment contains Ev3 with V6 as the best yielder. The vertex variety V3 and V4 were not the top yielding genotypes in any environment. They were the poorly performing varieties with average grain yield below the grand mean.
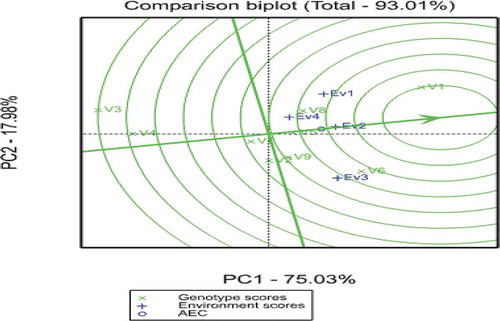
Genotype that fall in the central (concentric) circle is considered a stable genotype (Yan, Citation2002). Genotype-focused comparison of genotypes revealed that genotype V1 fell in the central circle, was the ideal genotype in terms of higher-yielding potential and stability, compared to the rest of genotypes evaluated in this study (Figure .). The GGE biplot analysis depicted V1 as a stable variety.
Figure 5. Polygon view of the GGE biplot show the “which-won-where” for 9 sorghum varieties over 4 test environments. Ev1 = Aybra 2008/2009; Ev2 = Aybra 2009/2010; Ev3 = Lalibela 2008/2009; Ev4 = Lalibela 2009/2010; V1 = Melkam; V2 = Dekeba; V3 = Dagim; V4 = Geremew; V5 = Chare; V6 = Mesay; V7 = Gambella; V8 = Meko; V9 = Local.
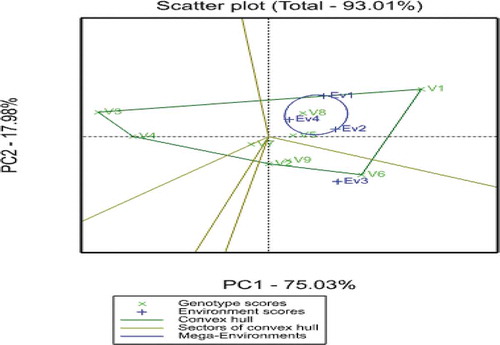
Figure 6. GGE-biplot based on genotype-focused scaling for comparison the genotypes with the ideal genotype. Ev1 = Aybra 2008/2009; Ev2 = Aybra 2009/2010; Ev3 = Lalibela 2008/2009; Ev4 = Lalibela 2009/2010; V1 = Melkam; V2 = Dekeba; V3 = Dagim; V4 = Geremew; V5 = Chare; V6 = Mesay; V7 = Gambella; V8 = Meko; V9 = Local.
4. Conclusions and recommendations
Sorghum is one of the most dominant cereal crops both socially and agriculturally especially in the dry lowlands areas of Wag-Himra and Lasta. Based on the GGE biplot analysis, high yielding variety Melkam (2800 kg ha−1) showed better performance on yield and stability across the test environments. Moreover, the results of participatory variety selection (PVS) revealed the afformentioned variety ranked first and second preferred sorghum variety in Lasta and Waghimira testing sites, respectively. For this reason, Melkam is recommended for production in the study areas and similar agro-ecologies of the country, for its yield, stability and seed color. This variety will play a role in enhancing farmers’ income through improved grain yield, especially in the dry lowlands areas of Wag-himra and Lasta.
Conflict of interest
The authors declare that there is no conflict of interest regarding the publication of this paper.
Acknowledgements
We acknowledge the Amhara Agricultural Research Institute (ARARI) for financial support to conduct this study.
Additional information
Funding
Notes on contributors
Abebe Assefa
Abebe Assefa is a full time Researcher in Sekota dry land agricultural Research Center. sekota wollo,Ethiopia at Amhara Agricultural Research Institute Bhair dar, Ethiopia. He has been conducted many Research Activity related to plant breeding in cereal case team. His key Research interest is in plant breeding and genetic division on Sorghum, Pear millet and high land crops like that of Wheat(Bread and Durum), Teff and food barely.
Aemiro Bezhabih was work at sekota dry land Research center as Research center directorate and as plant breeder. New currently he is a candidate for PhD in Italy.
References
- Abakemal, D., Hussein, S., Derera, J., & Laing, M. (2013). Farmers’ perceptions of maize production systems and breeding priorities, and their implications for the adoption of new varieties in selected areas of the highland agro-ecology of Ethiopia. Journal of Agricultural Science, 511.
- Adugan, A. (2008). Assessment of yield stability in sorghum using univariate and multivariate statistical approaches. Hereditas, 145(1), 28–12. https://doi.org/10.1111/j.0018-0661.2008.2023.x
- Adugna, A. (2007). Assessment of yield stability in sorghum. Ethiopia. African Crop Science Journal, 15(2), 83–92.
- Bezabih, A., Mekbib, F., Gebeyhu, S., & Kassa, M. T. (2017). Character association in sorghum stay-green QTL introgression lines to post flowering drought resistance in North East Ethiopia. In A. Assefa, B. Berihun, & E. Abate (Eds.), Proceeding of the 8th annual regional conference on completed crop research activities,13– 20 February 2014. Amhara Regional Agricultural Research Institute.
- Bibi, A., Sadaqat, H. A., Akram, H. M., & Mohammed, M. I. (2010). Physiological markers for screening sorghum (Sorghum bicolor) germplasm under stress condition. International Journal of Agriculture and Biological Sciences, 12(3), 451–455.
- Blum, A., Mayer, J., & Golan, G. (1989). Agronomic and physiological assessments of genotypic variation for drought resistance in sorghum. Aust. J. Agric. Res, 40(1), 49–61. https://doi.org/10.1071/AR9890049
- Central Statistical Agency, CSA. (2017). Report on area and production of crops (Statistical Bulletin 584, Volume I). Addis Abeba, Ethiopia.
- Doggett, H. (1988). Sorghum. John Wiley.
- Falconer, D. S. (1989). Introduction to quantitative genetics. Longman Scientific and Technical.
- FAO. (2010). FAOSTAT. Retrieved December 23, 2012, from http://www.faostat.fao.org
- Gauch, H. G., & Zobel, R. W. (1997). Identifying mega-environments and targeting genotypes. Crop Science, 37(2), 311–326. https://doi.org/10.2135/cropsci1997.0011183X003700020002x
- Gomez, A. K., & Gomez, A. A. (1984). Statistical procedures for agricultural research (2nd ed.). John Wiley and Sons.
- Gyawali, S., Sthapit, B. R., Bhandari, B., Bajaracharya, J., Shrestha, P. K., Upadhyay, M. P., & Jarvis, D. I. (2010). Participatory crop improvement and formal release of Jethobudho rice landrace in Nepal. Euphytica, 24(1), 30–32.
- Haussmann, B. I. G., Obilana, A. B., Blum, A., Ayiecho, P. O., Schipprack, W., & Geiger, H. H. (1999). Quantitative genetic parameters of sorghum (Sorghum bicolor (L.) Moench) grown in semi-arid areas of Kenya. Euphytica, 105(2), 109–118. https://doi.org/10.1023/A:1003469528461
- IBPGR and ICRISAT. (1993). Descriptors for sorghum [Sorghum bicolor (L.)Moench]. International board plant genetic resources, Rome, Italy. ICRISAT.
- Joshi, K. D., Rana, R. B., Subedi, M., Kadayat, K. B., & Sthapit, B. R. (1995). Effectiveness of participatory testing and dissemination programme: A case study of Chaite Rice in the western hills of Nepal (LARC working paper No. 95/49). Lumble Agricultural Research Centre.
- Kadam, G. N., Gadakh, S. R., & Awari, V. R. (2002). Physiological analysis of rabi sorghum genotypes for shallow soil. Journal of Maharashtra Agricultural Universities, 27(3), 274–276.
- Kebede, Y. (1991). The role of Ethiopian sorghum germplasm resources in the national breeding programme. In J. M. Engels, J. G. Hawkes, & M. Worede (Eds.), Plant genetic resources of Ethiopia (pp. 315–322). Cambridge University Press.
- Khizzah, B. W., & Miller, F. R. (1992). Correlations between sorghum components of drought resistance and various agronomic characters at four locations. Sorghum Newsletter, 33, 54.
- Kumar, A. A., Reddy, B. V. S., Sharma, H. C., Hash, C. T., Rao, P. S., Ramaia, B., & Reddy, P. S. (2011). Recent advances in sorghum genetic enhancement research at ICRISAT. American Journal of Plant Sciences, 2(4), 589–600. https://doi.org/10.4236/ajps.2011.24070
- Mancini, C., Kidane, Y., Mengistu, D., Pè, M. E., Fadda, C., & Dell’Acqua, M. (2017). Joining smallholder farmers’ traditional knowledge with metric traits to select better varieties of Ethiopian wheat, nature scientific reports.
- McGuire, S. (2005). Getting genes: Rethinking seed system analysis and reform for sorghum in Ethiopia [PhD Thesis]. Wageningen University.
- Mekbib, F. (2006). Farmer and formal breeding of sorghum (Sorghum bicolor (L.) Moench) and the implications for integrated plant breeding. Euphytica, 152(2), 163–176. https://doi.org/10.1007/s10681-006-9191-7
- Mutegi, E., Signard, F., Semagn, K., Deu, M., Muraya, M., Kanyenji, B., De Villiers, S., Kiambi, D., Herselman, L., & Labuschagne, M. (2011). Genetic structure and relationship within and between cultivated and wild sorghum (Sorghum bicolor (L.) Moench) in Kenya as revealed by microsatellite markers. Theoretical and Applied Genetics, 122(5), 989–1004. https://doi.org/10.1007/s00122-010-1504-5
- Nkongolo, K. K., Chinthu, K. K. L., Malusi, M., & Vokhiwa, Z. (2008). Participatory variety selection and characterization of Sorghum (Sorghum bicolor (L.) Moench) elite accessions from Malawian gene pool using farmer and breeder knowledge. African Journal of Agricultural Research, 3(4), 273–283.
- Ozturk, A. F., & Aydin, L. (2004). Effect of water stress at various growth stages on some quality characteristics of winter wheat. Journal of Agronomy and Crop Science, 190(2), 93–99. https://doi.org/10.1046/j.1439-037X.2003.00080.x
- Subba Reddy, B. V., & Rao, N. G. P. (1971). Genetic analysis of some exotic Indian cross in sorghum varieties character association and response to selection in advance generation progenies. Indian Genetics, 31, 510–520.
- Yadav, S. K., Jyothilakshmi, N., Maheshwari, M., Vanja, M., & Venkateshwarlu, B. (2003, January 8–12). Influence of water deficit at anthesis and grain filling stages on water relation, osmotic adjustment and grain yield in sorghum. International congress of plant physiology (pp. 222).
- Yan, W. (2001). GGE biplot a windows application for graphical analysis of multi-environment trial data and other types of two-way data. Agronomy Journal, 93(5), 1111–1118. https://doi.org/10.2134/agronj2001.9351111x
- Yan, W. (2002). Singular value partitioning in biplot analysis of multienvironment trial data. Agronomy Journal, 94(5), 990–996. https://doi.org/10.2134/agronj2002.0990
- Yan, W., & Kang, M. S. (2003). GGE biplot analysis: A graphical tool for breeders, geneticists and agronomists (1st ed.). CRC Press LLC.