
Abstract
Low crop yields are observed in the soils of South Kivu and lead to food insecurity and malnutrition. An experiment was conducted on a ferralsol to determine the optimal dose in both local and improved common bean cultivars (M’Sole and HM-21) and subsequently that which will allow store nutrients not only in the leaves but also in the seeds, the two parts of the plant commonly consumed and sold in the region. Experiments were conducted in a split-plot design with three replications in 2017 and 2018. Observations were focused on growth and yield parameters. N, P, and Fe levels were determined in leaves, roots and seeds. Results showed that common bean yield and its related parameters were influenced by the fertilizer doses and varieties. The biofortified variety (HM-21) presented higher yield than the local (M’Sole). The allocation of N, P and Fe varied from one variety to another; the best concentration was obtained with 51 kg ha−1 of N, P and K which corresponded to 300 kg ha−1 of NPK composite fertiliser. High nutrient concentrations were observed in young (0.23 g kg−1 of N and 51 ppm of Fe), actively growing leaves (0.19 g kg−1 of N and 50 ppm of Fe) and at the end of the growth cycle (0.19 g kg−1 of N and 48 ppm Fe). Thus, grains and leaves of biofortified beans can reduce anemia problems in eastern of DR Congo by increasing yield and nutrient concentrations in grains and leaves by using 300 kg ha−1 on degraded ferralsols of South-Kivu, eastern of DR Congo.
PUBLIC INTEREST STATEMENT
Tropical soils are known to have very low levels of nutrients that reduce the yields of most crops and specifically legumines such as common beans. One of these soils is the ferralsol that predominates in the eastern of the DR Congo. The aim of this manuscript was to evaluate the effect of different NPK fertilizer doses on the growth, development and yield of different bean varieties. Experimental plots were installed in Kabare territory by testing five doses of NPK on two varieties: M’Sole and HM-21. The application of 51 kg ha−1 of N, P and K (from 300 kg ha−1 of NPK composite fertilizer) was the optimal dose. The concentration of micronutrients (Zn and Fe) was high in both local and biofortified varieties. In areas where micronutrient deficiency problems such as iron deficiency are observed (causing anaemia), both leaves and seeds can be consumed to reduce this health problem.
1. Introduction
Common bean (Phaseolus vulgaris L.) is an annual legume crop commonly grown for its high protein content; its grains contain as much as three times more protein than cereals. In the eastern Democratic Republic of Congo (DRC), beans are grown for both leaves and grains and is by far the most widely consumed legume crop in the region (Casinga et al., Citation2015; Ntamwira et al., Citation2017). Mainly consumed in the eastern provinces of DRC, 300 g per capita per day was estimated. In south-Kivu, common bean is a staple food mainly for rural populations. Its seeds and leaves are important sources of protein for the whole population especially in rural area to the point that it is called “poor man’s meat”. Its sale also contributes to the improvement of the producer household’s income and thus improves the food security of the population. In terms of volume of production, beans are the main legume cultivated. In 2013, production was estimated at 241445 tons but decreased to 89048 tons in 2018, which corresponds to a decrease of almost −59% compared, respectively to the average of the last 3 years. The main bean production areas in DRC are North-Kivu, South-Kivu and Tanganyika provinces. These three provinces account for 28% of national bean production (SNSA, Citation2015).
However, despite the importance of the common bean in the eastern DRC, mainly in the South-Kivu province, its mean yield is far below the potential of the crop in the region and research centers. These low yields are mainly due to losses associated with diseases and pests, demographic pressure, inadequate farming practices, low soil fertility, use of low yielding and susceptible varieties, with poor adaptation to local soil and farming conditions (Lubobo et al., Citation2016; Lunze et al., Citation2012). Among those constraints, low soil fertility is the most important in South-Kivu where (Sanginga & Woomer, Citation2009) previously reported seasonal nitrogen losses of 40 kg ha−1. On one hand, this is due to continuous and overexploitation of soils without or with limited use of external inputs. On the other hand, this is associated with high soil erosion due to the exploitation of land with inadequate topographical conditions in the region. Several attempts have been initiated to increase soil productivity in the highlands of South-Kivu (Pypers et al., Citation2011) and achieved bean grain yields of 1940 kg ha−1 using 150 kg ha−1 of NPK 17–17-17. Ntamwira et al. (Citation2017) and Mukendi et al. (Citation2016) obtained the same yield with 200 kg ha−1 of the same type of fertilizer. On the other hand, closer yields were obtained on a ferralitic soil by applying of 100 kg ha−1 of DAP (Diammonium Phosphate) on local and improved varieties by Mushagalusa et al. (Citation2016) and Muke et al. (Citation2019). This shows that the optimal dose is not yet known in common bean in South-Kivu; the dose that will eventually promote a better allocation of nutrients both in the leaves and grains. The CIAT/HarvestPlus is disseminating biofortified bean varieties with high iron and zinc content to reduce the micronutrient deficiencies and anaemia in vulnerable groups such as breastfeeding women and young children in eastern DRC. The prevalence of anemia among preschool was estimated at 33% of which an half (50%) is due to Fe deficiency in the diet (HarvestPlus, Citation2010).
The use of improved varieties associated with good farming practices among which adequate soil fertilization is an effective mean for increasing crop yields (Mufind et al., Citation2017; Nyabyenda, Citation2009; Useni et al., Citation2014). The use of different types of organic matter combined with mineral fertilizers to the soil is one of the promising ways to increase agricultural production on ferrasols such as those in eastern DRC, and specifically in Kabare Territory in South-Kivu province. The tropical mountainous regions of Kivu, and Kabare specifically, have a prevalence of ferralsols which are characterized by a very low activity clay (the Kaolinite type), a low pH value explaining the stable microstructure (pseudo-sand) of yellowish colour (goethite) to reddish (hematite). On the other hand, they are generally deep, with good permeability and a stable structure that makes them less susceptible to erosion and easy to work with. They are well drained but sometimes dry due to low retention capacity (Cottenie, Citation1980; USDA, Citation2017; WRB, Citation2015). This study is evaluating five doses of the NPK fertiliser on the growth and productivity of two varieties on low fertile soil in the highlands of Kabare Territory, eastern DRC.
2. Materials and methods
2.1. Experimental site
The field experiment was conducted in Bugorhe in Kabare Territory (Figure ), eastern DRC. The area is made of mountains, hills and marshes. The field experiment was located at 2.446474°S for the latitude, 28.804628° E for the longitude and at an elevation of 1682 m above sea level. The previous crop on the same field was maize intercropped with beans. The field had an estimated slope of 12%. Soil and weather characteristics are presented in (Tables and ). The climate is wet tropical and Aw type according to Koppen–Geiger classification. The area experiences two seasons; the long rainy season, referred to as A extends from September to February, while the short rainy season B goes from mid-February to June. The mean annual rainfall was 1415 mm while the mean average temperature was 18.9°C (Figure ) during the study period. July (22 mm) is the least rainy month while the large quantities are recorded in April, November and December (with nearly 180 mm monthly).
Table 1. Soil characteristics of the experimental site in Kabare Territory, eastern DRC
Table 2. Description of varieties used in this study at Kabare, eastern DRC
Figure 1. Localisation of field trial in Kabare territory.
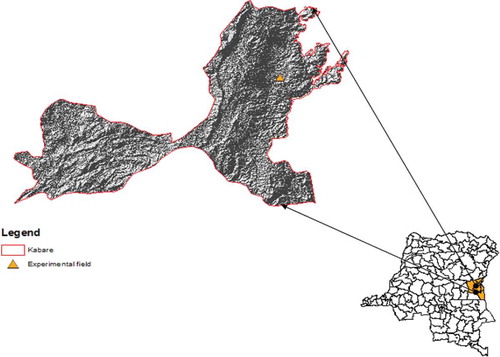
Figure 2. Weather data for the Kabare territory from 1960 to 2017 (a) and during the 2017–2018 experimental periods (b). Texture of the soil profile of the experimental field in Kabare, eastern DRC (c).
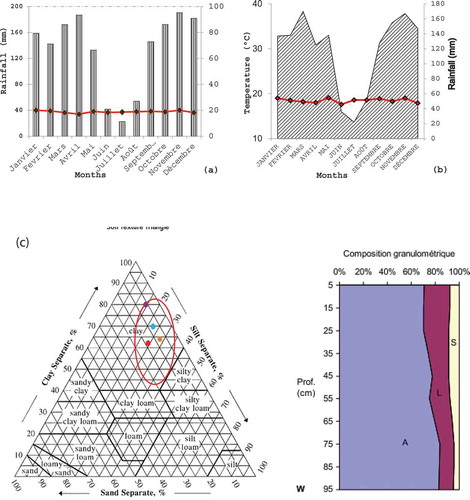
The soil is of the clay type, acidic and often poor in organic matter (Table ), for which an addition of organic and mineral substances (N, P, and K) is necessary. According to the classification of (WRB, Citation2015), these soils are humic ferralsols; classes of red or yellow soil with a high concentration of iron and aluminium sesquioxides. Found on old parental material, geomorphologically stable on the surface, they are developed on basic rocks only on siliceous materials of the Pleistocene. Ferralsols are soils with low activity clay (LAC). They are developed in the humid and subhumid tropics. They are mineral soils whose formation is conditioned by climate Low activity soils of Kaolinite-type clay, they have a low pH value explaining the stable microstructure said pseudo-sands of yellowish color (goethite) or red (hematite). Generally deep, with good permeability and a stable structure that makes them less susceptible to erosion and easy to work. They are well drained but sometimes dry because of the low water retention capacity. An application of manure, compost, mulching can improve these soils.
2.2. Plant materials
Biofortified bean variety (HM21-7) and a local landrace (M’Sole) were used as plant material in this study. These were from INERA/Mulungu for M’Sole and CIAT HarvestPlus for HM21-7. Agronomic and phenotypic characteristics of these plant materials are provided in Table . They were chosen for their high yield potential and their high level of appreciation by the farmers in the study area.
2.3. Methods
Field experiment was carried out based on a split-plot design. The fertiliser dose was the main factor while the variety was subordinate/secondary. Only limited fertilizers are available on the local market, in particular, NPK 17–17-17, Urea and KCl. Our choice has been focused on NPK composite fertilizer. Mineral fertilizer made of NPK 17–17-17 was applied at six different doses including 0, 17, 34, 51, 68 and 85 kg ha−1 of elements N, P and K on both varieties (HM21-7 and M’Sole). These doses corresponded to applications of 0, 100, 200, 300, 400 and 500 kg ha−1 of NPK composite fertilizer, respectively. Three replicates were set for each treatment. The treatment plot size was 9 m2, which resulted in a total size of 576 m2 (24 m long and 24 m wide) for the whole experiment. The experiment was conducted during the growing season B, from 12 March to 17 June 2017 and repeated in the same season in the following year 2018. Seeding rate was of 40 cm × 20 cm with two seeds per hole, making a density of 450,000 seeds ha−1. Before the NPK application, organic matter in the form of cow manure was applied at a rate of 5 t ha−1. The NPK fertilizer was then applied at doses of 0.9, 1.8, 2.7, 3.6 and 4.5 g per hole. The crop management practices consisted mainly of two weedings: the first 2 weeks after planting and the second before flowering, corresponding to approximately 35 days after planting.
3. Data collection
3.1. Growth parameters
The seedling emergence rate was recorded 12 days after planting; it corresponded to the ratio between the number of risen seedlings over the total number of seeds planted and expressed in percentage (Raveneau et al., Citation2014). This parameter was taken as a high dose of fertilizers can degrade seeds and thus impact seed germination. This was highlighted by Dialla et al. (2016) on maize. Plant height was measured from a random sample of six plants in each plot at 30, 60 and 90th days after sowing. The root length was also measured from six plants randomly uprooted per plot at 30, 60 and 90th days after planting.
4. Yield parameters
The yield parameters that were collected included the total biomass measured using a weighing balance, the count of number of pods per plant, the number of seeds per pod, and the weight of hundred seeds randomly sampled in each plot determined by a weighing balance. Biomass was taken as a yield because the aerial part is consumed in the region as vegetable. The yield (in kg ha−1) was obtained by weighing grains from each plot and extrapolating it to the hectare.
5. Evaluation of the nutrient allocation in the plant parts
To evaluate nutrient allocation, N, P and Fe were measured in the seeds, leaves and roots of plants. Six plants were randomly selected for this purpose. These analyses were performed on the plant samples each day. Analyses protocols for these elements were followed as modified by Brigide et al. (Citation2014) and Mario et al. (Citation2009). In fact, fully triturated samples of leaf, grains and roots were used for determination of N, P, and K content. For each analysis, 200 g of sample was used in this study to determine the total N, and total P using ash method (HNO3-HClO4-H2SO4) (Liu et al., 2018; Wan et al., 2020) while Zn and Fe were analysed using X-ray Fluorescence (XRF). These dynamic changes of nutrients were directly reflecting the abundance of plant varieties and soil nutrients.
5.1. Data analysis
Statistix 8.0 (Statistix, Citation2003) and R consol 2.3.2 software (Mario et al., Citation2009) were used for data analysis. It consisted of the analysis of the variance to appreciate the effects of treatments on different growth and yield parameters. The Tukey HSD test was used to separate the computed means at 5% probability thresholds. The optimal dose of NPK fertilizer for the two bean varieties was determined by a quadratic (second-order) relationship correlation between the amount of NPK applied and the yield obtained. The function was f(x) = c + bx + ax2, with f(x) the yield obtained by applying x quantity of NPK. The maximum of the curve corresponds to the optimal dose which is required to obtain the maximum yield.
6. Results
6.1. Effect of NPK doses on emergence rate and height of the two bean varieties
The applied doses of NPK had no significant effect on emergence rate. However, there were significant differences on emergence rate due to varieties (p = 0.042) and the interaction between doses-varieties (p = 0.034) (Figure ). Mean emergence rates of 93% and 97% were recorded on M’Sole and HM-21 varieties, respectively.
Figure 3. Effect of fertiliser doses and grown varieties on emergence rate (a) and bean plant height (b) at Kabare, eastern DRC (the values of each column with different letters are statistically different at the 5% probability threshold according to the Tukey HSD test, The bars above each column are standard errors).
The plant height at physiological maturity varied significantly with fertiliser doses. The plant height at 1 month after planting varied significantly with varieties (p = 0.0280), doses (p = 0.0172) and their interactions (p = 0.026). In the second month, there were significant differences (p = 0.0142) in plant height due to varieties and the interaction between variety and doses only. In the third month, the same trend was observed. For the first month, the highest plant height was observed on HM21-7 variety at the NPK application rate of 200 kg ha−1 (37.8 cm) while the lowest was on the local variety without fertilizer application (27.4 cm). In the second and third months, the same trend was observed (Table ).
The applied fertilizer doses did not influence significantly the mean root length of the bean plants in the first month. However, significant differences were observed for the varieties (p = 0.0315). The NPK application at a rate of 100 kg ha−1 allowed a good root development (35,7 cm) in the local variety, whereas, in the biofortified variety, it is the application rate of 400 kg ha−1 which favoured root development (46.5 cm). Exceeding this dose, a significant decrease in root length was observed.
Consumed in the region as vegetable, the bean leaves production was significantly higher for the local variety (126.8 g per plant) than the biofortified counterpart (94.81 g). When applying 500 kg ha−1 of NPK to this biofortified variety, we observed a significant increase in leaf production (150, 5 g), while 400 kg ha−1 was the one allowing the highest leaf biomass for the local variety (172.3 g).
7. Effects of NPK doses on yield parameters of the two bean varieties
All the yield parameters were very significantly influenced by the fertilizer doses (p˂0.05), except the weight of hundred seeds (Table ). However, there were highly significant differences (p < 0.001) due to varieties for the number of seeds per pod, the number of pods per plant and the weight of hundred seeds. The local variety M’Sole had more pods per plant and these increased from 5.2 (without fertilizer) up to 13.9 at the NPK dose of 400 kg ha−1, before decreasing to 12.1 when the NPK application reached a dose of 500 kg ha−1. The biofortified variety had only 3.1 pods without NPK application; it increased to 6.3 pods at the NPK application rate of 400 kg ha−1. The same dose had an average of 3.6 seeds per pod for the variety HM-21 and 5.3 for landrace M’Sole. Weight of hundred seeds was higher for the biofortified bean variety HM-21 (42.3 g) than it was for the local variety M’Sole (22 g) at 400 kg ha−1 NPK dose.
The grain yield of the two bean varieties (Figure ) was very significantly influenced by varieties grown (p = 0.001), the applied fertilizer doses (p = 0.003) and by the interaction between doses and varieties (p = 0.041). The application of 100 kg ha−1 recorded a grain yield of 917 kg ha−1 compared to the control without fertilizer (768 kg ha−1). The highest grain yield was obtained at the NPK dose of 300 kg ha−1 (1680 kg ha−1). It has then proportionally decreased up to 1127 kg ha−1 at 500 kg ha−1 of NPK application rate. The best yield was observed on the local variety (1.68 t ha−1) when applying the dose of 400 kg ha−1 while the lowest yield was on the variety HM21-7 (0.41 t ha−1) without NPK application. The yield increased significantly up to 400 kg ha−1, after which the yield started decreasing (Figure ). The regression analysis between the dose of NPK applied and the grain yield obtained is presented in Table . It shows that the regression varies from one variety to another. It is represented by a quadratic equation noted as y = 266.36 + 287.47x −0.647x2 (R2 = 78.1) for the variety HM21-7 and y = 653.58 + 355.15x—0.613 × 2 (R2 = 86.4) for the local variety M’Sole.
Table 3. Effects of varieties and fertiliser doses on plant growth parameters in Kabare, eastern DRC
Table 4. Effects of mineral fertilizer doses and grown bean varieties on the yield parameters at Kabare, eastern DRC
Table 5. Estimation of the optimal dose of NPK to be applied for the two varieties when grown at Kabare, eastern DRC
Figure 4. Effect of doses (a) and varieties (b) on bean yield in Kabare, eastern DRC (The values of each column with different letters are statistically different at the 5% probability threshold according to the Tukey HSD test, the bars above each column are standard errors).
Figure 5. Grain yield of the two grown varieties (HM21-7 and M’Sole) obtained for different NPK doses at Kabare, eastern DRC.
From these analyses, it appears that the optimum NPK dose to be applied should vary from one variety to another. The estimation of the optimal dose of NPK to be applied suggested 340.2 kg ha−1 for HM21-7 and 289.68 kg ha−1 for M’Sole, respectively (Table ). Thus, from the six doses used in this study, 300 kg ha−1 was closer to the estimated optimal NPK dose.
8. Nutrients allocation in the bean plant parts for the different fertiliser doses and varieties
The allocation of nitrogen, phosphorus and iron in the different parts of the bean plant (roots, leaves and seeds) regarding the different doses of NPK applied on the two bean varieties is presented in Figure . It shows that the concentration of N, P and Fe in the different bean plant parts varied significantly with growth stages (p = 0.035), the plant organs (p = 0.012) and the grown variety.
Figure 6. Nitrogen, phosphorus and iron allocations in bean plant parts based on fertilizer doses and grown varieties at Kabare, eastern DRC (The bars above each column are standard errors).
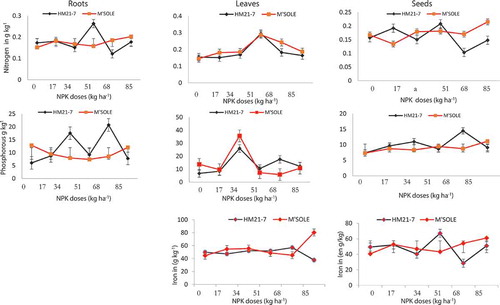
Regardless of the assessed nutrient and the grown variety, the biofortified variety HM21-7 presented high values compared to its local variety (M’sole) counterpart. Very significant differences were observed between concentrations of N and P for the grown varieties and the NPK doses. In general, the NPK dose of 300 kg ha−1 recorded the highest values of accumulation in roots for N and P on the variety HM21-7. However, in leaves, it was the local variety M’Sole which accumulated the highest concentrations of both nutrients. In seeds, the highest concentration of N was observed in the local variety at fertiliser doses of 400 and 500 kg ha−1. Surprisingly, at the fertiliser dose of 300 kg ha−1, there was no significant difference between the two varieties. For the phosphorus, the highest concentration in seeds was observed when the fertiliser dose of 400 kg ha−1 was applied. Exceeding this dose, the P concentration in seeds started decreasing proportionally. In both cases, highest P and N concentrations were recorded in leaves than in seeds. The concentration of iron in leaves ranged from 42 to 58 ppm. When exceeding the fertiliser dose of 400 kg ha−1, the local variety M’Sole reached very high Fe concentrations of 80 ppm, while a significant concentration decrease was observed on HM21-7 (38 ppm). In the seeds, the fertiliser dose of 300 kg ha−1 showed a concentration of 72 ppm for HM21-7 and only 47 ppm for M’Sole. Exceeding this dose, the trend reversed in favour of the local landrace M’Sole.
8.1. Discussion
9. NPK fertilizer doses improve growth and yield of beans grown on ferralsols in South Kivu
The different doses of NPK influenced differently the parameters observed throughout the growing cycle of the bean crop and that for the two varieties. The number of pods per plant, the number of seeds per pod, the weight of hundred seeds and the grain yield (p < 0.001) were influenced by the fertilizer doses. In general, the fertiliser dose of 300 kg ha−1 had the best results. (Ngongo et al., Citation2014) previously showed that applying NPK fertilizer to different bean varieties could allow doubling grain yields. In their study, yields of 1.3 t ha−1 were obtained with NPK fertiliser while it was only 0.7t ha−1 without fertilizer. Mean root length, dry weight of bean leaves, and fresh leaf weight were significantly influenced by the fertilizer dose. These results support those previously found by (Casinga et al., Citation2015; Mushagalusa et al., Citation2016) in field experiments conducted in weather conditions similar to those of the present study. In Casinga et al. (Citation2017) for example, while testing five doses of NPK, they found significant influences of doses on growth and yield of two grown biofortified varieties. They also observed that the variety HM21-7 was the most productive while fertiliser dose of 150 kg ha−1 was the optimal fertiliser dose for beans, with a grain yield of 1250 kg ha−1. However, increasing the fertiliser dose to 200 kg ha−1 was still resulting in yield increase; which underlies that the optimal threshold of the dose was not reached yet. Mushagalusa et al. (Citation2016) recorded yields of 1395 to 1352 kg ha−1 by applying 100 kg ha−1 of DAP on two biofortified varieties HM21-7 and RWR2245 in Kashusha, which the neighbouring area to where this study was conducted. However, this dose showed a low harvest index of 57% to 59%. Increasing the fertiliser dose to 51 kg ha−1 of N, P and K from 300 kg ha−1 of composite NPK fertiliser, we obtained 1680 kg ha−1. This difference would be, not only due to the difference between the doses but also the types of soil. Indeed, the dominant soils in Kashusha are Nitisols with a high concentration of organic matter. This dose also has agronomic efficiency according to the same result. This variation in yield between common bean varieties can be explained by their genetic backgrounds. This same trend was also noted by (Lubobo et al., Citation2016; Mirindi et al., Citation2018). The difference in genotype not only influences growth but also yield and nutrient concentration. It will, therefore, require a critical selection of cultivars for different regions to allow plants expressing their full potential. (Lubobo et al., Citation2016; Kasongo et al., 2016) found the increase of the agronomic efficiency up to 66% with the application of NPK and urea fertilisers. The low seed yields of HM21-7 can be explained mainly by dry spells and erratic rainfall observed during the experiment period as the HM21-7 variety has a low capacity to adapt to adverse climatic conditions (Ntamwira et al., Citation2017). Legume production in the tropics is also limited by low soil fertility. Indeed, given the toxicity of Al and Fe, and the very acidic pH level (˂5.5) of soils, the effectiveness of fixation remains limited, poor biomass and seed productions, and consequently, a significant demand for fertilizer. (Kone et al., Citation2009) showed that the fertility of ferralsols can be appreciated by their colour.
The experiment site soils are red and rich in oxides and hydroxides of iron and aluminium which binds phosphorus as demonstrated by (Abekoe & Sahrawat, Citation2001, Citation2003). Under conditions of high acidity, the application of organic matter, lime or phosphate rock can improve crops’ performance (Raharinosy, Citation1983). Also, high doses of fertilizer would also be needed for these soils. In addition, Steiner (Citation1996) reported nutrient (especially N and P) losses of 22, 2.5 and 15 kg ha−1 on ferralsols in the region. Thus, the contribution of chemical fertilizers is a key factor in the intensification of agriculture in developing countries and, in the Kivu region in particular. Hence, the positive correlations recorded between the yield and the quantity of chemical fertilizers used (Casinga et al., Citation2017; Useni et al., Citation2014). In south-Kivu, the national statistics (SNSA, Citation2015) show the yield of the bean around 500 kg ha−1 in the farmer field without fertilizer. In any case, fertilizers are known to be an integral part of current crop production as they provide essential mineral elements (especially macronutrients) for positive crop growth and blossoming harvests. Even high yielding varieties of crop plants possibly do not reach to their full potential without getting a balanced dose of fertilizers which seems very obvious especially for degraded tropical soils such as the over-exploited ferralsols of Kabare, eastern DR Congo.
However, many evidences indicating that intensive use of synthetic fertilizer is one of the main factors polluting air, soil and water. In fact, its production generates different green-house gases which concentrate (Vatonii et al., 2008; Ward et al., Citation2018). These authors showed that Greenhouse gas emission reduced and degraded environmental quality; they also showed that Water Nitrate and Human Health are affected by applying fertilizers on farms. Problems such as eutrophication and groundwater degradation were also noted in many reports. Long-term use of fertilizers becomes a significant source of soil and water pollution which may put terrestrial and aquatic ecosystems downstream and human health at risk. On the other hand, N is converted to ammonia which is converted to nitrite and nitrate that is highly soluble and mobile and is loosely bound to soil particles. The nitrates are easily washed into surface water bodies by rain or leached into groundwater via soil and infiltrating water. Also, the oxidation of nitrite to nitrate by dissolved oxygen in water leads to depletion of oxygen levels in water. Huang and Jin (Citation2008) confirmed that their excess application may add more heavy metals to the soils. In that case, we suggest to combine the two types of fertilisers (mineral and organic) especially as these soils are very poor in organic matter and have a low nutrient retention capacity.
10. Nutrient allocation in plant parts of the two bean varieties
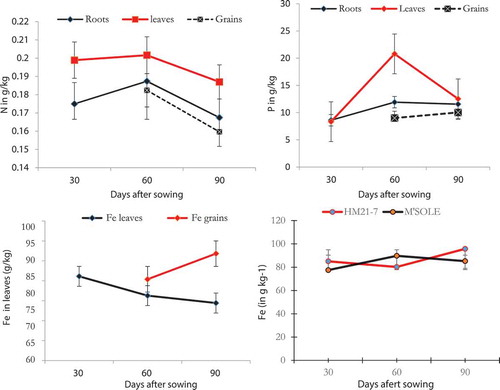
The results obtained showed that the concentration of N, P and Fe varied from with varieties, fertiliser doses and plant organs along with the growth stages (Figure ). Indeed, the three elements were more concentrated in leaves and seeds than in the roots. The local variety M’Sole had the highest accumulation rates for these nutrients with high concentrations in the leaves than in the roots and seeds, except for the N. Results showed also that when the fertiliser dose of 51 kg ha−1 which corresponds to 300 kg ha−1 (of NPK fertilizer) was exceeded, the concentration in seeds decreases significantly in the biofortified variety. Among the six varieties they evaluated, HM21-7 had a high concentration of Fe and Zn compared to the five others mainly RWK10, RWR2245 and CODMLB001 with values ranging from 42 to 76 ppm for Fe and 15 to 34 ppm for Zn in the biomass and 24 to 49 ppm Fe for seeds. Much earlier, Pfeiffer (Citation2007); Wolfgang (Citation2010); Silva et al. (2012) showed that the concentration of Fe and Zn in biofortified varieties is a function of genotype, quantitative traits and environmental factors such as water, nutrient status, and agronomic practices. In Kenya and Tanzania, Mamiro et al. (Citation2011) found Fe concentration values ranging from 113.3 to 466.9 mg 100 g−1 of dry matter for the biofortified varieties grown in the region, while for Zn values ranged from 6.4 to 50.1 mg 100 g−1 of dry matter. Concentrations were varying with varieties, depending on whether it was local landrace or improved biofortified cultivars. Concentrations also varied with the plant parts and growing stages; the young leaves were more concentrated in Fe and Zn than young seeds. Once old, the trend for the Fe remained the same while that of Zinc was static for both leaves and seeds. Celmeli et al. (Citation2018); Lucia, Carvalho et al. (Citation2012); Yeken and Akpolat (Citation2018) and Paredes et al. (Citation2009) found Fe, Zn and protein concentrations close to these results. (Sandberg, Citation2002) and Hikosaka et al. (2005) reported that the concentration of nutrients such as Fe and Zn is high in common bean varieties. However, their bioavailability is sometimes low because of the presence of phytates which inhibits their absorption. (Bressers, Citation2014; Langwerden, Citation2014; Macharia et al., Citation2012) showed that young leaves have high concentrations in nitrogen and phosphorus and that the addition of phosphate and potassium fertilizers significantly increases the leaf concentration in nitrogen and phosphorus. They also found that nitrogen concentration in leaf increases with bean grain yield, such that it is low when seed yield is low. The relationship between phosphorus concentration in leaves and grain yield has a similar trend (Bressers, Citation2014).
Figure 7. Evolution of nutrients concentration in plant parts by growth stage for bean crop grown at Kabare, eastern DRC (The bars above each column are standard errors).
11. Conclusion
From our results, the growth and yield of beans vary with the fertiliser doses and grown varieties. On ferralsols, predominant in Kabare and Walungu territories in eastern DR Congo, the use of NPK fertilizer dose should depend on the grown variety. Biofortified varieties would require more nutrients supply than local varieties in the region. The estimated optimum fertiliser dose for NPK varies according to the varieties cultivated; however, it varied from 289 to 340 kg ha−1. Exceeding this quantity, not only the yield will be affected but also the allocation of nutrients including N, P and Fe. The young leaves had high concentrations in nutrients (N and P) as well as in Fe with the same threshold as the seeds. Micronutrient concentrations (Fe and Zn) remain very slightly different between the two types of varieties under study. In areas where deficiencies in proteins and micronutrients such as Fe and Zn are still causing serious health problems and anaemia, consumption of young leaves and seeds can help alleviating this problem.
Cover image
Source: Author.
Additional information
Notes on contributors
Chuma Basimine Géant
Chuma Basimine Géant is an assistant lecturer at the Faculty of Agriculture and Environmental Sciences, Université Evangélique en Afrique (UEA) in Bukavu City, eastern of DR Congo. He has an engineering degree in crop production (since 2015) and a Master of specialization in Sciences and Environment Management in Developing countries from the University of Liege and Catholic University of Louvain, Belgium (2019). Now, he is undertaking doctoral research on mapping, characterization and monitoring South-Kivu wetlands for their sustainable use.
References
- Abekoe, M., & Sahrawat, K. L. (2003). Long-term cropping effect on phosphorus fractions in an Ultisol of the humid forest zone in West Africa Long-Term cropping effect on phosphorus fractions in an Ultisol of the humid forest zone in West Africa. Communications in Soil Science and Plant Analysis, 34(3 & 4), 427–19. https://doi.org/10.1081/CSS-120017830
- Abekoe, M. K., & Sahrawat, K. L. (2001). Phosphate retention and extractability in soils of the humid zone in West Africa. Geoderma, 102(2001), 175–187. https://doi.org/10.1016/S0016-7061(00)00110-5
- Bressers, E. (2014). Nutrient deficiencies and soil fertility constraints for common bean (Phaseolus vulgaris L .) production in the Usambara Mountains, northern Tanzania Nutrient deficiencies and soil fertility constraints for common bean (Phaseolus vulgaris L .) producti. Wageningen University.
- Brigide, P., Canniatti, G. S., & Silva, B. O. (2014). Nutritional characteristics of biofortified common beans. Food Science and Technology, Campinas, 34(3), 493–500. https://doi.org/10.1590/1678-457X.6245
- Casinga, C., Haminosi, G., & Cirimwami, L. (2017). Determining optimal dose of chemical fertilizer on biofortified bean in sud- determining optimal dose of chemical fertilizer on biofortified bean in Sud-Kivu Highlands. Journal of Agricultural Science; Canadian Center of Science and Education, 9(N°1). https://doi.org/10.5539/jas.v9n1p128
- Casinga, C. M., Cirimwami, L. T., Amzati, G. S., Katembera, J. I., Lubobo, A. K., & Mushagalusa, G. N. (2015). Effect of the environment on the adaptability of biofortified bean genotypes in the Eastern Democratic Republic of Congo. European Journal of Agriculture and Forestry Research, 3(October), 38–47. www.eajournals.org
- Casinga, C. M., Cirimwami, L. T., Bisimwa, E. B., & Mushagalusa, G. N. (2015). The impact of leguminous culture system and sowing dates on the cereal yield in mountainous South-Kivu: Case of Burhale The impact of leguminous culture system and sowing dates on the cereal yield in mountainous South-Kivu: Case of Burhale. International Journal of Innovation and Scientific Research, 18(2), 297–303. http://www.ijisr.issr-journals.org/
- Celmeli, T., Sari, H., Canci, H., Sari, D., Adak, A., & Eker, T. (2018). The nutritional content of common bean (Phaseolus vulgaris L .) Landraces in comparison to modern varieties. Agronomy Project, 8(166). https://doi.org/10.3390/agronomy8090166
- Cottenie, A. (1980). Ar117E. FAO Soils Bulletin No., 38(1), 250.
- HarvestPlus. (2010). Iron bean. www.HarvestPlus.org
- Huang, S. H., & Jin, J. (2008). Status of heavy metals in agricultural soils as affected by different patterns of land use. Environmental Monitoring and Assessment, 139(1–3), 317–327. https://doi.org/10.1007/s10661-007-9838-4
- Kone, B., Diatta, S., Oikeh, S., Gbalou, Y., Camara, M., Djidji, D. D., & Ayemou, A. (2009). Potentielle des ferralsols estimation de la fertilite par la couleur. Canadian Journal of Soil Science, 89, 331–342. https://doi.org/10.4141/CJSS07119
- Langwerden, J. E. (2014). Soil fertility constraints for the production of common bean (Phaseolus vulgaris L .) in the Usambara Mountains of northern Tanzania. Wageningen UR.
- Lubobo, A., Kasongo, E., Kizungu, R., Nachigera, G., & Kalonji, A. (2016). Effect of climate change on common bean (Phaseolus vulgaris) crop production: Determination of the optimum planting period in midlands and highlands zones of the Democratic Republic of Congo. Global Journal of Agricultural Research and Reviews, 4(1), 390–399.
- Lucia, Carvalho, M., Mariana, J., Elenilda, C. M., Marıilia, P. J., Jose, R. N., Ediane, L. V. C., & Sidinéa, C. F. (2012). Iron and zinc retention in common beans cooking. Food & Nutrition Research, 56(15618), 1–6. https://doi.org/10.3402/fnr.v56i0.15618
- Lunze, L., Mathew, M. A., Buruchara, R., Michael, A. U., Nabahungu, N. L., Rachier, O. G., … Rao, I. (2012). Integrated soil fertility management in bean-based cropping systems of Eastern, Central and Southern Africa. Soil Fertility Improvement and Integrated Nutrient Management - A Global Perspective, (May 2014). https://doi.org/10.5772/29151
- Macharia, I., Garming, H., Ouma, E., Birachi, E., Ekesa, B., De, L. M., … Zawadi, S. (2012). Assessing the impact of CIALCA technologies on crop productivity and poverty in the great lakes region of Burundi, The Democratic Republic of Congo (DR Congo) and Rwanda. In IITA Kenyatta University, Nairobi, International, bioversity biology, tropical soil. Tropical Soil Biology and Fertility Institute of the International Centre for Tropical Agriculture (TSBF-CIAT).
- Mamiro, P. S., Mamiro, D., Mwanri, A., & Kinabo, J. (2011). Nutritional quality and utilization of local and improved cowpea varieties in some regions in Tanzania. African Journal of Food Agriculture Nutrition and Development, 11(n°1), 18. https://doi.org/10.4314/ajfand.v11i1.65876
- Mario, C. P., Viviana, C. B., & Juan, C. T. (2009). Inorganic nutritional composition of common bean (phaseolus vulgaris l .) genotypes race chile. Chilean Journal of Agricultural Research, 69(4), 486–495.
- Mirindi, C., Mbikayi, N., Kijana, R., Rudahaba, N., Civava, M., Lubobo, K., … Irenge, C. (2018). Evaluation agronomique des varietes biofortifiees du haricot commun (phaseolus vulgaris l .) En essais comparatifs d ’ adaptation : Cas des varietes grimpantes « nutritionally enhanced climbing beans (nuv) » [agronomic evaluation of common biofortifie]. International Journal of Innovation and Applied Studies, 25(1), 76–85.
- Mufind, K. M., Tshala, J. U., Alain, K. M., & Nyembo, L. K. (2017). Réponse de huit variétés de haricot commun (Phaseolus vulgaris L .) à la fertilisation minérale dans la région de Kolwezi, Lualaba (RD Congo). Journal of Applied Biosciences, 111(10894), 10894–10904. https://doi.org/104314/jab.v111i1.6
- Muke, A., Asanzi, M., & Christopher Kijana, R. (2019). Usage approprié des engrais dans la production du haricot commun (Phaseolus vulgaris) dans les régions tropicales humides de l’Est de la République Démocratique du Congo. Afrique SCIENCE, 15(3), 176–189.
- Mukendi, R., Kamukenji, A., Kaseba, S., Tshiamala, T., Mukenga, S., & Muyayabatu, G. (2016). Réponse de fertilisant organique liquide (D.I.GROW) et inorganique (N.P.K. 17-17-17) sur le Rendement graine de haricot –commun (Phaseolus vulgaris L.) À forte teneur en fer et zinc à Ngandajika R. Journal of Applied Biosciences, 1(102), 9680–9686. https://doi.org/doi.10.4314/jab.v102i1.2
- Mushagalusa, N. G., Kashemwa, A., Sinza, C. B., Bigirimwami, L. C., Karume, K., & Lubobo, A. K. (2016). Responses of biofortified common bean varieties to di- ammonium phosphate fertilizer under climate variability conditions in South-Kivu, DR Congo. African Journal of Agricultural Research, 11(38), 3569–3577. https://doi.org/10.5897/AJAR2016.11295
- Ngongo, M., Kasongo, E., Muzinya, B., Baert, G., & Van Ranst, E. (2014). Soil resources in the Congo Basin: Their properties and constraints for food production. Nutrition and Food Production in the Congo Basin, (c), 214.
- Ntamwira, J. B., Mirindi, T. C., Pyame, D. M. L., Dhed’a, B. D., Bumba, E. M., Moango, A. M., … Kanyenga, A. L. (2017). Évaluation agronomique des variétés de haricot volubile riches en micronutriments dans un système intégré d’Agroforesterie sur deux sols contrastés à l’Est de la RD Congo. Journal of Applied Biosciences, 114(1), 11368. https://doi.org/10.4314/jab.v114i1.10
- Nyabyenda, J. M. (2009). Seasonal crop assessment. [on line]. 1–107 . Retrieved July 26, 2012, from Www.Countrystat.Org/Country/ … Methodology_crop_assessment.Doc
- Paredes, C. M., Viviana, B. V., & Juan, U. T. (2009). Inorganic nutritional composition of common bean (phaseolus vulgaris l .) genotypes race chile. Chilean Journal of Agricultural Research, 69(4), 486–495. https://doi.org/10.4067/S0718-58392009000400002
- Pfeiffer, W. H. (2007). HarvestPlus: Breeding crops for better nutrition. C. S. S. of America, Ed.. https://doi.org/10.2135/cropsci2007.09.0020IPBS
- Pypers, P., Sanginga, J. M., Kasereka, B., Walangululu, M., & Vanlauwe, B. (2011). Increased productivity through integrated soil fertility management in cassava-legume intercropping systems in the highlands of Sud-Kivu, DR Congo. Field Crops Research, 120(1), 76–85. https://doi.org/10.1016/j.fcr.2010.09.004
- Raharinosy, R. V. (1983). Étude de l ’ influence sur la libération des différentes doses de fumier d ’ un sol ferrallitique de Madagascar du phosphore. Cahier ORSTOM Série Pédologie, XX(n°2), 129–146.
- Raveneau, M., Coste, F., Moreau-Valancogne, F., Crozat, Y., & Dürr, C. (2014). Analyse de la germination-levée de deux légumineuses (pois - haricot): Intérêts et complémentarités des approches expérimentales et numériques. Innovations Agronomiques 35, 35, 1–11.
- Sandberg, A. (2002). Bioavailability of minerals in legumes Bioavailability of minerals in legumes. British Journal of Nutrition, 88(3), S281–S285. https://doi.org/10.1079/BJN/2002718
- Sanginga, N., & Woomer, P. L. (2009). Integrated soil fertility management in Africa: Principles, practices and developmental process. Tropical Soil Biology and Fertility Institute of the International Centre for Tropical Agriculture (TSBF-CIAT). 259. www.ciat.org/tsbf-institute%0AThis
- SNSA. (2015). Annuaire statistique 2013-2014. In Ministère du Plan et Révolution de la modernité. Kinshasa-Gombe.
- Statistix. (2003). Statistix version 8, user’s manual. Analytical Software. https://doi.org/10.1016/j.vetmic.2007.10.034
- Steiner, K. G. (1996). Causes of soil degradation and development approaches to sustainable soil management appendices.
- USDA. (2017). Soil survey manual. https://doi.org/Agriculture Handbook No. 18
- Useni, Y. S., Kanyenga, A. L., Bin, L. A., Okese, E., Baboy, L. L., Ntumba, B. K., & Mpundu, M. M. (2014). Influence de la date de semis et de la fertilisation inorganique sur le rendement de nouveaux hybrides de maïs (Zea mays L .) à Lubumbashi. Journal of Applied Biosciences, 76, 6316–6325. https://doi.org/doi.10.4314/jab.v76i1.3
- Vanotti, M. B., Szogi, A. A., & Vives, C. A. (2008). Greenhouse gas emission reduction and environmental quality improvement from implementation of aerobic waste treatment systems in swine farms. Waste Management, 28(4), 759–766. https://doi.org/10.1016/j.wasman.2007.09.034
- Wana, S., Yang, G., & Mao, G. Responses of leaf nitrogen and phosphorus allocation patterns to nutrient additions in a temperate freshwater wetland. Ecological Indicators. https://doi.org/10.1016/j.ecolind.2019.105949
- Ward, M. H., Jones, R. R., Brender, J. D., de Kok, T. M., Weyer, P. J., Nolan, B. T., Villanueva, C. M., & van Breda, S. G. (2018, July). Drinking water nitrate and human health: An updated review. International Journal of Environmental Research and Public Health, 15(7), 1557. https://doi.org/10.3390/ijerph15071557
- Wolfgang, H. P. (2010, August). Harvest Plus: Developing and delivering micronutrient-dense crops. 19th World Congress of Soil Science, Soil Solutions for a Changing World, 12–15.
- WRB. (2015). World reference base for soil resources 2014: International soil classification system for naming soils and creating legends for soil maps. Food and A; F. and A. O. of the U. Nations, Ed. http://www.fao.org
- Yeken, M. Z., & Akpolat, H. (2018). Assessment of mineral content variations for biofortification of the Bean Seed Fasulye Tohumunun Biyofortifikasyonu için Mineral İçerik Vasyasyonlarının Değerlendirilmesi. International Journal of Agriculture and Wildlife Science (IJAW), 4(2), 261–269. https://doi.org/10.24180/ijaws.455311