
 ?Mathematical formulae have been encoded as MathML and are displayed in this HTML version using MathJax in order to improve their display. Uncheck the box to turn MathJax off. This feature requires Javascript. Click on a formula to zoom.
Abstract
This study aimed to identify determinants of rainwater harvesting adoption, and evaluate its impact on livelihood of smallholder farmers in Kutaber district. A multi-stage sampling technique was employed to select 196 sample households. Descriptive statistics and econometric models were used to analyze the primary data. Logit model was used to identify determinants of rainwater harvesting adoption while propensity score matching was used to evaluate its impact on livelihood of smallholder farmers. The result of logit model revealed that education level, family size, farming experience, participation in technology demonstration, and membership in farmer cooperative were significantly and positively affected adoption of rainwater harvesting technology, while age of household head negatively affected it. The finding of this study showed that adoption of rainwater harvesting technology have a positive and significant effect on the livelihood of farmers in terms of household annual farm income and food security. The result indicated that rainwater harvesting has significantly increased adopters' annual farm income by 35.13% and daily calorie intake per adult equivalent by 15.56% than non-adopters. Therefore, it is recommended to alter the attitude of technology averse older farmers, enhance farmer training and experience sharing, accessible demonstration sites and farmer cooperative to achieve extensive adoption of the technology thereby improve farmer’s livelihood.
PUBLIC INTEREST STATEMENT
Agriculture in Ethiopia is the primary base of the country economy. However, the sector still subsistence and highly dependent on rainfall. Hence, extending the production across time and space through rainwater harvesting technology is vital to improve smallholder farmers’ livelihood and meet the growing population demand in the country. There are major initiatives to support the construction of water harvesting ponds to improve the livelihood of smallholder farmers. With these efforts, the adoption rate without funding initiative are limited and adopters abandoning it later on. This study found that the determinants of rainwater harvesting adoption and evaluate its impact on the livelihood of smallholder farmers in Kutaber district. The finding emphasizes intervention to change the attitude of technology averse farmers, accessible demonstration sites to all and bring farmers to farmer cooperative to achieve extensive adoption of the technology thereby improve farmers’ livelihood and food security.
1. Introduction
Poverty alleviation in rural areas of Sub-Sahara Africa is a top priority for social and economic development particularly in rapidly increasing population and food demand. Sustainable intensification of agricultural techniques of water management practices results in higher agricultural production and improves resilience to drought and dry spells (Taddele et al., Citation2013). The development of water supply for energy, food, and industry to meet water insecurity for a large proportion of population increasing in Ethiopia. The government, private sector and farmers are investing in irrigation, and GTP II planned a significant expansion of land productivity and irrigation coverage (Parker et al., Citation2016). Ethiopian economy still relies on agriculture for approximately 42% to the country’s GDP, 85% of labor force, 90% of national export earnings (CSA, Citation2018). Hence, agriculture is the main user, and consumer of water (Parker et al., Citation2016).
The country coverage of high rainfall zone accounts about 24% of land, and 43% of population. Despite significant rainfall tends to exceed 800 mm/year in this zone, the rainfall is highly variable, and occurs in a limited period of the year. The moisture deficient and pastoral zone covers 76% of land with lower than 600 mm/year rainfall, and 57% population of the country (Bekele, Citation2010). The customary coping and adaptation strategies of agro-pastoralists and pastoralists in Ethiopia unable to sustain local livelihoods during drought. Hence, development of irrigation is the main strategy of the country to maintain livelihood in drought prone areas (Asrat & Anteneh, Citation2019). Small-scale irrigation played key role in improving farmers’ livelihood through diversified farming throughout the year which increased household income and create employment opportunity (Mengistie & Kidane, Citation2016).
Agriculture in Ethiopia is subsistence (CSA, Citation2017) and this sector still highly dependent on rainfall. Thus, rainfall is influential factor for improving agriculture development and the sector severely endanger with increasing inter-annual or seasonal climate variability (Alemu & Kidane, Citation2015). Rainwater harvesting creates ease of access to water and reduce vulnerability of farmers and pastoralists to climate change variability through high-value crop and livestock production (Aberra, Citation2014). Rainwater harvesting for domestic water supply and agricultural purposes is increasingly becoming important in the presence of growing the country’s population, shortage of resources and food insecurity (Aduna & Januszkiewicz, Citation2019). The benefits of rainwater harvesting technologies extend beyond supporting rain-fed farming to the whole ecological system (Aberra, Citation2014). Rainwater harvesting is vital in combating population pressure; food insecurity; soil and land degradation; high climate variability and low agricultural productivity (Alemu & Kidane, Citation2015). Water harvesting is considered as the single most important means to increase agricultural productivity in drought-prone areas through cultivating crops all over the year (Hagos et al., Citation2006). Rainwater harvesting government intervention contributed in improving agricultural productivity and changed cropping pattern towards market-oriented production thereby enhance farm household’s income (Amha, Citation2006).
1.1. Statement of the problem
Agriculture is the primary activity in Ethiopia, and played key role to bring sustainable economic development for the country (CSA, Citation2015). The land and land-based resources of the country have become severely degraded due to extensive subsistence agriculture and animal rearing practiced for many centuries (Aberra, Citation2014). Consequently, low crop productivity coupled with population pressure, and shortage of arable land contribute to the rising problem of low income and food insecurity in the country (Ayele et al., Citation2006). Shortage of water, access to improved seeds, increment of farm input costs hindering irrigation practices in Gubalafto district, North Wollo Zone (Mengistie & Kidane, Citation2016).
In Ethiopia, rainfall varies spatially, temporally, and inter-annually. About 80% of rainfall occurs between June and September, while 30% average variation year over year. Thus, increasing rainwater harvesting in particular and improving water control and rainwater management techniques, in general, are essential to ensure sustainable use of rainfall (Bekele, Citation2010). Moreover, rainwater harvesting address spatial and temporal water scarcity for home use, and agriculture. Absence of awareness on the technology, high water loss through seepage, and labor-intensive of pumping irrigation are the main difficulty in adopting water harvesting technologies (Alemu & Kidane, Citation2015). Despite its weather-risk reducing advantage, the number of rainfall shortage months, labour shortage, age of household head, education, and shortage of plastic-sheet increase dis-adoption (Bekele, Citation2012).
Amhara region characterized with diverse agroecology and diversified crop production potential in many parts of its zones with reliable rainfall. However, about 52 districts classified as low moisture, food insecure, and unreliable rainfall areas while the remaining categorized into moisture reliable areas (Ayele et al., Citation2006). The proportion of cropland in Belg season under irrigation accounts only 16.67% of total cropland area (CSA, Citation2016). The government and development organization in Kutaber district working on the use of rainwater harvesting technology to supporting rain-fed agriculture and improve households’ livelihood. With the effort of these organizations, the adoption of the technology without project initiatives are limited and rarely project supported adopters later cease the technology. Hence, identify determinants of rainwater adoption, and evaluate its impact on livelihood of stallholder farmers are vital for sustainable and effective development of the technology. Therefore, this study aimed to identify determinants of rainwater harvesting adoption and evaluate whether households with rainwater harvesting are better off in livelihoods (farm income and daily calorie intake) compared to non-adopters.
Specifically, the stud aimed:
To identify determinants of adopting rainwater harvesting in Kutaber district
To evaluate the impact of rainwater harvesting on smallholder farmer livelihoods in the study area
2. Research methodology
2.1. Description of the study area
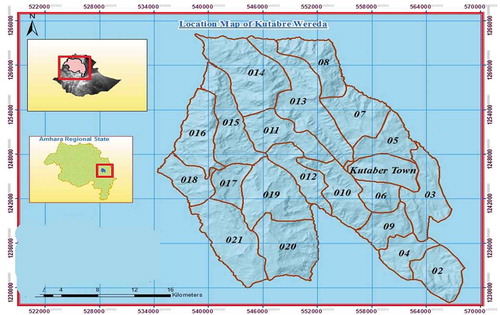
This study conducted in Kutaber district of South Wollo zone, Amhara National Regional State. Kutaber district located 22.6 km to the east of the zone city (Dessie) and 264 km north of Addis Ababa, the country’s capital. It is located at 11012ʹ36” −11018ʹ36” N latitude and 39031ʹ12” −39034ʹ12” E longitude. The district bordered on the south by Dessie Zuria, on the west by the Adila River, on the north by the Walano River, and on the east by Tehuledere district (Figure ). Kutaber district have highland and lowland areas with minimum and maximum rainfall ranges between 500 and 955 ml in rainy season. The annual temperature ranges from 10 to 20°C (KAO, Citation2018). The district has 21 kebeles and the projected total population of Kutaber district in 2017 was 113,132 which consists of 104,514 (92.38%) rural and 8,618 (7.62%) urban population (CSA, Citation2013). The economic base of the district population is mixed agriculture and the major-cultivated crops include Teff, Barley, Wheat, Bean, Field peas, Maize, Chickpeas, and sorghum. The sector is characterized by its rain-fed and subsistence and small-scale agriculture dependent on rainfall (KAO, 2018).
Figure 1. Location map of Kutaber district
2.2. Types, sources and methods of data collection
This study used both qualitative and quantitative data collected from primary and secondary sources. Primary data were collected from sample households (rainwater harvesting adopters and non-adopters) in Kutaber district. Primary data were collected in 2018/19 through formal structured and semi-structured questionnaires to generate the required data. Secondary data were collected from the relevant office reports, different internet sources, journals, institutes, or organizations.
The consumption data on the type and amount of food that the sample households consumed for 7 days before the survey on a daily basis collected since a seven-day recall method gives information that is more reliable. The local units that households ‘consumption were converted into kilocalorie using the food composition table adopted from Ethiopian Health and Nutrition Research Institute (EHNRI, Citation1997). The total households’ calorie intake for the last seven days divided by seven to calculate the households’ daily caloric intake. The household’s daily calorie intake per adult equivalent (calorie per AE per day) was calculated by dividing the households’ daily caloric intake by the family size after adjusting for adult equivalent using the consumption factors for age-sex categories. The Ethiopian government has set the minimum acceptable weighted average food requirement per person per day at 2200 kcal and employed as a cut-off point between food secure and insecure households in this study.
2.3. Sampling procedure and sample size determination
In this study, multi-stage sampling technique was employed to select sample households. In the first stage, 8 kebeles were purposively selected based on extensive rainwater harvesting practice in the area. In the second stage, from 8 kebeles, 4 kebeles namely Haroye, Abaselam, Kolagerado, and Kundi were randomly selected. A list of total household heads was obtained from the district office and then the total households in each district were categorized into rainwater harvesting technology adopters and non-adopters. Finally, a total of 196 household heads (104 adopters and 92 non-adopters) were selected from four selected rural kebeles proportional to the size of adopters and non-adopters population in the kebele. The sample size determined by (Cochran, Citation1977) formula using 7% degree of precision as follows:
Where
—Sample size
Z—Standard normal deviation, i.e., 1.96 for 95% confidence level
P = 0.5 (The proportion of the population adopting improved wheat varieties, that is 50%)
q = 1-P = 0.5 (50%) due to unknown variability
e = is margin of error or degree of accuracy desired, i.e., 0.07.
2.4. Methods of data analysis
Both descriptive statistics and econometric models were used to analyze the data.
2.4.1. Descriptive analysis
Descriptive statistics such as mean, standard deviation, frequency were used to compare and realize the demographic, socio-economic and institutional characteristics of the two group respondents along with inferential statistics like t-test and Chi-square tests.
2.4.2. Econometric analysis
Logit model was used to identify factors affecting adoption of rainwater harvesting technology while propensity score matching was used to evaluate the effect of adoption on households livelihood measured in annual farm income and daily calorie intake per adult equivalent.
2.5. Factors affecting adoption of rainwater harvesting
The conditional probability of receiving treatment when there are two treatment conditions (treatment vs. control) is estimated using binary logistic regression (Guo & Fraser, Citation2015). In this study, Logit model was employed to identify determinants of adopting rainwater harvesting technology in the study area. In estimating the logit model, the dependent variable is adoption status of rainwater harvesting which takes a value of 1 if the household is adopter and 0 otherwise. According to (Gujarati, Citation2003), the Logit model specified as follows:
Where P is the probability of adopting rainwater harvesting
Where, i = 1, 2, 3 … n
= intercept
Regression coefficient to be estimated
= household characteristics which affect adoption of the technology, and
= a disturbance term
The probability that a household being non-adopter is
2.6. Impacts of rainwater harvesting on smallholder farmers livelihoods
Propensity score analysis is a statistical method developed for estimating treatment effects with non-experimental or observational data (Guo & Fraser, Citation2015). Many authors use ex-post matching when no baseline data are available on the outcome of interest or background characteristics. Matching methods applied in the context of almost any program intervention when non-participated group exists in the program. Matching methods typically rely on observed characteristics to construct a comparison group, and so the methods require the strong assumption of no unobserved differences in the treatment and comparison population that are also associated with the outcomes of interest (Gertler et al., Citation2011). Propensity score matching (PSM) constructs a statistical comparison group based on a model of the probability of participating in the treatment, using observed characteristics. Participants then matched to non-participants based on propensity score. The average treatment effect of the program lastly calculated as the mean difference in outcomes across these two groups. The validity of PSM depends on two conditions: (a) conditional independence that means unobserved factors do not affect participation) and (b) sizable common support or overlap in propensity scores across the participant and nonparticipant (Khandker et al., Citation2010).
The estimation of the impact of household’s adoption of rainwater harvesting on farmers livelihood (annual farm income and daily calorie intake) (Y) is specified as:
Where; is treatment effect (effect due to adoption of rainwater harvesting), Yi is the outcome on household i, Di is whether household i has adopted rainwater harvesting or not (Caliendo & Kopeinig, Citation2005, Citation2008).
In the standard estimator E (Y1|Di = 1)—E (Y0|Di = 0), the primary interest of researchers is focused on the average outcome of adopters if they had not adopted (i.e., E (Y0|Di = 1)). Because this term is unobservable, evaluators use E (Y0|Di = 0) as a proxy (Guo & Fraser, Citation2015). Average Treatment Effect on the Treated (ATT) is the most importance to policy makers, which concentrates solely on the effects of adoption of rainwater harvesting technology.
Let the above equation expressed in causal effect notational form, by assigning Di =1 as a treatment variable taking the value 1 if the individual received the treatment (adopter) and 0 otherwise. The Average Effect of Treatment on the Treated (ATT) for the sample households given by:
The average outcome level of adopters obtained from the data while
is average outcome level of adopter if they were non-adopter cannot be obtained from the same individual. Hence, mean outcome of the comparison individuals, E (Y0/D =0), used as a substitute to the counterfactual mean for those being treated, E (Y0/D =1) after correcting the difference between treated and untreated households arising from selection effect.
The definition and hypothesis of explanatory variables, dependent variable, and outcome variables are summarized in Table .
3. Results and discussion
3.1. Descriptive analysis of sample households’ characteristics
The number of rainwater harvesting technology adopter were 104 (53.06%) and non-adopters were 92 (46.94%) from a total sample of 196. About 74.49% of the total household heads were male, whereas the proportion of the male-headed households for adopter and non-adopter were about 77.88% and 70.65%, respectively. As indicated in Table , the mean age of the sampled household heads was 46 years with the maximum of 71 and a minimum of 21 years. The mean age of adopter households was 44 years and that of non-adopter households was 48 years. The mean education level of adopters was 3.4 years while 1.78 for non-adopters with maximum of 10 years in education and a minimum of illiterate in the total sample households. The average family size of sample households was 2.15 with the maximum family size of 2.8 and the minimum of 1.8 in man equivalent. The mean family size of adopter households was 2.21 and that of non-adopter was 2.086. Rainwater harvesting adopters have an average of 23 years farming experience while non-adopters have 21 years farming experience. There is significant mean difference between adopters and non-adopters in age of household head, education level, family size, and farming experience at different probability level as indicated in Table .
Table 1. Description of Independent, outcome, and explanatory variables and hypothesis in Logit and PSM model
Table 2. Demographic household characteristics (continuous variable)
From the survey result, the mean frequency of the extension contact was 5 per month for sample households. The mean frequency of extension contacts for rainwater harvesting adopters was 6 while for non-adopters it is 4 per month during the survey year (Table ). The descriptive result of this study shows that the average distance of respondents’ residence from the nearest market center was 6 km with a minimum of 1 km and maximum of 19 km distance from farmers’ residence. On average, the nearest market faraway from adopters about 5 km, whereas for the non-adopter, it was about 7.22 km. The average distance from the farmer residence to the farm for adopters was 1.12 km while for the non-adopter’s group it was 1.27 km. The result of the descriptive analysis (Table ) shows that the mean farmland holding was 2.37 ha for the total sample households in the study area with minimum and maximum farm size of 1 and 4.65 ha, respectively. The mean farm size of the household for adopter was found to be 2.48 ha, whereas the average farm size for non-adopters were 2.26 ha in the study area. The descriptive analysis revealed that there was significant difference in frequency of extension contact, distance to the market, livestock holding, and landholding of households between adopter and non-adopter in water harvesting technology adoption. This implies that the rainwater harvesting adopters have frequent extension contact, near to the market, have large livestock holding and farmland size, on average when compared to that of non-adopters.
Table 3. Socio-economic and institutional characteristics of sample respondents (continuous variables)
In the study area, out of the total sampled respondents, 48.47% have received remittance during the survey year. The result also shows that from the total adopters 57.69% and from non-adopters 38.05% have obtained remittance income during the survey year. With respect to irrigation use from other source 39.29% of sample respondents have irrigation from other sources like river, lake etc. The result shows that 43.27% of adopters use rainwater harvesting for supplementary irrigation while 56.73% adopt rainwater harvest technology for agriculture without any primary water sources other than rainwater harvested. The study result in Table showed that 29.6% of the sample households used credit services while 70.4% had not used credit. The majority of the sampled households did not use credit services mainly due to religious concern on interest and lack of collateral to obtain credit. Participation of household head in technology demonstration revealed that 49.49% sample household have participated in water harvesting technology demonstration. The result shows that 68.27% adopters have participated in the demonstration of the technology while 28.26% did not have access for participation. The chi-square test shows there are statistically significant difference between adopters and non-adopter’s households in access to remittance income, farmer cooperative membership, and participation in the technology demonstration.
Table 4. Economic and institutional household characteristics (dummy variable)
The descriptive result of this study indicated that there is statistically significant mean difference in annual farm income of smallholder farmers and their food security status (daily calorie intake per adult equivalent) between adopters and non-adopters of rainwater harvesting at 1% significance level. The result shows that on average rainwater harvesting technology adopter households have additional 17,627 Ethiopian birr annual farm income than non-adopters (Table ). Furthermore, household food security status of rainwater harvesting adopters on average increased by 458.08 daily calorie than non-adopter households.
3.2. Econometric results
This sub-section presents model results on factors influencing adoption of rainwater harvesting and its impact on the household livelihood (farm income and daily calorie intake) using logit and propensity score-matching model, respectively.
3.2.1. Determinants of rainwater harvesting adoption
Logit regression model used to analyze factors affecting adoption of rainwater harvesting. The LR chi2(14) is significant at 1% significance level, which implies that the coefficients are jointly significant and the explanatory power of the factors included in the model is satisfactory.
Age of household head (Age): The age of the household head negatively affected the probability of adopting rainwater harvesting of farm households at 5% level of significance (Table ). As the age of the household head increased, the probability of adoption decreased because older household expected to be risk averse and reluctant in adopting new technology as their decision influenced by longstanding tradition. Moreover, the construction of ponds done by human labor and use of the water for cultivation is traditional and labor intensive which make difficult to older households in adopting the technology. In the other way, young household heads have exposure for information and higher acceptance of the technology. The finding in line with (Fasil, Citation2011; Kimani et al., Citation2015) findings that revealed age of household head negatively influence adoption of rainwater harvesting technology.
Table 5. Descriptive analysis of livelihood outcome variables
Education level: As expected, the estimation result revealed that educational level of the household head increase the probability of adoption of rainwater harvesting at 1% significance level. This implies that farmer’s education level increased the ability of farmers to acquire important technology information as well as other related agricultural information, which in turn increases farmer’s probability of adopting rainwater harvesting. In addition, educated households perceived the potential benefit obtained from adopting rainwater harvesting technology. The finding of (Siraj & Beyene, Citation2017) and (Ahmed et al., Citation2013) also revealed that education increased the ability of farmers to acquire important agricultural and technological information which increases farmer’s adoption of rainwater harvesting technology.
Family size (famsz): Family size in man equivalent positively affect the probability of adopting rainwater harvesting in the study area and significant at 5% significance level. This means households with large family size are more likely to adopt water harvesting since they would have sufficient family labor for farming activities. The positive effect of family size on adopting rainwater harvesting due to labor-intensive activities in construction of harvesting ponds, use the water for irrigation and cultivation. This finding was in agreement with the evidences of (Siraj & Beyene, Citation2017), found that the probability to use rainwater harvesting technology increases due to large working force in larger family household. In addition, the finding supported by (Amha, Citation2006) and (Zingiro, Citation2012) who found family size positively influence adoption of rain water harvesting technology.
Farming experience (Exper): As hypothesized, this variable influenced adoption of rainwater harvesting positively and significantly at 5% significance level. This might be due to the reason that, farmer with long farming experience use their previous exposure and experience in analyzing the benefit obtained from adopting the technology. The finding supported by (Siraj & Beyene, Citation2017) who found farmers who have longer years of experience in farming have adopted the technology than less experienced households in farming.
Participation in technology demonstration (Demonspart): The result of the study indicated that participation in rainwater harvesting technology demonstration positively affected adoption of rainwater harvesting at 10% significance level (Table ). This is due to that active participation in demonstration of the technology increase farmers’ practical knowledge of technology application and increase their awareness on its contribution.
Membership in farmers’ cooperative (Member): As hypothesized previously, household’s membership in farmers’ cooperative had positive and significant influence on adoption of rainwater harvesting at 5% significance level. The possible reason might be being member of farmer cooperative increase farmers’ attitude to the technology and accessibility of the technology. Results of (Zingiro, Citation2012) show that membership in farmer organizations also positively and significantly affect the probability of adopting rainwater harvesting ponds.
3.2.2. Impact of rainwater harvesting adoption on household livelihood
The impact evaluation of rainwater harvesting on smallholder farmer livelihoods conducted using the procedures of propensity score matching (PSM) method of impact evaluation. These procedures for impact evaluation are estimation of propensity score, identify common support region, choice of matching algorithm, testing covariance balance, and estimate average treatment effect, chronologically.
1). Estimation of propensity score
The PSM approach tries to capture the effects of different observed covariates X on participation in a single propensity score or index (Khandker et al., Citation2010). Propensity score matching essentially uses statistical techniques to create artificial comparison group by identifying propensity score for every possible observation under treatment and non-treatment observation that has the most similar characteristics possible (Gertler et al., Citation2011). In such a context, matching methods enable to identify the set of non-participant households that look most similar to the treatment households, based on the characteristics that have available in your data set. These “matched” non-participant households then become the comparison group to estimate the counterfactual (Gertler et al., Citation2011; Khandker et al., Citation2010).
Results presented in Table show that the estimated model appears to perform well for the intended matching exercise. The likelihood ratio of chi-square value, 74.08, revealed that the overall fitness of the model was significant at 1% probability level. Moreover, the small value of Pseudo-R2 (0.27) showed that adopter households do not have much distinct characteristics over non-adopters’ households and as such finding a good match between adopter and non-adopter households becomes easier. After matching there should be no systematic differences in the distribution of covariates between both groups and therefore, the pseudo R2 should be fairly low (Caliendo & Kopeinig, Citation2008).
2). Common support region
Next, the region of common support needs to be defined where distributions of the propensity score for treatment and comparison group overlap (Khandker et al., Citation2010). The basic criterion of this approach is to discard all observations whose propensity score is smaller than the minimum and larger than the maximum in the opposite group (Caliendo & Kopeinig, Citation2008).
The common support region (overlap condition) for the estimated propensity score constructed based on the summary statistics of the adopter and non-adopters. Therefore, the common support region determined by taking the maximum of the minimums (the minimum of adopters) and minimum of the maximums (maximum of non-adopters) for the two groups’ propensity scores. Based on this technique, the common support region found to be between the value of propensity score of 0.0697608 and 0.9637119 (Table ). Because of the overlap condition, 13 observations (6 non-participants and 7 participants) were out of the common support and hence discarded from the observations used to analyze the impact of adopting rainwater harvesting on household livelihood (treatment effect on the treated).
Table 6. Logistic regression results for determinants of rainwater harvesting adoption
3). Choice of matching algorithm
After propensity scores are estimated, the next step of analysis often entails matching treated to control participants based on the estimated propensity scores (Guo & Fraser, Citation2015). The units in the treatment group matched with units in the pool of control group that have the closest propensity score, which used to produce an estimate of the counterfactual. The propensity score matching method tries to minimize the randomized assignment to treatment and comparison groups by choosing for the comparison group those units that have similar propensities to the units in the treatment group (Gertler et al., Citation2011).
Different approaches exist to match adopter and non-adopter based on the propensity score. These include nearest-neighbor matching, caliper and radius matching, stratification and interval matching, and kernel matching (Khandker et al., Citation2010). These matching methods use different means of matching the beneficiaries to the control group to determine the average effect of certain program participation or intervention. Matching estimators were evaluated via matching the adopters and non-adopters’ households in common support region (Table ).
The matching quality indicator showed that kernel matching at bandwidth 0.1, radius calipers at bandwidth 0.1 and nearest neighbor (5) yield similar performance of high balance test and matched sample size. Hence, the matching algorithm compared based on standard bias reduced after matching. Based on Table , nearest neighbor matching selected for this study and used to estimate the impact of adoption of rainwater harvesting on household livelihood. Nearest neighbor matching induced the same balance in baseline covariates as did optimal matching (Austin, Citation2013). The individual from the comparison group is chosen as a matching partner for a treated individual that is closest in terms of propensity score (Caliendo & Kopeinig, Citation2008).
Table 7. Summary of common support region for estimated propensity score
Table 8. Performance criterion of different matching algorithm
4). Testing of covariates` balance
The balancing powers of the estimations were ascertained by considering different test methods such as the reduction in the mean standardized bias between the matched and unmatched households and equality of means using t-test. The standardized difference in covariates before matching is in the range of 5.5% and 81.6% in absolute value whereas the remaining standardized difference of covariates for all covariates lies between 0.4 and 21.5% after matching (Table ). This fairly around the critical level of 20% suggested by Rosenbaum and Rubin (Citation1983). Therefore, the process of matching creates a high degree of covariate balance between the treatment and control samples that are ready to use in the estimation procedure. Similarly, T-values also reveal that all covariates became insignificant after matching while four of them were significant before matching.
The low pseudo-R 2 and the insignificant likelihood ratio tests support the hypothesis that both groups have the same distribution in covariates X after matching (Table ). These results clearly show that the matching procedure is able to balance the characteristics in the treated and the matched comparison groups. Therefore, these results in evaluate the effect of using adoption of rainwater harvesting among groups of households having similar observed characteristics. This allowed us to compare observed outcomes for adopters with those of a comparison groups sharing a common support.
Table 9. Standard bias after matching for choosing best algorithm
Table 10. Propensity score and covariate balancing
Table 11. Chi-square for the joint significance of variables
Table 12. ATT for total kcal intake and annual farm income due to adoption
5). Estimation of average treatment effect on the adopters
The difference in outcomes between the treatment and their matched comparison units produces the estimated impact of the program. The program’s impact is estimated by comparing the average outcomes of a treatment group and the average outcome among a statistically matched subgroup of units, the match being based on observed characteristics available in the data at hand (Gertler et al., Citation2011). The impact of adoption of rainwater harvesting on outcome variables (household farm income and daily calorie intake per adult equivalent) are evaluated for their significant impact on adopters livelihood after pre-intervention differences were controlled.
After controlling for pre-intervention differences in socio-economic, demographic, and institutional characteristics of the adopter and non-adopter households, it has been found that, on average, rainwater harvesting technology adoption has increased annual farm income by 10585.567 birr (35.13%) compared to non-adopters. In addition, adoption of rainwater harvesting improved household daily calorie intake per adult equivalent by 359.27 kilocalorie, which is higher by 15.56% than non-adopters (Table ). The impact estimates shows significant difference in household income and daily calorie intake of treated and control groups at 1% significance level. This might be due to rainwater harvesting practice and utilization increases the opportunity to produce diversified crops all year round on the same farm, which increase household income and improve food security. Farmers who adopt rainwater harvesting technology grow different type of crops year round and increased household crop production there by significantly increased household income (Fasil, Citation2011). Moreover, the finding supported by (Zingiro, Citation2012) adoption of rainwater harvesting ponds has a positive effect on household farm income per acre. Farmers have shown visible impact on their livelihood and improvement in food security situation after using the technology (Ayele et al., Citation2006).
4. Conclusion and recommendation
4.1. Summary and conclusion
Rainwater harvesting for both domestic water supply and for agricultural purposes is increasingly becoming important in the presence of growing the country population, shortage of resources and food security. The government and development organization working to improve farmers’ livelihood through mitigating rain shortage and variability using rainwater harvesting farming in Kutaber district. Despite the fact, adoption level of the technology and its impact were not evaluated for sustainable and effective development of the technology. Therefore, this study aimed to identify determinants of rainwater harvesting adoption, and evaluate whether households with rainwater harvesting are better off in livelihood (farm income and daily calorie intake) compared to non-adopters.
This study used both qualitative and quantitative data collected from primary and secondary sources. Primary data were collected from sample households (rainwater harvesting adopters and non-adopters of sampled kebeles of Kutaber district. Primary data were generated through formal structured and semi-structured questionnaires to collect the required primary data. Descriptive statistics and econometric models were used to analyze the data collected from sample respondents. Logit model was used to identify the determinants of adoption of rainwater harvesting while PSM was used to evaluate the impact of adoption of rainwater harvesting technology on livelihood of adopter households relative to non-adopters.
The result of logit model revealed that, out of total 14 explanatory variables included in the model, 6 variables were found to be significantly determined adoption of rainwater harvesting technology in the study area. To this effect, education level of household head, family size, farming experience, participation in technology demonstration, and membership in farmer cooperative have positive influences on farmer adoption of rainwater harvesting technology whereas, age of household head negatively affected it. The propensity score matching has resulted in 96 adopter households to be matched with 85 non-adopter households after discarding 13 sample respondents whose values were out of common support region and the other 2 were unmatched. Matched comparison of household livelihood made using annual farm income and daily calorie intake per adult equivalent on these households who shared similar characteristics except adoption of rainwater harvesting. The nearest neighbor-matching algorithm selected as a best-fit matching estimator since it yields relatively large balanced test and matched sample size as well as lowest standard bias after matching. After controlling for pre-intervention differences in socio-economic, demographic, and institutional characteristics of the adopter and non-adopter households, it has been found that, on average, rainwater harvesting increased adopters annual farm income by 35.13% and daily calorie intake by 15.56% than non- adopters.
4.2. Recommendations
Based on the findings of the study, the following points are suggested to increase farmers’ adoption of water harvesting thereby improve their livelihood in the study area. Age of household head negatively affected adoption of rainwater harvesting and hence it is important for technology provider, extension agents, NGOs to target on changing the awareness of technology averse older farmers through sharing experience of effective adopters and demonstration participation. Education level of household head and farming experience positively affected adoption, enhancing the educational status of the farmers possibly through adult education, promoting farmers training centers and experience sharing among farmers. Family size positively affected adoption of the technology, which indicates the technology is labor intensive. Therefore, continuous development for upgrading technology needed and besides teamwork between farmers should be encouraged. Finally, participating in technology demonstration and membership in farmer cooperative positively affect rainwater harvesting adoption. Hence, demonstration sites should be far-reaching to wide population of rural farmers. Similarly, farmer cooperative should work to address large population of smallholder farmers.
Competing interests
The authors declare no competing interests.
correction
This article has been republished with minor changes. These changes do not impact the academic content of the article.
Additional information
Funding
Notes on contributors
Zenebe Kelemewerk Mekuria
Zenebe Kelemewerk Mekuria has MSc in Geo-information and Earth Observation Science from Mekelle University. Currently, he is working in Kutaber district as PSNP focal unit coordinator and natural resource management specialist. Ebrahim Endris is a lecturer at Woldia University department of Agricultural Economics. He has MSc degree in Agricultural Economics from Haramaya University. Andualem Kassegn is a lecturer at Woldia University department of Agricultural Economics. He has MSc degree in Agricultural Economics from Wollo University. Zenebe Kelemewerk interested to conduct a research related to land use planning and management, watershed management, natural resource conservation, and impact assessment.The research interests of Ebrahim Endris and Andualem Kassegn lies on efficiency of farm production, agricultural productivity, technology adoption, impact evaluation, agricultural market chain analysis, food security, agricultural cooperative, and risk and financial management.
References
- Aberra, Y. (2014). Rain Water Harvesting for Climate Change Adaptation in Ethiopia - Policy and Institutional Analysis. Visiting Research Fellows at the Institute of Developing Economies (No.488).
- Aduna, F., & Januszkiewicz, K. (2019). Rainwater in Ethiopia as a new energy resources. new approach to sustainable development in the mountain area. Materials Science and Engineering, (471), 1-9. Doi:10.1088/1757-899X/471/8/082016
- Ahmed, I., Onwonga, R. N., Mburu, D., & Elhadi, Y. A. (2013). Evaluation of types and factors influencing adoption of rainwater harvesting techniques in Yatta district, Kenya. International Journal of Education and Research, 1(6), 1–19. https://www.ijern.com/June-2013.php
- Alemu, B., & Kidane, D. (2015). Rainwater harvesting: An option for dry land agriculture in arid and semi-arid Ethiopia. International Journal of Water Resources and Environmental Engineering, 7(2), 17–28. https://doi.org/10.5897/ijwree2014.0539
- Amha, R. (2006). Impact Assessment of Rainwater Harvesting Ponds: The case of Alaba Woreda, Ethiopia. MSc Thesis, Addis Ababa University, Ethiopia.
- Asrat, D., & Anteneh, A. (2019). The determinants of irrigation participation and its impact on the pastoralist and agro-pastoralists income in Ethiopia: A review study. Cogent Food & Agriculture, 5(1), 1–10. https://doi.org/10.1080/23311932.2019.1679700
- Austin, P. C. (2013). The performance of different propensity score methods for estimating marginal hazard ratios. Statistics in Medicine, 32(16), 2837–2849. https://doi.org/10.1002/sim.5705
- Ayele, G., Ayana, G., Gedefe, K., Bekele, M., Hordofa, T., & Georgis, K. (2006). Water harvesting practices and impacts on livelihood outcomes in Ethiopia. EDRI.
- Bekele, M. (2012). Economic analysis of water harvesting technologies in Ethiopia. PhD Dissertation, Wageningen University, Netherland.
- Bekele, S. (2010). Irrigation potential in Ethiopia: Constraints and opportunities for enhancing the system. International water management institute. Colombo, Sri Lanka.
- Caliendo, M., & Kopeinig, S. (2005). Some practical guidance for the implementation of propensity score matching. IZA discussionPaper No. 1588. IZA Institute of Labor Economics, Germany.
- Caliendo, M., & Kopeinig, S. (2008). Some practical guidance for the implementation of propensity score matching. Journal of Economic Surveys, 22(1), 31–72. https://doi.org/10.1111/j.1467-6419.2007.00527.x
- Cochran, W. G. (1977). Sampling techniques (3rd ed.). John Wiley & Sons.
- CSA. (2013). Population projection of Ethiopia for all regions at wereda level from 2014 – 2017. Central Statistical Agency, Ethiopia.
- CSA. (2015). Large and medium scale commercial farms sample survey 2014/15 (Statistical report on area and production of crops, and farm management practices. Central Statistical Agency, Ethiopia.
- CSA. (2016). Agricultural sample survey 2015/16 (2008 E.C) Volume V: Report on area, production and farm management practice of Belg season crops for private peasant holdings. Central Statistical Agency, Ethiopia.
- CSA. (2017). Agricultural sample survey 2016/2017 (2009 E.C.): Report on area and production of major crops (private peasant holdings, Meher season). Central Statistical Agency, Ethiopia.
- CSA. (2018). Key findings of the 2017/2018 (2010 E.C): Agricultural sample surveys. Central Statistical Agency, Ethiopia.
- EHNRI. (1997). Food composition table for use in Ethiopia part III. Ethiopian Health and Nutrition Research Institute.
- Fasil, D. (2011). The impact of rainwater harvesting technology on household income: The case of Boset Woreda, Oromia Region, Ethiopia. MSc Thesis, Haramaya University, Ethiopia.
- Gertler, P. J., Martinez, S., Premand, P., Rawlings, L. B., & Vermeersch, C. M. J. (2011). Impact Evaluation in Practice is available as an interactive. The World Bank. https://doi.org/10.1596/978-0-8213-8541-8
- Gujarati, D. N. (2003). Basic Econometrics (4th ed.). McGraw-HiII/lrwin.
- Guo, S., & Fraser, M. W. (2015). Propensity score analysis: Statistical methods and applications (2nd ed.). SAGE Publications, Inc.
- Hagos, F., Kruseman, G., Abreha, Z., Linderhof, V., Mulugeta, A., & Samuel, G. (2006). Impact of small scale water harvesting on household poverty: Evidence from Northern Ethiopia. Institute for Environmental Studies, Vrije Universiteit, Netherland.
- KAO. (2018). Kutaber Agriculture Office annual report of 2017/18.
- Khandker, S. R., Koolwal, G. B., & Samad, H. A. (2010). Handbook on Impact evaluation_ quantitative methods and practices. The World Bank. https://doi.org/10.1596/978-0-8213-8028-4
- Kimani, M. W., Gitau, A. N., & Ndunge, D. (2015). Rainwater Harvesting Technologies in Makueni County, Kenya. Research Inventy: International Journal Of Engineering And Science, 5(2), 39–49. http://www.researchinventy.com/v5i2.html
- Mengistie, D., & Kidane, D. (2016). Assessment of the impact of small-scale irrigation on household livelihood improvement at Gubalafto District, North Wollo, Ethiopia. Agriculture, 6(27), 1–22. https://doi.org/10.3390/agriculture6030027
- Parker, H., Mosello, B., Calow, R., Quattri, M., Kebede, S., & Alamirew, T. (2016). A thirsty future? Water strategies for Ethiopia’s new development era. Overseas Development Institute, London.
- Rosenbaum, P. R. & Rubin, D. B. (1983). The central role of the propensity score in observational studies for causal effects. Biometrika, 70(1), 41–55. https://doi.org/10.1093/biomet/70.1.41
- Siraj, N., & Beyene, F. (2017). Determinants of adoption of rainwater harvesting technology: The case of Gursum District, East Hararghe Zone, Ethiopia. Social Sciences, 6(6), 174. https://doi.org/10.11648/j.ss.20170606.15
- Taddele, Y., Karlberg, L., Temesgen, M., & Rockström, J. (2013). The role of water harvesting to achieve sustainable agricultural intensification and resilience against water related shocks in sub-Saharan Africa. Agriculture, Ecosystems & Environment, 181(1), 69–79. https://doi.org/10.1016/j.agee.2013.09.014
- Zingiro, A. (2012). Assessment of adoption and impact of rain water harvesting technologies on rural farm household income: The case of Rainwater harvesting ponds in Rwanda. MSc Thesis, University of Nairobi, Kenya.