
 ?Mathematical formulae have been encoded as MathML and are displayed in this HTML version using MathJax in order to improve their display. Uncheck the box to turn MathJax off. This feature requires Javascript. Click on a formula to zoom.
Abstract
Poor soil fertility status due to erosion, intensive farming, and leaching of nutrients causes food insecurity in Ethiopia. Hence, estimating soil fertility status using different measurements is very essential to secure food insecurity. The aim of this study was to determine the effects of land management on soil fertility using a nutrient balance approach at Kecha and Laguna micro watersheds in 2016. Plant nutrient losses were estimated through measuring discharge and sediment loads coming from the treated (Kecha) and untreated (Laguna) catchments. A total of 40 bulk sediment and water samples were collected on a monthly basis. The inputs used in the two catchments, inorganic fertilizer and organic manure, were quantified through interviews using a semi-structured questionnaire. Plant samples were collected from 92 plots for determining grain yield (OUT1) and straw biomass (OUT2). Other inputs and outputs were calculated using a transfer function. From sediment, grain and straw samples, NPK contents were determined. The nutrient balances were found to be −89.37, −23.66 and −124.75 NPK kg/ha, and −112.41, −20.62 and −130.26 NPK for Kecha and Laguna, respectively. The main paths for these negative balances were residue removal and soil losses. Higher nutrient losses were observed in Laguna than Kecha watershed; this may be due to lack of soil management practices, crop rotation and planting of leguminous plants. Therefore, soil management practices should be done to reduce these higher losses of plant nutrients, and maintain crop residues in the farm so that nutrient recycling and better soil fertility can be achieved.
PUBLIC INTEREST STATEMENT
In Ethiopia, soil fertility is declining due to rapid population growth, the change in Agricultural activities, absence of crop rotation, and poor soil conservation practices. This causes for declining per capita food production in sub-Saharan African countries in general and Ethiopia in particular. Therefore, conducting scientific researches on soil fertility and land management practices is very important. The current study on the effect of land management on soil fertility using a nutrient balance approach was conducted on two micro watersheds, Kecha (treated) and Laguna (untreated), found in northwestern, Ethiopia. This is very important to quantify the net loss of major plant nutrients in both watersheds, through sediment, and the removal of other outputs such as grain and straw. This inturn can help the researchers in the area to know the nutrient status of the lands in both micro watersheds, to understand the effects of sustainable land management on nutrient losses, and to find solutions accordingly.
1. Introduction
Food production in the tropics and subtropics usually relies on available soil nutrient stocks/soil fertility. This soil fertility is a major production factor for most farmers in Sub-Saharan African Countries in general and Ethiopia in particular where agriculture is the backbone of the country’s economy (Sheldrick et al., Citation2003). However, soil fertility is declining from time to time due to rapid population growth, the change in Agricultural activities, absence of crop rotation, poor soil conservation/Land management practices and so on. The changes in Agricultural activities change the soil chemical, physical, and biological properties, and play the major role for soil degradation mainly due to soil fertility decline as a result of lack of nutrient inputs (Lal, 1986 as cited in Alfred & Tom, Citation2008). It is not questionable that the fertility of any soil declines if the nutrient contents of the harvest removed from the system exceeds the nutrient inputs from natural and anthropogenic sources (Gruhn et al., Citation2000). This mainly happens when there is low natural soil fertility, limited fill-up of removed nutrients and high erosion rates in mountainous areas which inturn cause a major threat to current and future food production (Gachimbi et al., Citation2005; Harris & Consulting, Citation2014). Soil loss is a worldwide risk and adversely affects the productivity of all natural ecosystems as well as agricultural, forest, and rangeland ecosystems (Lemenih, Citation2014; Perkins et al., Citation2013; Van Leeuwen et al., Citation2015). Changes in soil quality affected by accelerated erosion are significant and have resulted in decreased production and land abandonment.
Cropping systems are generally characterized by high nutrient losses, especially for N, P and K (Tabi et al., Citation2013). Long-term processes that adversely affect sustainability, such as decrease and eventual depletion of soil nutrient stocks, are not readily apparent and receive little attention (Ehabe et al., Citation2010). Monoculture crop production, non-adoption of soil-conservation management practices, overcutting of vegetation, unbalanced fertilization, the excessive use of groundwater for irrigation and, improper use of pesticides and so on on fragile soils contribute to soil organic matter losses and to increased water and wind erosion risks, leading to soil physical degradation and to the decline of the soil production potential (Boli Baboule, Citation1996). Exportation of crop residues reduces the stock of easily exchangeable elements, leading after four years to the mineralization of soil organic matter by 50% and to the leaching of some of the released nutrients, exposing therefore the soils to erosion (Harmand et al., Citation2000). Therefore, to prevent the effects of poor land management practices mentioned above, sustainable soil management in agricultural land is needed for a sustainable world (Costa et al., Citation2015).
Because of this, Ethiopian Government had launched massive soil conservation programs throughout the country in the middle of 1970s (Hawando, Citation1997) involving different nongovernmental organizations (NGOs) and mobilizing local people. The different programs under food-for-work program comprised land leveling programme (LLP), sustainable land management (SLM), United Nations Development Program (UNDP), and Productive Safety Net Program (PSNP). The programs aimed at transforming agriculture through conservation of soils, reducing soil erosion, and restoring soil fertility. One of the programs was in steeply sloping areas for rehabilitation of degraded lands by introducing mechanical conservation measures, use of perennial crops, plantation of forest areas, and use of organic manures. The commonly followed soil management practices included (a) use of a soil bund, (b) use of only manure, and (c) use of integrated bund and manure. The management practices ought to influence differentially the soil characteristics and attendant soil fertility regimes. Recent studies (G. Dagnachew et al., Citation2020; Selassie et al., Citation2015) have indicated usefulness of these conservation practices in improvement of soil fertility. Such studies need to be taken up under different soil and climatic conditions influencing the performance of soil conservation measures. Yantai et al. (Citation2015) stated that diversifying cropping systems with pulse crops can improve the attributes of soil water conservation and soil N benefits and increase total grain production.
The effects of different land management practices on soil fertility can be estimated using different measurement techniques. Soil nutrient balance defined as the difference between the sum of nutrient input and output flows within a specific system (field, farm, nation) over a certain period (season or year) is a commonly used indicator of soil fertility. Soil nutrient balances reflect the net change in soil fertility and indicate trends in time, but do not necessarily determine the current state of soil fertility. Nutrient balance assessment indicates the direction of soil fertility and is a critical indicator of sustainability (Sparovek & Schnug, Citation2001). Nutrient budgeting as a tool for soil productivity assessment has been prominent since 1990 (Lynam et al., Citation1998) and has since been significantly enhanced and extended to better characterize and analyze nutrient management. Nutrient balance assessment methods are widely applied in the African context. Studies have been undertaken at a variety of scales: from plot and catchment to regional analyses and, sometimes, even continent-wide assessments. The conclusions emerging from such studies point to widespread processes of “nutrient mining” and soil fertility decline. Considering the urgent need to increase agricultural production in Africa, these are alarming conclusions. These, in turn, have prompted a variety of responses at a policy level, where conclusions from nutrient balance assessments are increasingly used to justify policies and interventions, at both national and international levels (FAO, Citation1993). Despite major efforts from research centers, NGOs, government, farmers and their organizations, effective soil fertility management remains a major challenge in the continent (Onduru et al., Citation2007). Therefore, the demand to apply reliable indicators of soil nutrient mining and related land degradation is ever increasing (Sheldrick & Lingard, Citation2004). According to Hartmink (Citation2006), soil fertility decline can be determined by monitoring soil chemical properties over time (Chrono sequences) or at different sites (bio sequences), and the calculation of nutrient balance, with the last one being the most used and cost-efficient technique. Nutrient balances computed from the difference between nutrient inputs and outputs of a system with predefined spatial-temporal boundaries (Bindraban et al., Citation2000) are generally expressed in the amount of nutrient(s) per unit of area and time (kg ha−1 year−1). Negative nutrient balances indicate that a system is losing nutrients while positive nutrient balances show nutrient accumulations.
The main assumption about the nutrient balance approach is that a system in sever or continuous disequilibria is not sustainable in the long term. The scholars (Haileslassie et al., Citation2005; Henao & Baanante, Citation1999; De Jager et al., Citation1998; Walaga et al., Citation2000) reported that depletion rate can be increased due to population growth. Other scholars such as Giller et al. (Citation1997) and Haileslassie et al. (Citation2006) reported that redistribution of nutrients within the watershed causes simultaneous nutrient deficiencies and oversupply in different land-use, which leads to a continuous concentration of nutrients in smaller areas around homesteads at the expense of nutrients depleted in more distant and larger fields. This can create zones of nutrient accumulation around the homestead.
In many farming systems, nutrient management of different fields belonging to single farm households may vary considerably (Smaling & Fresco, Citation1993). Because farmers’ decision on fertility management can be influenced by both socioeconomic and biophysical environments, resource endowment and production objectives (i.e. Land use and crop selection). Therefore, studies involving the determination of soil nutrients at a watershed scale can provide information on how environmental conditions and agricultural managements affect the variation in nutrient flows between and within the micro watersheds. This information is also indispensable for properly understanding variations in nutrient flux studies at higher spatial scales and their limitations (Cobo et al., Citation2010).
The current study on nutrient balance was conducted on two micro watersheds, Kecha (treated) and Laguna (untreated), found in Aba Gerima watershed, northwestern, Ethiopia. Even though some studies were conducted related with sustainable land management, to the best of our knowledge, a study on the estimation of the effects of land management on soil fertility using the nutrient balance approaches had not been conducted in both micro watersheds. It is obvious that the soil nutrient balances vary spatially and temporally. In order to apply nutrients, it is necessary to know the site-specific variability in nutrient supply to overcome the mismatch of fertilizer types and crop nutrient demand (Dobermann & Cassman, Citation2002).
Therefore, conducting a nutrient balance assessment in the area was very important to quantify the net plant nutrient loss during the main rainy season through sediment, leaching and the removal of other outputs such as grain and straw. The estimation of plant nutrient losses in the treated and untreated watersheds can help the researchers in the area to know the effects of sustainable land management on soil nutrient losses and take action measurements accordingly.
2. Materials and methods
2.1. Description of the study area
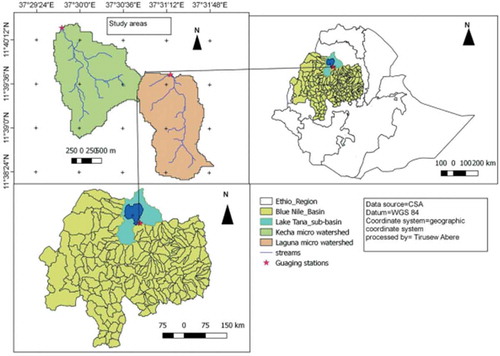
The study site, Aba Gerima watershed, is located 15 km away from Bahir Dar town, northwestern Ethiopia (). The watershed lies within 37°29ʹ24ʹ’ E-370 32ʹ24ʹ’ latitude and 11° 38ʹ 24ʹ’ N-11° 40ʹ 12ʹ’ N longitude. It is found within the subtropical climatic zone with an annual rainfall of 1518 mm and average daily temperature of 20 °C. The total area coverage of the watershed is 720 ha of which 385 ha is covered by Kecha and the remaining 335 ha is enclosed in Laguna (Mekonen, Citation2016).
Figure 1. Location map of the study area
2.2. Experimental setup
To investigate the impacts of land management on nutrient budget, one of the twin watersheds (Kecha micro watershed) was treated with land management practices. This micro watershed has been used as a study cite for different researchers funded by the Swiss Development Cooperation through the Water and Land Resource Center (WLRC). It has been used as an experimental watershed for integrated water and land resource management since 2011. In this watershed, Physical and biological SWC measures including soil and stone bands, fanyajuu, cut-off drain, waterways and area closures were widely implemented. Most of the area was protected from free grazing. The other micro watershed (Laguna) was untreated; has only remnants of physical soil water conservation practices. It is to mean that soil conservation practices were implemented earlier but have been dis-adopted. Agriculture in both micro watersheds was dominated by subsistence mixed crop-livestock farming systems. Both micro watersheds have been equipped by discharge and sediment gauging stations, constructed in 2015 by KAKHANI Ethiopia Project funded by Japan Society for the promotion of Science (JSPS). Gauging stations were installed at the outlets of the micro watersheds to monitor discharges and sediment yields. These stations were located in relatively stable and straight cross sections of the rivers to minimize sediment deposition in the channel (Yeshaneh et al., Citation2014). Each monitoring stations was equipped with an automatic pressure transducer. A staff gauge mounted on the side of the stream bed and strongly fixed in place with a concrete base was used to take depth-integrated sediment samples. The nutrient balance components utilized in the study are indicated in .
Table 1. Nutrient balance components and methods of determination
2.3. Sampling procedures and data collection
The socioeconomic data were gathered from the area for Input 1 and Input 2 to estimate the amount of inorganic and organic fertilizers used by farmers. From the total of 340 households in the two watersheds, only 71 households were found to sow the three major crops (Teff, maize, and finger millet). From these 71 HHs, 60 households were randomly selected applying the sample size determination formula and interviewed using semi-structured questionnaires.
where n is the sample size, N is the total population, and e is level of precision (0.05 in our case).
The NPK balances were calculated by combining values obtained from inputs and outputs measurment (Stoorvogel & Smaling, Citation1990).
In order to determine Output 1 and Output 2, yield samples were collected from farmer’s land using quadrant method. Grain and straw samples were collected from 92 plots and the NPK nutrient contents were analyzed in the laboratory. Total nitrogen was determined by Macro-Kjeldahal method that involves digestion of the samples followed by a wet-oxidation (Kjeldahl, Citation1883). Available phosphorus was determined using the Olsen method (Olsen, Citation1954) while Potassium was determined by Meliche-3 method (Mehlich, Citation1984).
Input 3 (atmospheric deposition): was calculated as the square root of mean annual rainfall (mm) using the coefficient 0.014 for nitrogen, 0.023 for phosphorus and 0.092 for potassium as stated in Stoorvogel and Smaling (Citation1990) and Smaling and Fresco (Citation1993).
Input 4a (None biological Nitrogen fixation): This was determined from none symbiotic nitrogen fixation using transfer functions of Stoorvogel and Smaling (Citation1990).
Input 4b (Biological Nitrogen fixation) was calculated by considering the land covered with nitrogen-fixing plants such as Susbania and lupines.
Sediment loss (Output 5) was measured automatically using discharge monitoring stages (20-min intervals) using the TD-Diver water level sensor, and manually three times per day (at 01:00 pm, 7:00 am, and 6:00 pm) using the graduated staff gauge. Surface stream flow velocities were measured using the manual (float) method (Zenebe et al., Citation2013) at various stages, including peak flows as special incidents. The corresponding discharge, for each float velocity measurement, was determined by the velocity-area method. The corrected continuous-automated flow depth (stage) data were then transformed into discharge based on standard stage-discharge rating curves for each watershed. Suspended sediment samples (about 1 L) were collected for each rainy day of the sampling year, 2016. Samples were collected at the center of the stream, and when peak flows or larger changes were observed in stream flows, samples were taken using a depth-integrated sampler and plastic bottles (Bouchez et al., Citation2011). Then discharge rating curves were used to estimate suspended sediment concentrations for the continuous discharge series calculated from the TD Diver readings (Asselman, Citation2000; Guzman et al., Citation2013; Vanmaercke et al., Citation2010). The amounts of runoff generated at a watershed scale were measured by using the river gauge station on the outlet of each micro watershed. A total of 192 samples were collected for sediment loss analysis. These samples were re-bulked into monthly bases to understand the temporal variation of nutrient losses along with sediments and in soluble form. Once sediment samples were collected, they were transported into the laboratory, filtered with Whatman filter paper 42 with 2.5 µm pore diameter, air dried, and weighed to determine the sediment bound nutrient losses (NPK) and organic carbon (). Soil organic carbon was analyzed using Walkley and Black method (Walkley & Black, Citation1934). The NPK of sediment samples were determined by using the methods used for the determination of the NPK of yield samples.
2.4. Methods of data analysis
Discharge and sediment data, and the existing amount of fertilizer used by farmers collected from both micro watersheds were processed and analyzed using Microsoft-excel sheet 2010.
3. Results and discussion
3.1. Nutrient inputs of Kecha and Laguna micro watersheds
Input 1(Inorganic fertilizer): the survey data obtained from the households revealed that 3948.92 kg of DAP and 4766.32 kg of urea were used by farmers at Kecha where the dominated crops were teff, maize and finger millet covering 57.8 ha from the total cultivated land of 223 ha. The total DAP applied in the watershed contains 793 kg P and 710.8 kg N. Similarly, the applied Urea contains 2192 kg N indicating that the farmers in Kecha micro watershed applied 3.55 kg P/ha and 13 kg N/ha. Farmers at Laguna micro watershed used 3591 kg of DAP and 3849 kg of urea for similar crops (covering 38.17 ha) which provide 2417.18 kg N and 721.33 P. This indicates that the farmers in Laguna micro watershed applied 5.59 P/ha and 18.74 kg N/ha. The figures for fertilizer amounts are cumulative quantities for the entire sample and indicate the amount of fertilizer used for one crop season.
Input 2 (Organic Manur): Farmers in the micro watersheds own different kinds of livestock used for different agricultural activities and as a source of food. Based on the survey data, the farmers in Kecha micro watershed were found to have a total number of 88 cattle, 27 donkeys, and 54 goats. Using the conversion factors 0.8 for equines, 0.7 for cattle and 0.1 for goat and sheep (FAO, Citation1993), the TLU values were estimated to be 61.6 cattle, 21.6 equines, 5.4 goats and sheep. This indicates that the Kecha micro watershed was found to have a total of 88.6 TLU. Assuming a dung production of 3.3 kg day−1TLU−1 for cattle, and 2.4 kg day−1 TLU−1 for equines, goats and sheep (Haileslassie et al., Citation2006), the total amounts of dung produced (kg year−1) were calculated to be 74,197.2, 18,921.6 and 4,730.4 for cattle, equines, and sheep and goat, respectively. Assuming that 40% of the calculated dung can be lost due to inaccessibility and for energy consumption (Ministry of Agriculture (MoA), Citation2002), the amounts of net available organic manure which can be returned to the soil was found to be 29,678.88 kg,7,568.64 kg, and 1,892.16 kg for cattle, equines, sheep and goat, respectively. This indicates that 39,139.68 kg of organic manure was returned back to the soil throughout a year. According to Haileslassie et al. (Citation2006), 18.3 g N kg−1, 4.5 g P kg−1and 21.3 g K kg−1 dung−1 can be obtained on dry weight basis. Therefore, the inputs from the applied organic manure were calculated to be 716.25 kg N, 403.31 P2O5 or 176.12 kg P, and 833.67 kg K for Kecha. These values are equivalent to 1.86 kg N ha−1, 0.46 kg P ha−1 or 1.05 P2O5, and 2.17 kg K ha−1.
The survey data revealed that the livestock density (TLU) for the Laguna watershed was found to be 101.3. Using this TLU value, calculations were done to get the amount of organic inputs for the Laguna micro watershed. Based on the calculations made, 66,626.37 kg of dung (81,785.55, 22,425.6 and 6,832.8 for cattle, equines, and sheep and goat, respectively) organic manure was returned to Laguna watershed throughout a year. This revealed that 1,219.26 kg N, 299.81 kg P, and 1,419.14 kg K (3.63 kg N ha−1, 0.89 kg P ha−1 or 2.04 P2O5 and 4.23 kg K ha−1) were the organic manure inputs for the Laguna micro watershed.
Input 3 (atmospheric deposition): The total annual seasonal rainfall in the area was found to be 1518 mm with the mean rainfall of 127 mm/year. Based on this information, the atmospheric deposition for Kecha watershed was calculated as follows:
(N) = 0.14 (127 mm) 1/2 = 8.89 kg
(P) = 0.023 (127 mm) 1/2 = 1.46 kg
(K) = 0.092 (127 mm) 1/2 = 5.84 kg
As the rainfall amounts for the two adjacent micro watersheds were similar, atmospheric deposition for the Laguna watershed was also the same as that of Kecha micro watershed.
Input 4a = 2 + (P-1350) * 0.005 = 2 + (1518 mm—1350) * 0.005 = 2.84 N kg/ha/yr
This value is the same for Kecha and Laguna micro-watersheds.
Input 4b (Biological Nitrogen fixation): in Kecha, nitrogen fixation was taking place by Susbania and lupines covering an area of 29.20 ha. In Laguna micro watershed, only lupines crops were grown on an area of 0.04 ha as crop rotation using residual moisture. Degefu et al. (Citation2011) reported the level of nitrogen fixation to be in the range 500 to 600 kg N/ha/year for Susbania, and 145 to 208 kg N/ha/year for lupine. Accordingly, the total nitrogen depositions of the current study were estimated to be 41.71 kg N/ha/year and 2.1 kg/ha/year for Susbania and lupines, respectively. In general, the input amounts of the two micro watersheds are summarized in .
Table 2. Summary of the inputs for Kecha and Laguna micro-watersheds
The nutrient inputs of Kecha and Laguna () micro watersheds were fertilizers, organic manure, atmospheric deposition, and nitrogen fixation. These inputs as a source of soil fertility were described by Hossner and Juo (Citation1999) and Wolde-meskel et al. (Citation2016). Research reports indicated that most of the Ethiopian soils including the current research area didn’t have potassium deficiency. Application of K as a commercial fertilizer in the country received little attention. This was due to the generalization that Ethiopian soils are believed to contain enough or sufficient quantity of the K nutrient. Such belief has emanated from the research of Murphy (Murphy, Citation1968). The reports by Ethiopian Soils Information System (Ethiopian Soils Information System (EthioSIS), Citation2016) also stated that most of the Ethiopia soils do not have potassium deficiency. So, the farmers in the current study area were not using potassium fertilizers.
While the application of commercial fertilizers is a major source of nitrogen and phosphorus inputs, the applied rates were much lower than that of the national scale nutrient input from urea and DAP of 12.24 kg N ha −1 year−1 and 12.87 kg P ha−1year−1 (Haileslassie et al., Citation2005). Demeke et al. (Citation1998) reported a similar trend of inorganic fertilizer applications across all regional states of Ethiopia. Haileslassie et al. (Citation2005) also stated national estimate of IN2 application rates for all cropping systems to be 29 kg N ha−1 year−1, 7.2 kg P ha−1 year−1 and 34.3 kg K ha−1 year −1. Higher values of Input1 (IN1) and Input 2 (IN2) were observed in the untreated micro watershed (Laguna) than the treated micro watershed. The variation in the amount of IN2 may be due to the differences in the amount of crop cultivation, cropping pattern, livestock management system (open grazing, confined management) and other competing uses of manure (e.g., Household energy). The results indicated that fertilizer application in Kecha micro watershed was lower than the Laguna micro watershed, which might be associated with the conservation practices conducted in the watershed. Higher IN2 values for the Laguna micro watershed were in agreement with higher livestock number and free grassing activity in the area.
3.2. Nutrient outputs of Kecha and Laguna micro watersheds
Both micro watersheds were covered by three major crops namely Maize, teff and finger millet with the respective values of 14.84 ha, 24.73 ha, 18.23 ha for Kecha, and 5.34 ha, 10.95 ha, and 21.88 ha for Laguna (data obtained from the households interviewed). Based on the estimated area, the nutrient losses through the two major paths, with grain (OUT 1) and with straw (OUT2) were determined. The amount of outputs from grains and straws of these major crops are shown in .
Table 3. Average nutrient uptake by grain (output 1) and straw (output 2) for the dominant crops in Kecha and Laguna micro watersheds
The other path through which soil nutrients were lost is leaching, especially for N and K. The impact of this path was not very visible for the loss of P due to the fact that P can’t be easily Leached (FAO, Citation1993). The amounts of N and K losses through leaching were found to be 1.19 kg N ha−1yr−1 and 0.01 kg K ha−1yr−1 for Kecha, and 2.05 kg N ha−1yr−1 and 0.02 kg K ha−1yr−1 for Laguna.
Output4 (Gaseous N losses): According to Roy et al. (Citation2003), nitrogen is more volatile gaseous element as compared to other major macro nutrients (phosphorus and potassium). Accordingly, the gaseous N losses were 3.49 kg ha−1yr−1 for Kecha, and 4.49 kg ha−1yr− 1 for Laguna micro watersheds (). Higher loss of N in the Laguna watershed may be due to the lack of different soil and water conservation and land management practices. Mello et al. (Citation2002) reported that losses of nutrients from soils are affected by soil management practices. For highly erodible soils, conservation tillage can help to improve soil structure and reduce N loss through runoff. Planting a winter cover crop can help to reduce leaching. Cover crops that build soil organic matter may also help to slow the release of N and provide continuous N nutrition to crops. Leaving the soil fallow over the winter months, especially after crops that tend to result in high residual soil N after harvest, will create a high leaching risk environment. Effective irrigation strategies that provide sufficient, but not excessive, water to the crop are an important factor in preventing N loss. Excessive irrigation, especially when applied at inappropriate times (such as after extensive rainfall or after crop uptake has declined), may result in significant N losses due to runoff and/or leaching. These management practices as reduction measures of nitrogen loess were also reported by Walsh et al. (Citation2020).
Table 4. Total losses of NPK and OC (organic carbon) through sediment and water solution from Kecha (K) and Laguna (L) in 2016
Nutrients can also be lost along with the harvested grains and crops (Kiros et al., Citation2014). This was occurred in the current study where much amounts of the nutrients in both micro watersheds were lost. This leads to the nutrient depletion (negative balances) of the watersheds of the present study. Abegaz (Citation2005) stated that limited applications of organic fertilizers like crop residues and manure, and the socioeconomic problems in the application of mineral fertilizer causes lack of nutrients for soils.
Based on the laboratory result, sediment concentration was taken into account and discharge of the watershed was also estimated to quantify annual sediment and related nutrient loss from both micro watersheds (Output 5). Rating curves for sediment (sediment Vs discharge) were estimated for both watersheds ().
Figure 2. Relationship between discharge and sediment concentration at Kecha (left) and Laguna (right) watersheds at a year of 2016
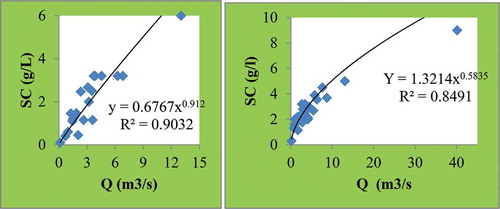
The curves indicated that there were variations between the watersheds in the discharge amount and sediment concentrations. The sediment concentration was increased with the discharge for both watersheds. But the increments in discharge and sediment concentrations were higher for the untreated watershed as compared to the treated. The differences are associated with the presence of biophysical conservation measures in Kecha watershed.
The result is in line with the reports by other authors (Huang & Montgomery, Citation2013; Yang et al., Citation2007). Changes in sediment rating curve over time have been noted for many watershed systems and there is a general assumption that these changes reflect alteration of the erodibility and/or supply of sediment in the watershed, the power of the watershed to erode and transport sediment or the spatial scale of the basin (Asselman, Citation2000).
As depicted in , the NPK losses were higher for the untreated micro watershed (11.66, 7.29, and 77.78) while the respective values were 4.79, 7.08 and 40.48 for the treated watershed. P losses from both watersheds were the least as compared to other nutrients. Marttila and Kløve (Citation2010) noted that such variations in sediment yield among watersheds is expected because of differences in land use, and landscape characteristics such as the slope, topography, soil type, vegetation, and drainage conditions. The fertile soil was highly eroded during high discharge and sediment losses. These findings were similar to the premises of Sharma et al. (Citation2012) who reported that the concentrations of the nutrients in sediments were higher during high rainy seasons. In addition, Alemayehu (Citation2009) stated the availability of easily erodible sediment with the peak discharge indicating that the sediments become ready to be eroded. The loss of NPK and OC in the micro watersheds of this study are mainly associated with inappropriate land use practice such as total removal of crop biomass and frequent cropping of small sized annual crops without adequate external inputs. Higher OC losses from the treated watershed are mainly associated with the tillage practices of the farmers owning the lands in this area. The farmers in the treated area plow their lands repeatedly to grow small seeded crops like wheat and teff before actual sowing of these crops. This causes the available organic matter to be easily eroded/lost through sediments. In addition, organic matter existing on the soil surface as raw plant residues will decay when the land is plowed so many times. If the tillage practices continue after the decay process, the OC will be exposed to loss from the farm. Yeshiwas (Citation2016) stated that the lands for small seeded crops like wheat and teff plots were plowed 7 to 8 times before actual sowing of the crops which exposed the available organic matter to be eroded along with the eroded sediments. Similarly, Swift et al. (Citation2004) and Wardle et al. (Citation2004) reported that measures taken in soil management such as reduced tillage, mulching, composting, manure application, fallowing, agroforestry, diverse rotation, introducing forage legumes and grass mixtures in the rotation cycle are expected to increase the rate of carbon dioxide (CO2) uptake from the atmosphere. Conservation tillage including no tillage (NT) and reduced tillage (RT) has a substantial effect on soil properties and processes compared to conventional tillage (Dyck et al., Citation2016).
As depicted in , high nutrient losses were observed from crop biomass for both micro watersheds followed by nutrient losses through sediments.
Table 5. Summary of the outputs (OUT) for Kecha and Laguna micro watersheds
3.3. Nutrient balances of the two micro watersheds
Negative nutrient balances were obtained for both the treated Kecha micro watershed with the rate of −97.37, −23.66 and −124.75 kg ha−1 yr−1 for N, P and K, respectively, and the untreated Laguna micro watershed with values of −120.81, −20.62 and −130.26 kg ha−1 yr−1 for NPK, respectively ().
Table 6. Nutrient balances in Kecha watershed
Table 7. Nutrient balances in Laguna watershed
The major causes of negative balances for N, P and K were the loss of these nutrients with crop biomass (straw) and along with sediment losses. It is common that the straws and grains in the area with soil conservation practices contain higher amount of nutrient as compared to the nutrient content of the straws and grains obtained from the untreated area. When straws and grains are removed from both watersheds, higher nutrients are lost with the straws and grains removed from the treated area. Therefore, nutrient losses through straw and grain can contribute to the differences of nutrient losses in the two areas. Stoorvogel and Smaling (Citation1990) and Smaling and Fresco (Citation1993) reported that nutrient losses through crops, erosion, leaching, and N volatilization, which only partially compensated by crop residues left on the field, manure and fertilizer application, and atmospheric inputs, caused negative annual NPK balances of 22–26 kg N, 6–7 kg P2O5, 18–23 kg K2O ha−1 from 1983 to 2000. However, the negative values obtained in this study were much higher than the nutrient balances reported by the above scholars. The variations may be due to the differences in land management practices, soil conditions as well as landscape positions. In the current study, Phosphorus losses along with sediments were relatively low due to fixation since the soil was acidic in both micro watersheds (Mekonin, Citation2016). The study by Verbist et al. (Citation2010) indicated that soil acidity can affect the availability of phosphorus.
As compared to the treated watershed (Kecha), losses were figuratively severed for the untreated watershed (Laguna) especially for the nutrients N and K. While removal of crop residue seemed to be the major reason for the negative balances of K, losses along with grain harvest were the main reason for the negative nutrient balances of N and P in both watersheds. From the total outputs, 96.7% of N, 96.9% of P and 80.8% of K were lost through the removal of crop residues in Kecha watershed. In Laguna watershed, nutrient losses through the removal of crop residue were 90.4%, 86.3% and 67.2% for N, P and K, respectively. The results obtained in this study indicated that nutrient losses along with sediment losses were lower in Kecha than Laguna watershed () which might be due to the impacts of the massive soil and water conservation works in the Kecha watershed.
Comparing the total nutrient export of the two micro watersheds, Laguna (untreated) watershed had more nutrients losses. The highest negative nutrient balance values of the untreated watershed verified that an integrated land management, especially soil and water conservation activities are indispensable to the highest rainfall with rugged topography of the Ethiopian highlands. The negative nutrient balance in the treated (Kecha) watershed implied that the watershed still needs some restoration and rehabilitation of the SWC structures. In general, the findings of this study call the demand of an integrated nutrient management strategy for the cultivated highlands of northwestern Ethiopia. These include leaving residues on the farmland, intensifying organic inputs and inorganic fertilizer inputs.
4. Conclusions
The study was conducted to assess the effects of land management on soil fertility and nutrient balance in Kecha and Laguna micro watersheds found in Amhara Region, North western Ethiopia. The study indicated that the nutrient balances for the nutrients NPK were negative for both micro watersheds with the respective values of −97.37, −23.66 and −124.75 for the treated Kecha micro watershed, and −120.81, −20.62, and −130.26 for the untreated Laguna micro watershed. Even though the nutrient balances were negative in both watersheds, the negative values were higher in the untreated Laguna watershed as compared to the nutrient balance values for the treated Kecha watershed. The impacts of land management were, therefore, visible although the magnitudes of the nutrient balances were negative.
The two major paths of nutrient losses in both micro watersheds were crop removal and losses along with soil erosion which account 60% of the total losses. This revealed that reducing complete removal of crop biomass and soil erosion in the area could contribute a lot in narrowing down the negative balances and ensure sustainable crop production and livelihood in the area. Higher sediment losses in the Laguna micro watershed as compared to Kecha could be an indicator of the effects of the soil water conservation measures which provide less sediment and nutrient loss in the latter. Therefore, sustainable land management practices including SWC measures should be properly implemented. Legumes have roles in nitrogen fixation; therefore, farmers in both micro watersheds should plant leguminous plants, practice crop rotation and construct improved biological and physical conservation structures. These can reduce fertilizer demands of crops and saves more demands of hard currency.
Additional information
Funding
Notes on contributors
Mekuanint Lewoyehu
Mekuanint Lewoyehu is a full time Lecturer in Analytical Chemistry in the Department of Chemistry, Bahir Dar University, Ethiopia. He obtained BSc. degree in Chemistry in 2014 from Adama Science and Technology University, MSc in Analytical Chemistry in 2018 from Bahir Dar University. Currently, he is working as a lecturer and doing research in Chemistry Department, Bahir Dar University, Ethiopia. Mekuanint Lewoyehu’s research area focuses on the chemistry of food and Agricultural products including soil chemistry. He works on physicochemical parameters, antioxidant and antibacterial activities of honey samples from different regions in Ethiopia, and the analytical methods used to analyze these honey quality parameters. He also works on assessment of the level of heavy metals and other environmental pollutants in the effluent discharges of different industries, Electrochemistry and on Nanotechnology as well.
References
- Abegaz, A. (2005). Farm management in mixed crop-livestock systems in the Northern Highlands of Ethiopia (No. 70). Wageningen University and Research Centre.
- Alemayehu, A. (2009). Ethiopian organic forum: Public private partnership. In Forum organized by ministry of 2009.
- Alfred, E. H., & Tom, V. Z. (2008). Land cover change and soil fertility decline in tropical regions. Turkish Journal of Agriculture and Forestry, 32(3), 195–16.
- Asselman, N. E. M. (2000). Fitting and interpretation of sediment rating curves. Journal of Hydrology, 234(3–4), 228–248. https://doi.org/10.1016/S0022-1694(00)00253-5
- Bindraban, P. S., Stoorvogel, J. J., Jansen, D. M., Vlaming, J., & Groot, J. J. R. (2000). Land quality indicators for sustainable land management: Proposed method for yield gap and soil nutrient balance. Agriculture, Ecosystems & Environment, 81(2), 103–112. https://doi.org/10.1016/S0167-8809(00)00184-5
- Boli Baboule, Z. (1996). Fonctionnement des sols sableux et optimisation des pratiques culturales enzone soudanienne humide du Nord-Cameroun [Thèse de doctorat en Sciences de la Terre]. ORSTOM. 25.
- Bouchez, J., Metivier, F., Lupker, M., Maurice, L., Perez, M., Gaillardet, J., & France‐Lanord, C. (2011). Prediction of depth‐integrated fluxes of suspended sediment in the Amazon River: Particle aggregation as a complicating factor. Hydrological Processes, 25(5), 778–794. https://doi.org/10.1002/hyp.7868
- Cobo, J. G., Dercon, G., & Cadisch, G. (2010). Nutrient balances in African land use systems across different spatial scales: A review of approaches, challenges and progress. Agriculture, Ecosystems & Environment, 136(1–2), 1–15. https://doi.org/10.1016/j.agee.2009.11.006
- Costa, J. L., Aparicio, V., & Cerdà, A. (2015). Soil physical quality changes under different management systems after 10 years in the Argentine humid pampa. Solid Earth, 6(1), 361–371. https://doi.org/10.5194/se-6-361–2015
- Dagnachew, M., Moges, A., Kebede, A., & Abebe, A. (2020). Effects of soil and water conservation measures on soil quality indicators”: The case of Geshy subcatchment, Gojeb river catchment, Ethiopia. Applied and Environmental Soil Science, 2020, 16. https://doi.org/10.1155/2020/1868792
- De Jager, A. D., Nandwa, S. M., & Okoth, P. F. (1998). Monitoring nutrient flows and economic performance in African farming systems (NUTMON): I. Concepts and methodologies. Agriculture, Ecosystems & Environment, 71(1–3), 37–48. https://doi.org/10.1016/S0167-8809(98)00130-3
- Degefu, T., Wolde-meskel, E., & Frostegard, A. (2011). Multilocus sequence analyses reveal several unnamed Mesorhizobium genospecies nodulating Acacia species and Sesbania sesban trees in Southern regions of Ethiopia. Systematic and Applied Microbiology, 34(3), 216–226. https://doi.org/10.1016/j.syapm.2010.09.006
- Demeke, M., Kelly, V. A., Jayne, T. S., Said, A., Vallee, L., & Chen, H. (1998). Agricultural market performance and determinants of fertilizer use in Ethiopia (No. 1093-2016-87936). Ethiopian Development Research Institute, Addis Ababa, Ethiopia.
- Dobermann, A., & Cassman, K. G. (2002). Plant nutrient management for enhanced productivity in intensive grain production systems of the United States and Asian. Plant and Soil, 247(1), 153–175. https://doi.org/10.1023/A:1021197525875
- Dyck, M., Malhi, S. S., Nyborg, M., & Puurveen, D. (2016). Effects of short-term tillage of a long-term no-till land on crop yield and nutrient uptake in two contrasting soil types. Sustainable Agriculture Research, 5(3), 32.http://dx.doi.org/10.5539/sar.v5n3p32
- Ehabe, E. E., Bidzanga, N. L., Mba, C., Njukeng, J. N., de Barros, I., & Enjalric, F. (2010). Nutrient flows in perennial crop-based farming systems in the humid forests of Cameroon. American Journal of Plant Sciences, 1(1), 38–46. https://doi.org/10.4236/ajps.2010.11006
- Ethiopian Soils Information System (EthioSIS). (2016). Towards improved fertilizer recommendations in Ethiopia nutrient indices for categorization of fertilizer blends from Ethio SIS woreda soil inventory data.
- FAO, F. (1993). Agriculture Organization of the United Nations. 1996. Agricultural Food and Nutrition in Africa. Food and Agricultural Organization of United Nations 85–90.
- Gachimbi, L. N., Van Keulen, H., Thuranira, E. G., Karuku, A. M., De Jager, A., Nguluu, S., & Nandwa, S. M. (2005). Nutrient balances at farm level in Machakos (Kenya), using a participatory nutrient monitoring (NUTMON) approach. Land Use Policy, 22(1), 13–22. https://doi.org/10.1016/j.landusepol.2003.07.002
- Giller, K. E., Cadisch, G., Ehaliotis, C., Adams, E., Sakala, W. D., & Mafongoya, P. L. (1997). Building soil nitrogen capital in Africa. Replenishing Soil Fertility in Africa, 51, 151–192.
- Gruhn, P., Goletti, F., & Yudelman, M. (2000). Integrated nutrient management, soil fertility, and sustainable agriculture: Current issues and future challenges. The International Food Policy Research Institute. 2033 K street,N.W.Washington,D.C. 20006 U.S.A.
- Guzman, C. D., Tilahun, S. A., Zegeye, A. D., & Steenhuis, T. S. (2013). Suspended sediment concentration discharge relationships in the (sub humid Ethiopian highlands. Hydrology & Earth System Sciences, 17(3), 3. https://doi.org/10.5194/hess-17-1067-2013
- Haileslassie, A., Peden, D., Negash, F., & Gidyelew, T. (2006). Sediment sources and sinks in the Gumera watershed, Ethiopia: Implications for livestock water productivity in the Nile River Basin. In Proceeding of international conference on the role of the River Nile in poverty reduction and economic development in the region, November 30-December 2,United Nations Conference Center, Addis Ababa,Part II, 156–164.
- Haileslassie, A., Priess, J., Veldkamp, E., Teketay, D., & Lesschen, J. P. (2005). Assessment of soil nutrient depletion and its spatial variability on smallholders’ mixed farming systems in Ethiopia using partial versus full nutrient balances. Agriculture, Ecosystems & Environment, 108(1), 1–16. https://doi.org/10.1016/j.agee.2004.12.010
- Harmand, J. M., Njitti, C. F., Bernard Reversat, F., Feller, C., & Oliver, R. (2000). Variations de stockde carbone dans le sol au cours du cycle jachère arborée culture, Zone soudanienne du Cameroun, in La Jachère en Afrique Tropicale (pp. 706–713). J. Libbey, Eurotext.
- Harris, T., & Consulting, T. H. (2014). Africa agriculture status report 2014: Climate change and smallholder agriculture in Sub-Saharan Africa (No. BOOK). Alliance for a Green Revolution in Africa (AGRA).
- Hartemink, A. E. (2006). Assessing soil fertility decline in the tropics using soil chemical data. Advances in Agronomy, 89, 179–225. doi:10.1016/S0065-2113(05)89004-2
- Hawando, T. (1997). Desertification in Ethiopian highlands Ralareport No. 200. In International Workshop of Rangeland Desertification, September 16-19, Iceland, 75–86.
- Henao, J., & Baanante, C. A. (1999). Nutrient depletion in the agricultural soils of Africa (No. 62). International Food Policy Research Institute (IFPRI).
- Hossner, L. R., & Juo, A. S. (1999). Soil nutrient management for sustained food crop production in upland farming systems in the tropics (pp. 18). Food and Fertilizer Technology Center.
- Huang, M. Y. F., & Montgomery, D. R. (2013). Altered regional sediment transport regime after a large typhoon, southern Taiwan. Geology, 41(12), 1223–1226. https://doi.org/10.1130/G34826.1
- Kiros, G., Haile, M., & Gebresamuel, G. (2014). Assessing the input and output flows and nutrients balance analysis at catchment level in Northern Ethiopia. Journal of Soil Science and Environmental Management, 5(1), 1–12. https://.org/10.5897/JSSEM13.0398
- Kjeldahl, J. (1883). ”Neue Methode zur Bestimmung des Stickstoffs in organischen Körpern” (New method for the determination of nitrogen in organic substances). Zeitschrift für analytische Chemie, 22(1), 366–383. https://doi.org/10.1007/BF01338151
- Lemenih, M. (2014). Effects of land use changes on soil quality and native flora degradation and restoration in the highlands of Ethiopia. Implications for sustainable land management, PhD thesis, Swedish University of Agricultural Sciences.
- Lesschen, J. P., Stoorvogel, J. J., Smaling, E. M. A., Heuvelink, G. B. M., & Veldkamp, A. (2007). A spatially explicit methodology to quantify soil nutrient balances and their uncertainties at the national level. Nutrient Cycling in Agroecosystems, 78(2), 111–131. https://doi.org/10.1007/s10705-006-9078-y
- Lynam, J. K., Nandwa, S. M., & Smaling, E. M. A. (1998). Nutrient balances as indicators of productivity and sustainability in Sub-Saharan African agriculture: Introduction’. Agriculture, Ecosystems & Environment, 71(1/3), 1–4. http://www.sciencedirect.com/science/journal/01678809/71/1-3
- Marttila, H., & Kløve, B. (2010). Dynamics of erosion and suspended sediment transport from drained peatland forestry. Journal of Hydrology, 388(3–4), 414–425. https://doi.org/10.1016/j.jhydrol.2010.05.026
- Mehlich, A. (1984). Mehlich 3 soil test extractant: A modification of Mehlich 2 extractant. Communications in Soil Science and Plant Analysis, 15(12), 1409–1416. https://doi.org/10.1080/00103628409367568
- Mekonen, G., (2016). Report on Land management to mitigate erosion in the upper Blue Nile Basin.
- Mello, L. V., de Groot, B. L., Li, S., & Jedrzejas, M. J. (2002). Structure and flexibility of streptococcus agalactiaehyaluronate lyase complex with its substrate insights into the mechanism of processive degradation of hyaluronan. Journal of Biological Chemistry, 277(39), 36678–36688. https://doi.org/10.1074/jbc.M205140200
- MoA (Ministry of Agriculture). (2002). Woody biomass inventory and strategic planning project report. Ministry of Agriculture.
- Murphy, H. F. (1968). A report on fertility status and other data on some soils of Ethiopia. Experimental station bulletin no. 44. Hailesilassie College of Agriculture, Oklahoma State University.
- Olsen, S. R. (1954). Estimation of available phosphorus in soils by extraction with sodium bicarbonate (No. 939). US Department of Agriculture.
- Onduru, D. D., De Jager, A., Muchena, F. N., Gachimbi, L., & Gachini, G. N. (2007). Socio-economic factors, soil fertility management and cropping practices in mixed farming systems of sub-Saharan Africa: A study in Kiambu, central highlands of Kenya. International Journal of Agricultural Research, 2(5), 426–439. https://doi.org/10.3923/ijar.2007.426.439
- Perkins, J., Reed, M., Akanyang, L., Atlhopheng, J., Chanda, R., Magole, L., Mphinyane, W., Mulale, K., Sebego, R., Fleskens, L., Irvine, B., & Kirkby, M. (2013). Making land management more sustainable: Experience implementing a new methodological framework in Botswana. Land Degradation and Development, 24(5), 463–477. http://dx.org/10.1002/ldr.1142
- Roy, R. N., Misra, R. V., Lesschen, J. P., & Smaling, E. M. (2003). Assessment of soil nutrient balance. Approaches and Methodologies, FAO Fertilizer and Plant Nutrition Bulletin, 14,101.
- Selassie, G. Y., Anemut, F., & Addisu, S. (2015). The effects of land use types, management practices and slope classes on selected soil physico-chemical properties in Zikre watershed, North Western Ethiopia. Environmental Systems Research, 4(1), 7. https://doi.org/10.1186/s40068-015-0027-0
- Sharma, K. L., Mandal, U. K., Prasad, J. V. N. S., Reddy, B. S., Narsimlu, B., Saikia, U. S., & Venkatravamma, K. (2012). Nutrient losses by runoff and sediment from an agricultural field in semi-arid tropical India. Indian Journal of Dryland Agricultural Research and Development, 27(1), 1–9.
- Sheldrick, W. F., & Lingard, J. (2004). The use of nutrient audits to determine nutrient balances in Africa. Food Policy, 29(1), 61–98. https://doi.org/10.1016/j.foodpol.2004.01.004
- Sheldrick, W. F., Syers, J. K., & Lingard, J. (2003). Soil nutrient audits for China to estimate nutrient balances and output/input relationships. Agriculture, Ecosystems & Environment, 94(3), 341–354. https://doi.org/10.1016/S0167-8809(02)00038-5
- Smaling, E. M. A., & Fresco, L. O. (1993). A decision-support model for monitoring nutrient balances under agricultural land use (NUTMON). Geoderma, 60(1–4), 235–256. https://doi.org/10.1016/0016-7061(93)90029-K
- Sparovek, G., & Schnug, E. (2001). Temporal erosion‐induced soil degradation and yield loss. Soil Science Society of America Journal, 65(5), 1479–1486. https://doi.org/10.2136/sssaj2001.6551479x
- Stoorvogel, J. J., & Smaling, E. M. A. (1990). Assessment of soil nutrient depletion in Sub-Saharan Africa: 1983-2000 (Vol. 1). Winand Staring Centre.
- Swift, M. J., Izac, A. M. N., & van Noordwijk, M. (2004). Biodiversity and ecosystem services in agricultural landscapes are we asking the right questions? Agriculture. Agriculture, Ecosystems & Environment, 104(1), 113–134. https://doi.org/10.1016/j.agee.2004.01.013
- Tabi, F. O., Bitondo, D., Yinda, G. S., Kengmegne, S. S. A., & Ngoucheme, M. (2013). Effect of long-term integrated soil fertility management by local farmers on nutrient status of a Typic Dystrandept under potato-based cropping system. International Research Journal of Agricultural Science and Soil Science, 3(4), 134–140.
- Van Leeuwen, J. P., Lehtinen, T., Lair, G. J., Bloem, J., Hemerik, L., Ragnarsdóttir, K. V., Gísladóttir, G., Newton, J. S., & de Ruiter, P. C. (2015). An ecosystem approach to assess soil quality in organically and conventionally managed farms in Iceland and Austria. Soil, 1(1), 83–101. https://doi.org/10.5194/soil-1-83-2015
- Vanmaercke, M., Zenebe, A., Poesen, J., Nyssen, J., Verstraeten, G., & Deckers, J. (2010). Sediment dynamics and the role of flash floods in sediment export from medium-sized catchments: A case study from the semi-arid tropical highlands in northern Ethiopia. Journal of Soils and Sediments, 10(4), 611–627. https://doi.org/10.1007/s11368-010-0203-9
- Verbist, B., Poesen, J., van Noordwijk, M., Suprayogo, D., Agus, F., & Deckers, J. (2010). Factors affecting soil loss at plot scale and sediment yield at catchment scale in a tropical volcanic agroforestry landscape. Catena, 80(1), 34–46. https://doi.org/10.1016/j.catena.2009.08.007
- Walaga, C., Egulu, B., Bekunda, M., & Ebanyat, P. (2000). Impact of policy change on soil fertility management in Uganda. In T. Hilhorst & F. M. Muchena (Eds.), Nutrients on the move: Soil fertility dynamics in African farming systems, chapter 2. International Institute for Environment and Development.
- Walkley, A., & Black, I. A. (1934). An examination of the Degtjareff method for determining soil organic matter, and a proposed modification of the chromic acid titration method. Soil Science, 37(1), 29–38. https://doi.org/10.1097/00010694-193401000-00003
- Walsh, O. S., Torrion, J. A., Liang, X., Shafian, S., Yang, R., Belmont, K. M., & McClintick‐Chess, J. R. (2020). Grain yield, quality, and spectral characteristics of wheat grown under varied nitrogen and irrigation. Agrosystems, Geosciences & Environment, 3(1), e20104. https://doi.org/10.1002/agg2.20104
- Wardle, D. A., Bardgett, R. D., Klironomos, J. N., Setala, H., Van der Putten, W. H., & Wall, D. H. (2004). Ecological linkages between aboveground and belowground biota. Science, 304(5677), 1629–1633. https://doi.org/10.1126/science.1094875
- Wolde-meskel, E., Dagne, E. D., & Haile, W. (2016). Response of Sesbania (Sesbania sesban L. Merr.) to inoculation with indigenous isolates of Rhizobium strains. African Journal of Plant Science, 10(7), 136–144. https://doi.org/10.5897/AJPS2016.1406
- Yang, G., Chen, Z., Yu, F., Wang, Z., Zhao, Y., & Wang, Z. (2007). Sediment rating parameters and their implications: Yangtze River, China. Geomorphology, 85(3–4), 166–175. https://doi.org/10.1016/j.geomorph.2006.03.016
- Yantai, G., Chantal, H., John, T. O., Herb, C., Robert, P. Z., Con, A. C., Yining, N., & Lee, P. (2015). Diversifying crop rotations with pulses enhances system productivity. Scientific Reports, 5(1), 14625. https://doi.org/10.1038/srep14625
- Yeshaneh, E., Eder, A., & Blöschl, G. (2014). Temporal variation of suspended sediment transport in the Koga catchment, North Western Ethiopia and environmental implications. Hydrological Processes, 28(24), 5972–5984. https://doi.org/10.1002/hyp.10090
- Yeshiwas, S. (2016). Plant nutrient budget at plot and watershed scale: The case of Guder Watershed, Northwest Ethiopia (Thesis, Bahir Dar University, College of Agriculture and Environmental Sciences).
- Zenebe, A., Vanmaercke, M., Poesen, J., Verstraeten, G., Haregeweyn, N., Haile, M., & Nyssen, J. (2013). Spatial and temporal variability of river flows in the degraded semi arid tropical mountains of northern Ethiopia. Zeitschrift für Geomorphologie, 57(2), 143–169. https://doi.org/10.1127/0372-8854/2012/0080