
Abstract
Land use and Land Cover Changes (LULCC) are a major cause of environmental degradation in Sub-Saharan Africa (SSA) drylands and hence a serious problem to sustainable utilization and development of those lands. Involving communities in their detection and identification can empower and convince them of the importance of adopting practices that minimize their undesirable impacts. In this study, we applied a GIS assisted community participatory approach to detect LULCC, their drivers and effects in the drylands of mid rift valley Kenya. Focus group discussions, key informant and household head interviews were corroborated with three Landsat images for three periods of 1980, 1995 and 2019. Results from community interviews and focus group discussion reported increasing trends in cropland and shrubland, Declining trend were reported in livestock mobility, livestock herd size, forest land and natural grasses. The GIS analysis reported increase of cropland from 370 Ha to 2889 Ha, increase in shrubland by 4.2%, expansion of Lake Baringo by 1.4%, decrease in forest cover by 1.2% and decrease in natural grass pastures by 1.1%. Major driving forces for LULCC were identified as population growth, insecurity caused by cattle rustling, government policies and interventions, poor agricultural practices, drought and climate change. From the outcomes of this study, we recommended government policy strategies and interventions that support adoption of practices that mitigate adverse effects of LULCC including sustainable grazing schemes, rehabilitation of already degraded land, community participation in watershed management and adoption of soil and water conservation measures.
PUBLIC INTEREST STATEMENT
Kenyan drylands are faced with rapid Land Use and Land Cover Change (LULCC) that affect their ability to provide ecosystem services. Driven by factors like population growth, government policies and climate change, LULCC is associated with biodiversity loss and environmental degradation. Identifying LULCC, drivers and impacts provide critical information for developing effective policy strategies to slow and reverse their adverse effects. One of the most used methods for detecting LULCC is remote sensing and Geographic Information System (GIS) which has been criticised for being too top-bottom and needing specialized expertise to do and interpret. Integrating GIS with community participatory methods allow for an in between where researchers can introduce information in a discursive manner while co-opting local knowledge with scientific and practitioner knowledge in detecting and identification of LULCC. Our study suggests government policy strategies and interventions that halts and mitigate the adverse effects of LULCC in Kenyan drylands.
1. Introduction
Trends and effects of Land Use and Cover Change (LULCC) on the fragile and often marginalized Sub Saharan Africa (SSA) drylands ecosystems have been studied widely (Brink & Eva, Citation2009; Hoffman & Vogel, Citation2008; Tappan et al., Citation2016). Driven by multiple and interacting socioeconomic, cultural and biophysical factors, LULCC have become so invasive and when aggregated, they significantly affect key aspects of the ecosystems functioning (Lambin et al., Citation2003; Lambin & Meyfroidt, Citation2011). Drylands account for 43% of Sub-Saharan African terrestrial land and host a 40% of its population (Davies et al., Citation2012). Often characterized by extensive pastoralism in common property regimes, rangeland ecosystems support over a billion livestock herds that include camels, cattle, sheep and goats (Dong et al. 2 011). In Kenya, over 70% of livestock and 90% of the wild game that supports wildlife tourism is found in drylands (Government of Kenya (GOK), Citation2012).
Dryland inhabitants have traditionally used land-management practices that are well adapted to water and pasture scarcity. For instance, households largely engaged in nomadic pastoralism to track grazing and water resources in space and time as a stratagem to help align their livelihoods with seasonal climate variations and mitigate resource fluctuations (Neely et al., Citation2009; Nkedianye et al., Citation2011; Turner et al., Citation2014). Common landownership, traditional governance, customs and taboos enabled flexible and comparative adaption to pastoralists resource fluctuation and created resilient to climate extremes (Burian et al., Citation2019; Smucker & Wisner, Citation2008). The past few decades have recorded decreased nomadic practices, sub-division and privatisation of communally owned land and a marked conversion to agro-pastoralist land-uses (Burian et al., Citation2019; Jones and Thornton, Citation2009). Reasons for the ensuing changes are varied (Lesorogol, Citation2008), but increased population is a precondition to substituting extensive pastoralism with more labor-intensive land management systems (Boyd & Slaymaker, Citation2000). Past studies have often related common dryland resource use and management and pastoralism to overgrazing and subsequently land degradation and underdevelopment (Benjaminsen et al., Citation2006; Hardin Citation1968; Wernersson, Citation2018). Hence, many SSA governments encouraged sedentarization and individualisation of land ownership to modernize agricultural production and ease governing of the far-flung rangelands (Benjaminsen et al., Citation2006; Eriksen & Silva, Citation2009).
The consequences of LULCC depend on system properties like nearness to markets, population growth, government policies and government investment in infrastructures in the drylands. Dryland inhabitants respond to market opportunities with change in enterprises leading to a shift in agricultural production to higher-value production; for instance, from native grazing to intensive crop production or modified pastures with subsequent decline in natural vegetation (Brink & Eva, Citation2009; Hamza & Iyela, Citation2012; Lambin et al., Citation2003; Maitima et al., Citation2009). Population growth accompanied by habitat fragmentation indicates more livestock on smaller plots which may prompt overuse of ecosystem services leading to degradation and reduced drought resilience of the dryland households (Burian et al., Citation2019; B. Shiferaw et al., Citation2014). Government strategies and interventions to decrease degradation through conservation of native vegetation or introduction of new species and technologies have resulted in increased natural vegetation, including native grasslands and new shrubs and grasses (Niedertscheider et al., Citation2012) while in others it has led to loss of indigenous vegetation and grazing areas (Fuchs et al., Citation2015; Meinzen-Dick & Mwangi, Citation2009; Olson et al., Citation2008). Other reported LULCC drivers and consequences are the need to buffer against the risks such as droughts and livestock diseases leading to livelihood diversification (Dong et al., Citation2011; Lind et al., Citation2016; Pender et al., Citation2009) and the desire to access social amenities leading to adoption of partial or permanent settlements (Lambin et al., Citation2003).
The decision to switch to or integrate new land use which in turn influence land cover change is mediated by trade-offs at the household level (Burian et al., Citation2019). A switch to agropastoralism from pure pastoralism might, for instance, increase average yearly farm production but reduce drought resilience and increase inequalities between rich and poor households especially where the use of technology is included (Delgado et al., Citation2018; Lesorogol, Citation2008). The household trade-offs are specific to context and locality and can arguably best be evaluated by the community members themselves (Lesorogol, Citation2008; Burian et al. (Citation2019). Nonetheless, policy decisions are commonly made at the top with little or no community participation (Behnke & Kerven, Citation2013; Burian et al. (Citation2019). Scientific studies might use community knowledge, but even comprehensive assessments may fail to accurately integrate the view of local communities in a LULCC trade-off evaluation (Dietz et al., Citation2009).
Geographic Information System (GIS) paired with Remote Sensing (RS) are commonly used to quantify, map and detect spatial-temporal dynamics of LULCC (Lambin, Citation2003, Rahman et al., Citation2011). The method involves use of satellite data in maps, aerial photographs, written records in addition to ground truthing that involves people interviews (Bruzzone, Citation1997; Conedera et al., Citation2007). Though it is generally agreed that GIS is an effective and robust tool in facilitating geo-spatial information retrieval, analysis, modelling and visualization, conventional GIS came under a barrage of criticism starting in the 1990s (Schuurman, Citation2000; Warf & Sui, Citation2010). The critiques who mostly hailed from human geography criticized GIScience for lacking sufficient engagement with issues of social-cultural context, relations and power and being obsessed with mechanical rationality thus actively bringing back positivism into geographic practice. (Schuurman, Citation2000; Sheppard, Citation2005; Warf & Sui, Citation2010). Over time and in response to these criticisms together with engagement between the GIS scientists, social theorists and humanities scholars, GIS has evolved to include new approaches including critical GIS (Pavlovskaya, Citation2018; Sheppard, Citation2005), participatory GIS (Elwood, Citation2006), qualitative GIS (Cope and Elwood Citation2009), feminist GIS (McLafferty Citation2002; Pavlovskaya, Citation2018), ethnographic and indigenous knowledge GIS (Robbins, Citation2003) and open GIS (Sui, Citation2014). These contemporary forms of GIS, tend to move from positivism and more towards social constructivism, be more context-sensitive and be more issue-driven (Warf & Sui, Citation2010). Putting more emphasis on cooperation and collaboration, contemporary GIS seek more local communities’ participation and accept indigenous forms of knowledge as valid and important sources of information making the approaches more sensitive to issues of access, control and ownership of spatial information (Elwood, Citation2006).
The use of GIS in SSA drylands face challenges of cost, need for expertise, concerns over data rights, access and use of generated information as well as difficulties in understanding the Cartesian methods of spatial representation (Attri et al., Citation2015; Chambers, Citation2006). In addition, LULCC caused by population increase or climatic changes might be a slow process taking years to manifest while in certain places, remote sensing is not possible as land cover phenomena could be obscured by cloud, vegetation or other physical features like hills or shadows (Maphanyane, Citation2018). Kathumo et al. (Citation2015) noted that conventional GIS tend to be a top-down approach to LULCC detection and emphasize the production of spatial data to facilitate official decision-making. Presently, emerging issues in dryland use and management require inclusion of local communities in the decision-making processes that may influence their lives (Adhiambo et al., Citation2017). This need can be addressed through the integration of community participatory methods with GIS and RS. Engaging communities in participatory methods offer opportunities for co-learning and co-construction of knowledge with communities giving the researcher occasion to disseminate certain kinds of scientific knowledge in a discursive and nonformal manner (McCall & Minang, Citation2005).
Several researchers have studied LULCC in SSA drylands. Rembold et al. (Citation2000) used Landsat TM dataset for years 1972 and 1994 to calculate land cover changes in lake regions of central/south Ethiopia, Shalaby and Tateishi (Citation2007) detected types of LULCC in the coastal zone of using Landsat data while Kiage. et al. (Citation2007) used Landsat TM/ETM+ imagery to detect land cover change in the Lake Baringo catchment area. other studies include Alawamy et al. (Citation2020) who analysed Time-Series Landsat Data from 1985 to 2017 to identify LULCC Al-Jabal Al-Akhdar region in Libya; Matlhodi et al. (Citation2019), who evaluated LULCC in the Gaborone Dam Catchment, Botswana, from 1984 to 2015 using GIS and remote sensing and Mekuyie et al. (Citation2018) who used Landsat images, field observations and household interviews to determine the trends of land-use and land-cover changes and their drivers between 1985 and 2015 in Afar region of Ethiopia.
While most of the above studies use GIS coupled with RS, our study-integrated community participatory methods with GIS and RS to capture certain trends in land use including livestock herd size and mobility, crops and livestock diversity which could not be well captured by GIS and RS as well as create awareness on the negative effects of LULCC. According Burian et al. (Citation2019) integrating GIS with community participatory methods can effectively create community awareness on the implications of LULCC while helping decision makers appreciate the socio-economic, political and cultural reality of the local community. This integration can result to participatory learning and innovations that lead to the needed action in halting, slowing down and mitigating negative effects of LULCC including land degradation and loss of bio-diversity (Rambaldi et al., Citation2006). The objective of this study was to use community participatory methods supported by GIS and RS to assess trends, drivers and effects of land use and land cover changes while creating awareness of the effects of LULCC in the Njemps Flats in the Lake Baringo Basin.
2. Materials and methods
2.1. Site description
Our study was conducted in the Southwestern basin of Lake Baringo commonly referred to as the Njemps Flats. The semi-arid rangeland is inhabited by the Il Chamus also called the Njemps a Maa-speaking small indigenous tribe with a population of about 35,000 people (Kenya National Bureau of Statistics (KNBS), Citation2015). The Il Chamus are primarily a pastoralist tribe that has transitioned from nomadic to sedentary and agropastoral livelihoods (Little, Citation2016). Other livelihood activities are, wage labour, fishing, small-scale trading and charcoal burning (Mureithi et al., Citation2015). The poverty incidence in the area is high with 65% of the people living below poverty line (Kenya National Bureau of Statistics (KNBS), Citation2015). The area has a small but growing immigrant population from other parts of Kenya practicing irrigated farming within the wetlands and in the government-sponsored Pekerra irrigation scheme.
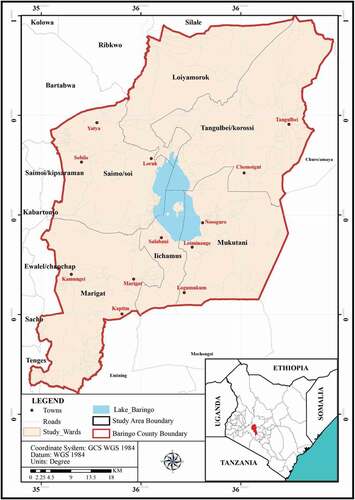
Rainfall received in the area is low and erratic ranging from 300 mm to 700 mm annually spread over two seasons. The dominant soils in the Njemps Flats are generally shallow silt loam to clay loam, with low organic matter (Johansson & Svensson, Citation2002). The main sources of water in the area are rivers Pekerra, Molo and Endao (seasonal), which drain into Lake Baringo. The vegetation in the area is dominated by acacia woodland and the invasive Prosopis juliflora (80%) seasonally flooded grassland (15%), shrub grassland (5%) and the permanent Loboi swamp and covered by Cyperus papyrus (Verdoodt et al., Citation2010). Intensive grazing pressure, highly erodible soils and erratic rainfall, have led to large-scale disappearance of annual and perennial grasses leaving the ground bare and severely degraded particularly during droughts (Mureithi et al., Citation2015). shows Map of the study area.
Figure 1. Map of the study area
2.2. Data collection and analysis
The study sought to assess trends, related drivers and effects of land use and land cover changes in the Njemps. Data were collected through Landsat images, qualitative interviews, gender-segregated focus group discussions and household heads semi-structured interviews between January 2019 and March 2019. Qualitative interviews were held with seven key informants including religious leaders, research representative from Kenya agricultural and livestock research organization, a government agriculture extensionist, a local NGO representative, local headman, a village elder and a local teacher. The informants were interviewed on drivers social, effects and trends of LULCC and this provided a base for the questionnaires for the semi-structured interviews. Four gender-separated focus group discussions were done in the two administrative wards of Mukutani and Il Chamus with residents who had resided in the area for more than 30 years.
The participants discussed the trends, drivers and effects of LULCC in the area. A voting process during the discussion was used to assess the magnitude of change in percentage on the identified LULCC. 150 semi-structured household head interviews were conducted along predefined transect lines using systematic random sampling where the head of every fifth household was interviewed. A semi-structured questionnaire made multiple answers possible and allowed respondents to arrange factors in term of their perceived importance. Interviewees were asked to state the drivers, trends and effects of changes in (i) livestock numbers and mobility (ii) crop growing areas and (iii) vegetation cover during the time of residency in the area. Change detection analysis used Landsat Imageries and administrative boundaries of Baringo county. Landsat images for the three periods 1980, 1995 and 2019 were used and consisted of multispectral data acquired by Landsat satellite. Consequently, QGIS software, version 2.14.19 was used for spatial analysis. Image preprocessing analysis included pan sharpening of Landsat imageries to achieve a 15 m resolution. Further, image classification was done using maximum likelihood algorithm and further determining percentage land use changes over the study periods.
3. Results and discussion
3.1. Household description
The mean age of the household heads interviewed was 43.5 ± 10.95 years and the average time of residency in the area for the household heads was 19.6 years. Only 6% of the household heads had tertiary education, 46% and 26% had primary and secondary education, respectively, while 22% of the responding household heads had no formal education. The sampled households had an average size of 7 ± 3. Though land tenure in the area is designated as communal, most of it has been informally sub-divided and its use has been individualized except for forest and selected watering points along rivers and Lake Baringo. The average household land holding of the sampled households was 1.8 ha ± 0.794 ha. Fifty-eight percent of the household-owned land was under annual crops production. The planted crops included maize, beans, sorghum, millet, green grams, water melons and vegetables with an average crop diversity of three. The households had on average owned 6.5 Tropical Livestock Unit (TLU) with a standard deviation of 5.5 and a livestock diversity of 3.2.
3.2. Land use and cover change
The study results revealed massive land use and cover change in the area in the period between 1980 and 2019. Most of the household heads interviewed (89%) reported having observed land use and cover changes in the area during time of their residence. The average percentage change of the different land use and cover changes was discussed in the focus group discussion and consensus achieved through voting. The land use changes were put into three groupings for the purpose of this study. The categories were; change in practice, change in livestock population and change in land cover.
3.2.1. Change in practice
Major characteristic of changed agricultural practices that were identified during survey and focus group discussion included increase in enclosures and subsequent habitat fragmentation, change in cropping systems in terms of hectarage and diversification and decrease in seasonal migration of livestock in search of pasture.
i. Area Under Crops
The area under crop production, increased significantly with focused group discussants agreeing that it had increased by over 50% since 1980. The main crop types grown in the area changed over time with maize increasing and indigenous crops like millet and sorghum reducing. Majority of the survey respondents (74%) reported increase in crop acreage while 26% reported decrease. The increase in cropland was supported by GIS analysis done for the years 1980, 1995 and 2019 as indicated in
Figure 2. (a) community assessment of change in average household crop land size in acres (b) GIS analysis of change in crop production area from 1980 to 2019 (Source: Study Data)
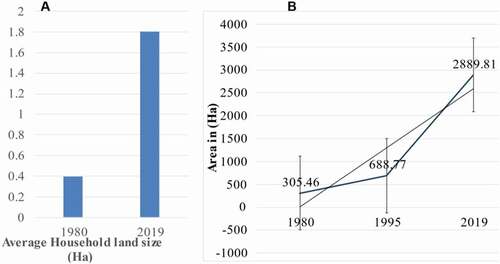
The reasons for increase in acreage and diversification of crops was reported as; (i) trade-off for the decreased household livestock herd size (57%), (ii) bigger and ready market due to expansion of Marigat and Nakuru towns (51%), (iii) improved agricultural knowledge and technology including mechanization (46%) and (iv) increased sedentarisation (34%). Twenty-six percent of the farmers mostly those bordering Lake Baringo in the areas of Salabani and Ngambo reported decrease in crop land caused by the expansion of Lake Baringo. The expansion and flooding of the lake displaced the riparian residents and livestock when the flooding water overtook residential, agricultural and grazing land. Onywere et al. (Citation2014) reported general increase in water levels trend among lakes within the Eastern African Rift Valley between the years 2011 and 2013. In the same period, Lake Baringo area under water extended from 143.6 Km2 in January 2010 to a high of 231.6 Km2 in September 2013 signifying 61.3% net increase in the area under water (Onywere et al., Citation2014). This was also supported by GIS mapping during this study which indicated that the water body expanded from 13,013.6 Ha in 1995 to 16,929.5 Ha reported in 2019.
In general, area under crop land increased at the expense of grassland which is consistent with a study by Food and Agriculture Organization of the United Nations, FAOSTAT database (FAOSTAT) (Citation2013), that decried the decline of grazing lands in Africa from 84 to 78% of agricultural area between 1961 and 2011 (FAOSTAT Database). The decline was cited to be relatively large in Eastern Africa and Western Africa, with declines of 8.88 and 8.59%, respectively (Food and Agriculture Organization of the United Nations, FAOSTAT database (FAOSTAT), Citation2013). Similarly, and in agreement with the study, Brink and Eva (Citation2009) reported agricultural land in East African drylands to have increased massively over the period 1975–2000 by at least 123,413 ha at the expense of forests (71,325 ha) and natural grassland vegetation (58,894 ha). A study done by Wasige et al. (Citation2013), noted land use and land cover changes in Kagera Basin, spanning across Burundi, Rwanda, Uganda, and Tanzania between 1901 and 2010, indicating a decline in savanna natural grassland by 15.4% between 1901 and 2010 while cultivated land increased considerably. In contrast, Niedertscheider et al. (Citation2012) reported expansion of grasslands in 1988 to 2006 with a decline in the cultivated areas in South Africa.
ii. Enclosures
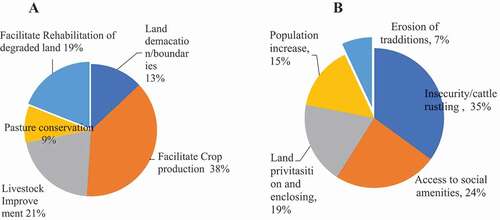
Majority of the household heads interviewed (75%) reported that enclosures had increased while 25% felt that the enclosures had remained the same. Reasons for more establishment of fences included to facilitate crop production (43%), allow pasture conservation (27%), facilitate rehabilitation of degraded land (19%) and to mark boundaries (11%) (). Mureithi et al. (Citation2015) found enclosures to enable livestock improvement, facilitate pasture conservation and generally allow for agricultural diversification which is related to enhanced food security and poverty reduction. In west Pokot, Wairore et al. (Citation2015) noted that enclosing land enabled individuals to properly manage land, fodder and livestock while aiding in combating land degradation. Similar results were recorded by Mekuria et al. (Citation2007) and Beyene (Citation2009) who reported the successful use of enclosures as a management tool livestock and pasture conservation and in restoration of degraded drylands.
Figure 3. (a) Reasons for increase in enclosures. (b) Reasons for decline in nomadism/livestock mobility
iii. Nomadism
Nomadism as a land use type decreased over the years. The FGD discussants conceded that nomadism had declined by over 70% while seventy-eight percent of the survey respondents indicated a decrease and 22% reported no change. presents reasons for decline in nomadism as cited by the respondents. The respondents cited the drivers of sedentarisation as; insecurity (35%), desire to access modern social facilities (24%), move towards privatization of land use and enclosures (19%), population increase (15%) and erosion of customary institutions governing land (7%). Different studies in Kenya showed altered land-holding systems implying sedentarisation, fragmentation and privatization of previously communally owned land as leading to land use and cover changes (Flintan, Citation2011; Government of Kenya (GOK), Citation2012).
Just as in the current study, Kebebew et al. (Citation2001), recorded insecurity as a major contributing factor to loss of livestock mobility in South. The same conclusion was drawn in studies done in Turkana where security concerns were found to drive herding strategies (Pike, Citation2004); in Karamoja, where security was a factor in the decision to move to small towns and urban areas (Stites et al., Citation2014) and in North Eastern Kenya where it was reported as a cause for pastoralist dropouts (Desta et al., Citation2008). Orindi et al. (Citation2007) noted that decreased mobility due to insecurity exacerbates the unsustainable use of the range areas with pastoralists concentrating in areas deemed secure, leaving other pastures unused causing overgrazing and degradation.
3.2.2. Change in livestock population
Data obtained from the baseline survey and supported by focus group discussion indicate that there was significant decline in livestock population between 1975 and 2018. The general declining trend in livestock population as discussed and voted for by the focus group discussants is presented in .
Figure 4. Change in livestock population from1975 to 2018
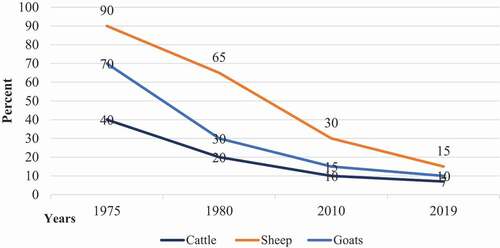
The biggest decline was attributed to the 1978–1980 drought which killed over 50% of livestock in the study area. This is supported by Little (Citation1981), who reported 49% of stock deaths in the 1979–1980 period in the Njemps. Further, Little reported the cattle deaths as related to east coast fever (49%), while 40% were caused by lack of grazing and a further 11% by trypanosomiasis and other diseases while goats’ deaths were majorly attributed to an outbreak of Contagious Caprine Pleuropneumonia (CCPP) between 1978 and 1979. The survey respondents supported the declining trend of livestock population. Majority of the survey respondents agreed to a general decline in livestock (81% for cattle, 72% for goats, 64% for sheep) apart for poultry where 55% indicated an increase. presents the reasons for change in livestock population as reported from the household head interviews.
Table 1. Reasons for change in livestock population
Drought was indicated as the main driver of livestock decline (73%) followed by pests and diseases (61%), Prosopis invasion leading depletion of grass pasture and livestock death (56%) increased family expenses due to children schooling (49%), decrease in nomadism caused by insecurity and privatization of land use (38%) and livestock improvement (25%). Little (Citation1981) noted difficulty in distinguishing drought and disease as discrete causal factors of cattle deaths in ASALs since they are habitually closely related. Poor nutrition caused by drought would usually amplify an animal’s susceptibility to disease, significantly increasing mortality rate particularly where grazing is inadequate. Since the Il Chamus are primarily a pastoralist community and agricultural revenues are mostly generated by livestock keeping and income from off-farm activities is low, decreasing livestock numbers may plunge households especially the poor households and reduce their capacity for self-sustained recovery (Barrett & Swallow, Citation2006; Nyberg et al., Citation2015).
3.2.3. Land cover change
The main land use and land cover changes in the Njemps flats were reported as; increase in shrubs, decrease in trees and decrease in natural grasses. shows land cover change in the study area.
Figure 5. (a) Percent respondents who reported land cover change; (b) GIS analysis on change in area covered by shrubs from1980 to 2019
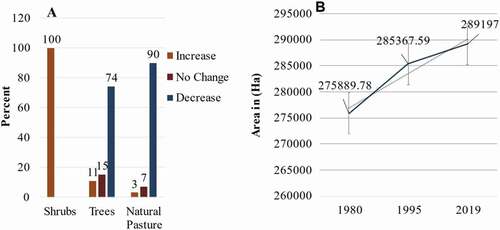
All focus group discussants and survey respondents cited the invasive Prosopis juliflora as the main cause of increase in shrub in the area. The invasive species was introduced in the study area in 1982 as a GoK-FAO intervention against land degradation and desertification. GIS analysis revealed that the area under shrub increased progressively by 15,000 Ha since the introduction of Prosopis in 1982. It was however not possible to separate between the different types of shrubs in the study area from the GIS data and therefore the data was used as a corroboration of the community collected data. (b) presents the GIS analysis on area under shrub since 1980.
The survey respondents identified Prosopis as the main cause of decrease in natural grass pastures (66%) and indigenous trees (48%). In both FGD sessions, the discussants showed awareness of prosopis positive attributes which they cited as fodder for livestock, nectar for honey, wind breaks and provision of wood for construction and charcoal. The discussants reported that before introduction of Prosopis, strong winds would blow off roofs from houses and carry sand that would blind livestock. However, on the negative side, the discussants considered Prosopis to be highly invasive; shading out other plants, eliminating natural grass cover, producing chemicals that causes tooth decay in livestock and causing lameness in livestock and humans through thorn injuries and causing respiratory allergies in humans. Majority of the interview respondents perceived Prosopis as damaging to their livelihoods and called for its total elimination. The study findings are consistent with those of Mwangi and Swallow (Citation2005) and Kahi et al. (Citation2009) who reported Prosopis juliflora as being alellopathic in leading to low biomass production of herbaceous plant species under the prosopis canopies or their total elimination. Mwangi and Swallow (Citation2005) reported elimination of indigenous trees and pasture grasses in the Njemps flats due to Prosopis invasion.
In Ethiopia, agropastoralists were reported to have lost over 700,000 hectares of natural grazing land to prosopis (Admasu, Citation2008) while agropastoralists in Namibia had lost over 26 million hectares to bush encroachment by 2014 (Mlunga & Gschwender, Citation2015). Comparable trends of declining grazing lands were also reported in Burkina Faso, between the years 1975 and 2000, where savanna grasslands declined from 59.8 to 51.6% of the land area, Niger, where grazing lands decreased 16.2%, Togo by 10%, Mauritania by 30%, and in Benin by 10.4% (Tappan et al., Citation2016). Contrarily, to the above trend, a study done in South Africa found grasslands to have increased between 1988 and 2006 mainly due to rehabilitation efforts (Niedertscheider et al., Citation2012) while Brink and Eva (Citation2009) found no significant grassland changes in the Karoo–Namib and Kalahari regions between the years 1975 and 2000.
On forested land, majority of the respondents (74%) reported tree decrease, 15% no change while 11% reported an increase. The decrease in forested area was reported to be a result of charcoal burning (49%) especially after the high court of Kenya in 2008 allowed for charcoal burning to mitigate the adverse impacts of Prosopis juliflora on their livelihoods (Charles Lekuyen Nabori and 9 others versus Attorney General and 3 others (2008) eKLR); invasive Prosopis juliflora due to its aggressiveness and allelopathic effects (32%) and increased droughts (19%). The FGD discussants noted that it was difficult to police which trees were being used for charcoal. Same trend of decrease was observed in natural grassland pastures where 90% of respondents reported a decrease.
Conversion of communal grasslands used for grazing to other forms of land use as reported by this study has led to limited mobility of livestock and has increased grazing pressure of livestock in confined areas. This has adversely impacted the sustenance of the ecosystems, leading to overgrazing and subsequent productivity losses and land degradation. Less grazing areas and less productivity is likely to have negative impacts on incomes as well as increase the vulnerability of rural households to the variable climate and droughts characterizing the area. Davies and Bennett (Citation2007) noted that while crop farming provided an alternative to pastoralism, especially in the areas near Lake Baringo and permanent river Pekerra, conversion of grassland to agriculture rendered communal pastoralists vulnerable to the ecological climate variability of drylands resulting in larger livelihood impacts. Kihiu (Citation2016), noted that opportunity costs of disrupting the traditional operations of drylands are at times overlooked, while the benefits may be overstated. The study results indicate that land use change may have far-reaching side effects on other drivers of rangeland degradation and consequently on rural livelihoods.
3.3. GIS land use and land cover change detection
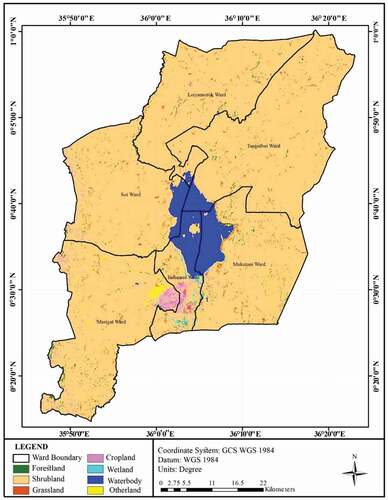
The study also sought to corroborate community data using Landsat satellite images and supported by GIS, to draw a map for land use and cover in the years 1980, 1995 and 2019. show land use and land cover in the study area for the years 1980, 1995 and 2019, respectively, while presents a summary of land use and cover change in the study area from 1980 to 2019.
Figure 6. Land use and land cover in the year 1980
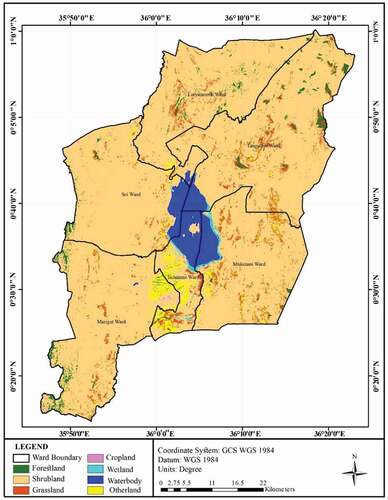
Figure 7. Land use and land cover in the year 1995
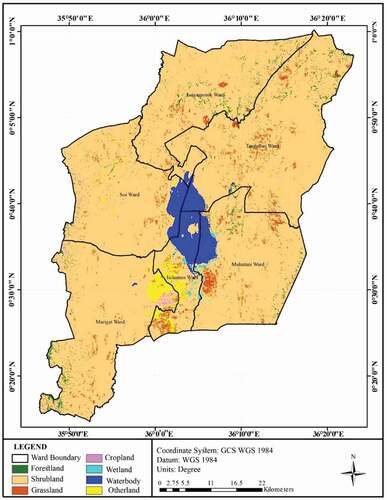
Figure 8. Land use and land cover in the year 2019
3.3.1. Accuracy assessment for land use classification
Classification accuracy indicates the extent to which the resulting image classification conforms to the truth (Foody, Citation2002). As further observed by Foody, two pertinent questions as regards land use mapping accuracy may ensue. First is the extent to which each group in a classification is correctly located in the original map and Second, is whether the boundaries demarcating the groups are validly located. Overall accuracy is determined by dividing the sum of all properly classified pixels found along the central diagonal, by the total number of reference pixels. It shows an overall result of the number of the tabular error matrix. Anderson et al. (Citation1976) suggested that the minimum overall accuracy should not be less than 85%. Comparatively, the overall accuracy for the year 1980, 1995 and 2019 was 98.6, 99.2 and 99.1%, respectively. Further, Kappa Coefficients (Khat) were calculated by comparing the number of pixels in each cell in the confusion matrix with the possibility to distribute pixels as a random variable, thus measures the accuracy for each classification as it accounts for all the elements in the matrix rather than diagonal elements. In the current study, this was attained by measuring the agreement between the classification map and reference data. Results showed 0.83, 0.81, 0.80 for the overall classification of the year 1980, 1995 and 2019, respectively. According to Lea and Curtis (Citation2010) a Kappa statistic greater than 0.8 depicts a strong assessment and good accuracy.
3.3.2. Land use and land cover change detection maps
The spatial analysis of the Landsat maps revealed the following major land use and land covers types; cropland, forest land, shrubland, grassland, wetland/swamp and water body. shows how the mention land uses and covers changed in the periods 1980, 1995 and 2019, respectively.
Based on household survey, focus group discussion and personal observation, the existing land cover in the area included cropland, natural grass land, shrub/bush land and forested land. The 1980 map for land use and cover in the study area (), which acted as a baseline for comparison of land use and cover change for the period between 1980 and 2019 showed that shrubland was the main land cover accounting for 86.6% of the landscape, followed by grassland 4%, forested land (2%), wetland (0.4%) and at crop land (0.2%). In 1995 () shrubland increased by 3% from 275,889.8 Ha to 285,367.6 Ha. This is attributed to the spread of Prosopis juliflora introduced in the area in 1982 by the GoK in collaboration with FAO. Area under Lake Baringo decreased by approximately by 458 Ha between 1980 and 1995. Onyando (Citation2002) and Odada et al. (Citation2006) reported that Lake Baringo area decreased from 219 Km2 in 1976 to 136 Km2 in 1986 then to 114 Km2 in 1995 and 108 Km2 in 2001. Differing from this general trend, a sudden surge in lake levels was noticed between 2011 and 2013 (Onywere et al., Citation2014). Other land covers that decreased included grassland, forested land and wetlands (). Another increase was observed in crop land, which doubled from 370.5 Ha to 788.8 Ha an increase of over 50%. The increase of cropland at the expense of grassland and forested land is a global trend (Food and Agriculture Organization of the United Nations, FAOSTAT database (FAOSTAT), Citation2013).
Table 2. Summary of land use and cover types in the study area between years 1980 to 2019
The 2019 () land use and land cover map showed more growth in shrub land albeit by only a small percentage (1%), expansion of Lake Baringo by 3915.9 Ha (1.4%), decrease in grassland and forested land. Area under wetland didn’t show any significant change. The area under cropland grew significantly from 788.8 Ha to 2889.8 Ha. The farmers near the lake decried the expansion of the lake which they reported as having eaten into their farming land and even displaced some families. presents a summary of land use and cover change in the study area between 1980 and 2019.
The summary shows progressive increase in shrubland at the expense of natural pasture and indigenous trees between the period 1980 to 2019, general expansion of Lake Baringo, and a decrease in wet land. During the same period, crop areas increased by over 50%. The above implies that the increase in the cropped area was mainly from natural grasslands. The expansion of cropped land, the introduction of the invasive Prosopis juliflora, cattle rustling driven insecurity with more sophisticated weapons and land subdivision and fragmentation have been the major driving forces behind land use and land cover changes in this area during the period 1980–2019.
4. Conclusion and policy implications
Changes in land use and land cover influence both land degradation and desertification risk. The results showed decreasing trends in forest land, natural grassland, livestock herd and livestock mobility. In contrast, higher positive increasing trend was reported in cropland, shrubland and land demarcation, fragmentation and enclosing. The inhabitants of the Njemps flats have had to contend with prolonged droughts alternated by floods of the Lake Baringo which has resulted in human displacement, loss of grazing and crop farming land. Initially, herd mobility enabled securing of better access to water and grazing. This is no longer tenable for the inhabitants of the Njemps due to high population growth, land use privatization and increased hostilities between them and their pastoralist neighbours.
As habitat fragmentation increase and forests and natural grassland decrease so does the risk of land degradation with negative effect on livelihoods of the Njemps inhabitants. Hence, adoption of sustainable land management practices should be advanced to prevent undesirable LULCC dynamics in the area. This could include adoption of sustainable grazing schemes, rehabilitation of already degraded land, community participation in watershed management and adoption of soil and water conservation measures. We recommend that government interventions and policies include facilitating adoption of micro-level adaptations and technologies that are location and context-specific, improvement of early warning systems, enabling dryland inhabitants to engage in policy debates, building stronger conflict management institutions and supporting diversification of livelihoods.
Additional information
Funding
Notes on contributors

Rebecca N. Karaya
Rebecca Karaya was born in Kenya. She studied a BSc in agriculture education and extension, MSc in Agriculture Extension from Egerton University. She has done research projects in women group and food security, reduction of post-harvest losses in maize in Arid and Semi-Arid areas in Kenya and rehabilitation of degraded lands in Kenyan drylands. Rebecca is currently a PhD fellow in agriculture and rural innovations in Egerton University and works as a tutorial fellow in Karatina University Kenya. Her research interests include rural innovation systems, sustainable land management and gender in agriculture and rural development.
References
- Adhiambo, M., Kironchi, G., Mureithi, S., & Kathumo, M. (2017). Assessing land use and land cover change using participatory geographical information system (PGIS) approach in Nguruman Sub-catchment, Kajiado north Sub county, Kenya. Journal of Geography and Regional Planning, 10(8), 219–19. https://doi.org/https://doi.org/10.5897/JGRP2016.0606
- Admasu, D. (2008). Invasive plants and food security: The case of Prosopis juliflora in the Afar region of Ethiopia. FARM-Africa, IUCN Available at https:/www.farmafrica.org>downloads.
- Alawamy, J. S., Balasundram, S. K., Hanif, A. H., & Sung, C. B. (2020). Detecting and analyzing land use and land cover changes in the region of Al-Jabal Al-Akhdar, Libya using time-series landsat data from 1985 to 2017. Sustainability, 12(11), 4490. https://doi.org/https://doi.org/10.3390/su12114490
- Anderson, R., Hardy, E., Roach, T., & Witmer, E. (1976). A land use and land cover classification system for use with remote sensor data. Geological Survey Professional Paper 964
- Attri, P., Chaudhry, S., & Sharma, S. (2015). Remote sensing and gis based approach for LULC change detection: A review. International Journal of Current Engineering and Technology, 5(5), 3126–3137. Retrieved from http://inpressico.com/category/ijcet
- Barrett, C. B., & Swallow, B. M. (2006). Fractal poverty traps. World Development, 34(1), 1–15. https://doi.org/https://doi.org/10.1016/j.worlddev.2005.06.008
- Behnke, R., & Kerven, C. (2013). Counting the costs: Replacing pastoralism with irrigated agriculture in the Awash valley, north-eastern Ethiopia (IIED Climate Change Working Paper no. 4). International Institute for Environment and Development.
- Benjaminsen, T. A., Rohde, R., Sjaastad, E., Wisborg, P., & Lebert, T. (2006). Land reform, range ecology, and carrying capacities in Namaqualand. Annals of the Association of American Geographers, 96(3), 524-540. https://doi.org/https://doi.org/10.1111/j.1467-8306.2006.007.x
- Beyene, J. (2009). Exploring incentives for rangeland enclosures among pastoral and agropastoral households in eastern Ethiopia. Global Environmental Change, 19(4), 494–502. https://doi.org/https://doi.org/10.1016/j.gloenvcha.2009.07.002
- Boyd, C., & Slaymaker, T. (2000). Re-examinin the ‘more people, less erosion’ hypotheis:Special case or wider trend? ODI NAtural Resource Perspectives No. 63. Overseas Development Institute.
- Brink, A. B., & Eva, H. D. (2009). Monitoring 25 years of land cover change dynamics in Africa: A sample based remote sensing approach. Applied Geography, 29(4), 501–512. https://doi.org/https://doi.org/10.1016/j.apgeog.2008.10.004
- Bruzzone, L. S. (1997). An iterative technique for the detection of land-cover transitions in multi-temporal remote-sensing images. IEEE Transactions on Geosciences and Remote Sensing, 35(4), 858–867.
- Burian, A., Karaya, R., Wernersson, J. E., Egberth, M., Lokorwa, B., & Nyberg, G. (2019). A community-based evaluation of population growth and agro-pastoralist resilience in Sub-Saharan drylands. Environmental Science & Policy, 92(3), 323–330. https://doi.org/https://doi.org/10.1016/j.envsci.2018.10.021
- Chambers, R. (2006). Participatory mapping and geographic information systems: Whose map? Who is empowered and who disempowered? Who gains and who loses? The Electronic Journal of Information Systems in Developing Countries, 25(1), 1–11. https://doi.org/https://doi.org/10.1002/j.1681-4835.2006.tb00163.x
- Conedera, M., Stefano, V., Christophe, N., Meurer, M., & Krebs, P. (2007). Using toponymy to reconstruct past land use: A case study of ‘Brusada’ (Burn) in Southern Switzerland. Journal of Historical Geography, 33(4), 729–748. https://doi.org/https://doi.org/10.1016/j.jhg.2006.11.002
- Cope, M., and Elwood, S. (eds.). (2009). Qualititive GIS: A mixed methods Approach. Los Angeles, CA. SAGE doi:https://doi.org/10.4135/9780857024541
- Davies, J., & Bennett, R. (2007). Livelihood adaptation to risk: Constraints and opportunities for pastoral development in Ethiopia’s Afar region. The Journal of Development Studies, 43(3), 490–511. https://doi.org/https://doi.org/10.1080/00220380701204422
- Davies, J., Poulsen, L., Schulte-Herbrüggen, B., Mackinnon, K., Crawhall, N., Henwood, W. D., Dudley, N., Smith, J., & Gudka, M. (2012). Conserving dryland biodiversity. International Union for Conservation of Nature.. IUCN. Retrieved from www.iucn.org/publications
- Delgado, C., Rosegrant, M., Steinfeld, H., Ehui, S., & Curbois, C. (2018). Livestock to 2020.The next food revolution. Food, Agriculture and Environment Discussion Paper 28.
- Desta, S., Berhanu, W., Gebru, G., & Amosha, D. (2008). Pastoral drop-out study in selected weredas of Borana Zone, Oromia Regional State. Care International in Ethiopia.
- Dietz, A. J., Gunning, J. W., Bos, A. K., & Zuiderwijk, A. (2009). Optimistic determinism or explaining a miracle. In F. Zaal & K. Burger (Eds.), Sustainable land management in the tropics: Explaining the miracle (pp. 1–20). Ashagte Publishing.
- Dong, S., Wen, L., Liu, S., Zhang, X., Lassoie, J., Yi, S., Li, X., Li, J., & Li, Y. (2011). Vulnerability of worldwide pastoralism to global changes and interdisciplinary strategies for sustainable pastoralism. Ecology and Society, 16(2), 10. https://doi.org/https://doi.org/10.5751/ES-04093-160210
- Elwood, S. (2006). Critical issues in participatory GIS: Deconstructions, reconstructions, and new research directions. Transactions in GIS, 10(5), 693–708. https://doi.org/https://doi.org/10.1111/j.1467-9671.2006.01023.x
- Eriksen, S., & Silva, J. A. (2009). The vulnerability context of a savanna area in Mozambique: Household drought coping strategies and responses to economic change. Environmental Science & Policy, 12(1), 33–52. https://doi.org/https://doi.org/10.1016/j.envsci.2008.10.007
- FAOSTAT. (2008). Agricultural statistics. http://faostat.fao.org/
- Flintan, F. (2011). Broken lands: Broken lives? Causes, processes and impacts of landfragmentationin the rangelands of Ethiopia, Kenya and Uganda. Regional Learning and Advocacy Programme (REGLAP).
- Food and Agriculture Organization of the United Nations, FAOSTAT database (FAOSTAT). (2013). http://faostat3.fao.org/home/E
- Foody, M. (2002). Status of land cover classification accuracy assessment. Remote Sensing of Environment, 80(2002), 185–201.
- Fuchs, R., Herold, M., Verburg, P. H., Clevers, J. G., & Eberle, J. (2015). Gross changes in reconstructions of historic land cover/use for Europe between 1900 and 2010. Global Change Biology, 21(1), 299–313. https://doi.org/https://doi.org/10.1111/gcb.12714
- Government of Kenya (GOK). (2012). Sessional Paper No. 8 of 2012 on National Policy for the Sustainable Development of Northern Kenya and Other Arid Lands. Ministry of State for Development of Northern Kenya and Other Arid Lands.
- Hamza, I. A., & Iyela, A. (2012). Land use pattern, climate change, and its implication for food security inEthiopia: Review. Ethiopia Journal of Environmental Study and Management, 5(1), 26-31. DOI:https://doi.org/10.4314/ejesm.v5i.4
- Hardin, G. (1968). The Tragedy of the Commons. Science 162, 1243–1248. doi:https://doi.org/10.1126/science.162.3859.1243
- Hoffman, T., & Vogel, C. (2008). Climate change impacts on African Rangelands. Rangelands, 30(3), 12–17. https://doi.org/https://doi.org/10.2111/1551-501X(2008)30[12:CCIOAR]2.0.CO;2
- Johansson, J., & Svensson, J. (2002). Land degradation in the semi-arid catchment of lake Baringo, Kenya. A minor field study of physical causes with- a Socio-economic aspect. Earth Sciences Centre Göteborg University.
- Jones, P. G., & Thornton, P. K. (2009). Croppers to livestock keepers: livelihood transitions to 2050 in Africa due to climate change. Environ. Sci. Policy 12, 427–437. doi:https://doi.org/10.1016/j.envsci.2008.08.006
- Kahi, C. H., Ngugi, R. K., Mureithi, S. M., & Ng’ethe, J. C. (2009). The canopy effects of Prosopis Juliflora (Dc.) and Acacia Tortilis (Hayne) trees on herbaceous plants species and soil physico-chemical properties in Njemps Flats, Kenya. Tropical and Subtropical Agro-ecosystems, 10(2009), 441–449. http://erepository.uobi.ac.ke:8080/xmlui/handle/123456789/11788
- Kathumo, M., Gachene, K., Okello, J., Ngigi, M., & Miruka, M. (2015). Is lower Tana River Forest complex and ecosystem under threat of total destruction? Evidence from participatory GIS. In Z. Khalif, K. Gachene, P. Gicheru, M. Mburu, & G. Gakahu (Eds.), Sustainable land management in dry lands of Kenya; Improving land productivity through participatory research and technology transfer. United Nations Development Programme (pp. 13-35).
- Kebebew, F., Dsegaye, D., & Synnevag, G. (2001). Traditional coping strategies of the Afar and Borana pastoralists in response to drought. Drylands Coordination Group Report No. 17. As, Norway.
- Kenya National Bureau of Statistics (KNBS). (2015). The 2014 Kenya demographic and health survey. www.knbs.or.ke.
- Kiage., L. M., Liu, B. K., Walker, N. D., Lam, N., & Huh, O. K. (2007). Recent land‐cover/use change associated with land degradation in the Lake Baringo catchment, Kenya, East Africa: Evidence from Landsat TM and ETM+. International Journal of Remote Sensing, 28(19), 4285–4309. https://doi.org/https://doi.org/10.1080/01431160701241753
- Kihiu, N. E. (2016). Pastoral practices, economics, and institutions of sustainable rangeland management in Kenya [PhD Thesis]. University of Bonn.
- Lambin, E. F., Geist, H. J., & Lepers, E. (2003). Dynamics of land-use and land-cover change in tropical regions. Annual Review of Environment and Resources, 28(1), 205–241. https://doi.org/https://doi.org/10.1146/annurev.energy.28.050302.105459
- Lambin, E. F., & Meyfroidt, P. (2011). Global land use change, economic globalization, and the looming land scarcity. Proceedings of the National Academy of Sciences, 108(9), 3465–3472. https://doi.org/https://doi.org/10.1073/pnas.1100480108
- Lea, C., & Curtis, C. (2010). Thematic accuracy assessment procedures: National Park service vegetation inventory, version 2.0. Natural Resource Report NPS/2010/NRR 2010/204. National Park Service.
- Lesorogol, C. K. (2008). Land privatization and pastoralist well-being in Kenya. Development and Change, 39(2), 309–331. https://doi.org/https://doi.org/10.1111/j.1467-7660.2007.00481.x
- Lind, J., Wheeler, R., & Kohnstamm, R. (2016). Changes in the drylands of Eastern Africa: A review of evidence and data and their implications for efforts to strengthening resilience. Institute of Development Studies University of Sussex
- Little, P. D. (1981). The effects of increased crop production on livestock investments in a semi-arid area: Some examples from Baringo District, Kenya. Working Paper No. 386. Institute for Development Studies, University of Nairobi.
- Little, P. D. (2016). A victory in theory, loss in practice: Struggles for political representation in the Lake Baringo-Bogoria Basin, Kenya. Journal of Eastern African Studies, 10:1. 189–207. doi:https://doi.org/10.1080/17531055.2016.1138665
- Maitima, J. M., Mugatha, S. M., Reid, R. S., Gachimbi, L. N., Majule, A., Lyaruu, H., & Mugisha, S. (2009). The linkages between land use change, land degradation and biodiversity across East Africa. African Journal of Environmental Science and Technology, 3(10), 310-325. Retrieved from http://www.academicjournals.org/AJEST
- Maphanyane, J. G. (2018). Reconstruction of historical landscapes: An alternative approach to monitor land cover change. IST-Africa 2018 Conference Proceedings Paul Cunningham and Miriam Cunningham (Eds) IIMC International Information Management Corporation, 2018.
- Matlhodi, B., Kenabatho, P. K., Parida, B. P., & Maphanyane, J. G. (2019). Evaluating land use and land cover change in the Gaborone Dam Catchment, Botswana, from 1984–2015 using GIS and remote sensing. Sustainability, 11(19), 5174. https://doi.org/https://doi.org/10.3390/su11195174
- Mc Lafferty, S. L. (2002). Mapping Women's Worlds: Knowledge, power and the bounds of GIS. Gender, Place & Culture, 9(3), 263–269. doi:https://doi.org/10.1080/0966369022000003879
- McCall, M. K., & Minang, P. A. (2005). Assessing participatory GIS for community-based natural resource management: Claiming community forests in Cameroon. The Geographical Journal, 171(4), 340–356. https://doi.org/https://doi.org/10.1111/j.1475-4959.2005.00173.x
- Meinzen-Dick, R., & Mwangi, E. (2009). Cutting the web of interests: Pitfalls of formalizing property rights. Land Use Policy, 26(1), 36–43. https://doi.org/https://doi.org/10.1016/j.landusepol.2007.06.003
- Mekuria, W., Veldkamp, E., Haile, M., Nyssen, J., Muys, B., & Gebrehiwot, K. (2007). Effectiveness of exclosures to restore degraded soils as a result of overgrazing in Tigray, Ethiopia. Journal of Arid Environments, 69(2), 270–284. https://doi.org/https://doi.org/10.1016/j.jaridenv.2006.10.009
- Mekuyie, M., Jordaan, A., & Yoseph Melka, Y. (2018). Land-use and land-cover changes and their drivers in rangeland-dependent pastoral communities in the southern Afar Region of Ethiopia. African Journal of Range & Forage Science, 35(1), 33–43. https://doi.org/https://doi.org/10.2989/10220119.2018.1442366
- Mlunga, L., & Gschwender, F. (2015). Bush encroachment, de-bushing and energy production in Namibia. In O. C. Ruppel & B. Althusmann (Eds.), Perspectives on energy security and renewable energies in Sub-Saharan Africa. Practical opportunities and regulatory challenges (pp. 195–202). Macmillan Education Namibia.
- Mureithi, S. M., Verdoodt, A., Gachene, C. K., Njoka, J. T., Wasonga, V. O., De Neve, S., Meyerhoff, E., & Van Ranst, E. (2015). Impact of enclosure management on soil properties and microbial biomass in a restored semi-arid rangeland, Kenya. Journal of Arid Land, 6(5), 561–570. https://doi.org/https://doi.org/10.1007/s40333-014-0065-x
- Mwangi, E., & Swallow, B. (2005). Invasion of Prosopis juliflora and local livelihoods: Case study from the lake Baringo area of Kenya. ICRAF Working Paper – no. 3. Nairobi: World Agroforestry Centre.
- Neely, C., Bunning, S., & Wilkes, A. (2009). Review of evidence on drylands pastoral systems and climate change: Implications and opportunities for mitigation and adaptation. Land and Water Discussion Paper 8. FAO, Rome.
- Niedertscheider, M., Gingrich, S., & Erb, K. H. (2012). Changes in land use in South Africa between 1961 and 2006: An integrated socio-ecological analysis based on the human appropriation of net primary production framework. Regional Environmental Change, 12(4), 715–727. https://doi.org/https://doi.org/10.1007/s10113-012-0285-6
- Nkedianye, D., de Leeuw, J., Ogutu, J. O., Said, M. Y., Saidimu, T. L., Kifugo, S. C., Kaelo, D. S., & Reid, R. S. (2011). Mobility and livestock mortality in communally used pastoral areas: The impact of the 2005-2006 drought on livestock mortality in Maasailand. Pastoralism: Research, Policy and Practice, 1(1), 17. https://doi.org/https://doi.org/10.1186/2041-7136-1-17
- Nyberg, G., Knutsson, P., Ostwald, M., Oborn, I., Wredle, E., Otieno, D. J., Mureithi, S., Mwangi, P., Said, M. Y., & Jirstrom, M. (2015). Enclosures in West Pokot, Kenya: Transforming land, livestock and livelihoods in drylands. Pastoralism, 5(1), 1–12. https://doi.org/https://doi.org/10.1186/s13570-015-0044-7
- Odada, E. O., Onyando, J. O., & Obudho, P. A. (2006). Lake Baringo: Addressing threatened biodiversity and livelihoods. Lakes and Reservoirs: Research and Management, 11(4), 287–299. https://doi.org/https://doi.org/10.1111/j.1440-1770.2006.00309.x
- Olson, J. M., Misana, S., Campbell, D., Mbonile, M., & Mugisha, S. (2008). The spatial patterns and root cause of land use change in East Africa. LUCID Dar es Salaam. 44.
- Onyando, J. O. (2002). Land cover resource maps of Lake Baringo drainage basin. Consultancy report submitted to United Nations Office for Project Services (UNOPS) Nairobi, Kenya.
- Onywere, S., Shisanya C., Obando J., Ndubi A., Masiga D., Irura Z., Mariita N & Maragia H. (2014). Geospatial extent of 2011-2013 flooding from the Eastern African Rift Valley Lakes in Kenya and its implication on the ecosystems. Papers, Kenya Soda Lakes Workshop. Kenya Wildlife Training Institute Naivasha.
- Orindi, V. A., Nyong, A., & Herrero, M. (2007). Pastoral livelihood adaptation to drought and institutional interventions in Kenya. Occasional Paper in Fighting climate change: human solidarity in a divided world. Human Development Report Office, Occasional Paper, 54.
- Pavlovskaya, M. (2018). Critical GIS as a tool for social transformation. Canadian Association of Geographers, 38(11), 2003-2020. https://doi.org/https://doi.org/10.1111/cag.12438
- Pender, J., Mirzabaev, A., & Kato, E. (2009). Economic analysis of sustainable land management options in Central Asia. Final Report for International Food Policy Research Institute.
- Pike, I. L. ( Summer 2004). The biosocial consequences of life on the run: A case study from Turkana District, Kenya. Human Organization, 63(2), 221–235. https://doi.org/https://doi.org/10.17730/humo.63.2.tpa607r9enhl7k1x
- Rahman, A., Kumar, S., Fazal, S., & Siddiqui, M. A. (2011). Assessment of land use/land cover change in the North-West District of Delhi using remote sensing and GIS techniques. Journal of the Indian Society of Remote Sensing, 40(4), 689–697. https://doi.org/https://doi.org/10.1007/s12524-011-0165-4
- Rambaldi, G., Kyem, P. A. K., McCall, M., & Weiner, D. (2006). Participatory spatial information management and communication in developing countries. The Electronic Journal of Information Systems in Developing Countries, 25(1), 1–9. https://doi.org/https://doi.org/10.1002/j.1681-4835.2006.tb00162.x
- Rembold, F., Carnicelli, F., Nori, M., & Ferrari A. (2000). Use of aerial photographs, Landsat TM inagery and multidisplinary field survey for land cover change analysis in the lakes region (Ethiopia). Int J Appl Earth Obs Geo-inf 2(3–4), 181–189
- Robbins, P. (2003). Beyond ground truth: GIS and the environmental knowledge of herders, professional foresters, and other traditional communities. Human Ecology, 31(2), 233–253. https://doi.org/https://doi.org/10.1023/A:1023932829887
- Schuurman, N. (2000). Trouble in the heartland: GIS and its critics in the 1990s. Progress in Human Geography, 24(4), 569–590. https://doi.org/https://doi.org/10.1191/030913200100189111
- Shalaby, A., & Tateishi, R. (2007). Remote sensing and GIS for mapping and monitoring land cover and land-use changes in the Northwestern coastal zone of Egypt. Applied Geography, 27(1), 28–41. https://doi.org/https://doi.org/10.1016/j.apgeog.2006.09.004
- Sheppard, E. (2005). Knowledge production through critical GIS: Genealogy and prospects. Cartographica: The International Journal for Geographic Information and Geovisualization, 40(4), 5–21. https://doi.org/https://doi.org/10.3138/GH27-1847-QP71-7TP7
- Shiferaw, B., Tesfaye, K., Menale, K., Abate, T., Prasanna, B. M., & Menkir, A. (2014). Managing vulnerability to drought and enhancing livelihood resilience in sub-Saharan Africa: Technological, institutional and policy options. Weather and Climate Extremes, 3, June 2014. 67–79. https://doi.org/https://doi.org/10.1016/j.wace.2014.04.004
- Smucker, T. A., & Wisner, B. (2008). Changing household responses to drought in Tharaka, Kenya: Vulnerability,persistence and challenge. Disasters, 32(2), 190–215. https://doi.org/https://doi.org/10.1111/j.1467-7717.2007.01035.x
- Stites, E., Burns, J., & Akabwai, D. (2014). “It’s better to sweat than to die”: Rural-to-urban migration, Northern Karamoja, Uganda. Feinstein International Center, Friedman School of Nutrition Science and Policy at Tufts University, Boston
- Sui, D. (2014). Opportunities and impediments for open GIS. Transactions in GIS, 18(1), 1–24. https://doi.org/https://doi.org/10.1111/tgis.12075
- Tappan, G. G., Cushing, W. M., Cotillon, S. E., Mathis, M. L., Hutchinson, J. A., & Dalsted, K. J., (2016). West Africa land use land cover time series: U.S. Geological Survey data release, https://doi.org/https://doi.org/10.5066/F73N21JF.
- Turner, M. D., McPeak, J. G., & Ayantunde, A. (2014). The role of livestock mobility in thelivelihoodstrategies of rural peoples in Semi-Arid West Africa. Human Ecology, 42(2), 231–247. https://doi.org/https://doi.org/10.007/s10745-013-9636-2
- Verdoodt, A., Mureithi, S.M., & Van Ranst, E. (2010). Impacts of management and enclosure age on recovery of the herbaceous rangeland vegetation in semi-arid Kenya. Journal of Arid Environments, 74, 1066–1073. doi:https://doi.org/10.1016/j.jaridenv.2010.03.007
- Wairore, J., Mureithi, S., Wasonga, O., & Nyberg, G. (2015). Benefits derived from rehabilitating a degraded semi-arid rangeland in private enclosures in west pokot county, Kenya. Published online in Wiley Online Library (wiley onlinelibrary.com).
- Warf, B., & Sui, D. (2010). From GIS to neogeography: Ontological implications and theories of truth. Annals of GIS, 16(4), 197–209. https://doi.org/https://doi.org/10.1080/19475683.2010.539985
- Wasige, J. E., Groen, T. A., Smaling, E., & Jetten, V. (2013). Monitoring basin-scale land cover changes in Kagera Basin of Lake Victoria using ancillary data and remote sensing. International Journal of Applied Earth Observation and Geoinformation, 21, April, 2013. 32–42. https://doi.org/https://doi.org/10.1016/j.jag.2012.08.005
- Wernersson, J. E. V. (2018). Rethinking identity in adaptation research: Performativity and livestock keeping practices in the Kenyan drylands. World Development, 108, 283–295. https://doi.org/https://doi.org/10.1016/j.worlddev.2018.02.010