
 ?Mathematical formulae have been encoded as MathML and are displayed in this HTML version using MathJax in order to improve their display. Uncheck the box to turn MathJax off. This feature requires Javascript. Click on a formula to zoom.
Abstract
This study was conducted to identify the factors that motivate the farmers to adopt dairy cattle insurance. This study was based on the field survey conducted in the Chitwan and Nawalparasi districts of Nepal. A total of 160 cross-sectional households sampled were obtained using a simple random sampling technique. Data were collected using a pre-tested interview schedule and focal group discussion in 2017. About 64 percent of respondents were found to get technical assistance for insurance through agro-vets. The study revealed that dairy cattle insurance was an important risk management tool among who experienced cattle loss. Lack of knowledge and information about the benefits of cattle insurance was found to be the major reason for not joining cattle insurance. Risk coverage by insurance was identified as a satisfying factor of insurance in the study. A probit model was used to assess the motivating factors for the adoption of cattle insurance and revealed that cattle breed, access to loan, income from livestock, and a number of cattle had a positive and significant relationship with the adoption of cattle insurance whereas household size and district dummy had a negative and significant relationship with the adoption of cattle insurance. The findings imply for policymakers, insurance companies, and sellers of risk management strategies.
PUBLIC INTEREST STATEMENT

Livestock is one of the fastest growing agricultural sub-sectors in developing countries. This growth is driven by the rapidly increasing demand for livestock products, the demand being driven by population growth and urbanization. Livestock insurance is an important solution for the possible losses to the cattle farmers, but it’s appropriate implementation and regulation has not been practiced intensively till date in Nepal. Lack of knowledge about insurance schemes was found to be the major reason for not joining cattle insurance. Cattle breed, access to loan, income from livestock and number of cattle had significant positive relation with adoption of cattle insurance whereas household size and district of the respondent had significant negative relation with adoption of cattle insurance. These findings clearly hints that awareness generation programs about the insurance schemes should be carried out at wider level along with provisions of agricultural loans for risk sharing and motivating farmers on livestock enterprise.
1. Introduction
Livestock system occupies about 30 percent of the planet’s ice-free terrestrial surface area and is a significant global asset with a value of at least US$1.4 trillion (Steinfield et al., Citation2006). Livestock is one of the fastest-growing agricultural sub-sectors in developing countries and its share of agricultural GDP is quickly increasing. Maltsoglou and Taniguchi (Citation2004) in their study using the secondary data of NLSS 2011 in Nepal stated that livestock and land are the two major components of rural farming and livestock sector in Nepal that have significant importance in terms of household food consumption and cash income where the latter proves to be especially important for smallholders and landless households. The study calls for an appropriate integrated policy for strengthening the livestock sector which would have an indirect positive impact on the rural poor.
In the context of Nepal, livestock is an important component of agriculture, contributes 24 percent (MoAD, Citation2015). In Nepal cattle are the most popular class of animals owned by 68 percent of households and cattle have always dominated the livestock production system (Ghimire, Citation2013). Agricultural insurance is an important element of a comprehensive agricultural risk management strategy. Livestock insurance can be the alternative to the occasional herd loss and could prevent the downward slide of vulnerable populations, crowd-in investment accumulation for poor, and induce financial deepening by crowding in-credit. Although general insurance was introduced in Nepal in 1937 after the establishment of Nepal Bank Ltd, the country’s first commercial bank, and the National Insurance Corporation was established in 1967, livestock insurance began only in 1987 in form of livestock credit or micro-finance guarantee insurance against animal mortality and loss.
Non-insurance organizations used to provide the services for livestock insurance occasionally in Nepal before 2012. After the promulgation of crop and livestock insurance directive in 2013 the compulsory involvement insurance companies for livestock and the crop insurance has been ensured (MoAD, Citation2015) and there are 17 insurance companies providing livestock and crop insurances (Sapkota, Citation2017). An insurance premium rate of 5 percent has been assigned per year and the Ministry of Agricultural Development introduced a subsidy on the premium paid for insurance of crop and livestock in June 2013. The government provides a 75 percent subsidy on insurance premiums paid by individual farmers, farmers’ groups and farmer cooperatives since 2014. Pradhanang et al. (Citation2015) in their review on National Livestock Policies of Nepal highlighted the lower involvement of microfinance institutions, agriculture cooperatives, and financial Non-Government Organizations (NGOs) as a major weakness in the implementation of Livestock Insurance Policy and Agriculture and Livestock Insurance Regulation (2013) along with the low ceiling on the amount of insurance (NRs. 100,000). World Bank (Citation2009) highlighted a series of challenges to the introduction of agricultural crop and livestock insurance in Nepal which includes lack of road networks in hill, and mountain region, lack of commercial insurance network and very small size of crop and livestock enterprises.
Mohammed and Ortmann (Citation2005) in their study with the objectives of identifying the factors affecting the adoption of livestock insurance found that formal education of the farmer and the farmer’s awareness of livestock insurance increased the probability of insurance adoption, whereas, farming experience, poor location and use of alternative risk management strategies, such as off-farm investments and farm enterprise diversification reduced the probability of livestock insurance adoption. Ogurtsov et al. (Citation2006) studied the factors explaining farmers’ insurance purchase in the Dutch dairy sector using the Farm Accountancy Data Network (FADN) cross-sectional dataset from Landbouw Economisch Instituut (LEI) for 2001 on 240 specialized dairy farms, the study revealed that explanatory variables taken in the model like the number of cows in the farm, farm revenue, balance sheet value, long term debt has a significant positive impact on the insurance purchase by the dairy farmers whereas the liquid capital short term debt had a negative impact on the purchase of insurance or the premium paid. Usman and Dodo (Citation2014) studied with 120 farmer’s participants in agriculture insurance in Nigeria to identify the socioeconomic factors influencing farmers’ willingness to continue insuring their rice production. Based on the logistic regression farm size and formal education were identified as the influencing socioeconomic factors influencing farmers’ willingness to continue to take insurance. (Bullock et al., Citation1994) studied risk and factors associated with risk in sugarcane with 110 farmers in South Africa. The study found that education was negatively related to farmers WTP for insurance as educated farmers have a different range of options for managing risk.
In this context, this study aimed to assess farmers’ perception and major factors determinant on dairy cattle in the Nawalparasi and Chitwan districts of Nepal.
2. Materials and methods
2.1. Study site and sample
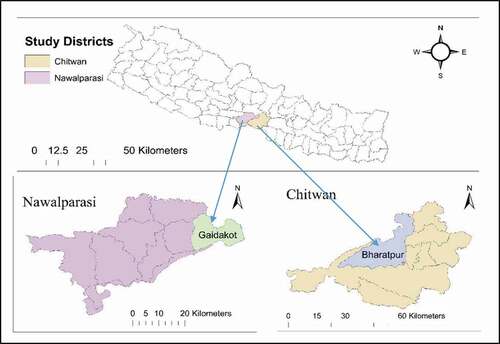
Chitwan and Nawalparasi districts () of Nepal were selected purposefully for the study to include major cattle rearing districts. The roster of the farmers registered as insurers in the respective districts was prepared with the help of the District Livestock Service Office (DLSO) and insurance companies. The farmers holding the insurance scheme were categorized into clusters according to the village/Municipality in two districts and the village/Municipality were purposively selected. Purposive sampling was employed in the first stage to select the Municipalities and simple random sampling was employed in the second stage to select the insurer and non-insurer cattle farmers. Thus, stratified simple random sampling technique was adopted by selecting 40 insurers and 40 non-insurers from each district to comprise the sample of 160 households. Primary data was collected using a semi-structured questionnaire in 160 households, key informant interviews with concerned stakeholders and focus group discussion (2 in each district). Variables like age, gender, ethnicity, occupation, schooling, family type, family size, education status, landholding, livestock holding, economically active population, migration status, etc. were analyzed using descriptive statistics like frequency, percentage, mean, standard deviation, etc.
Figure 1. Map of study area
2.2. Empirical analysis and econometrics model
Three-point and five-point Likert scaling techniques were used to determine farmers’ perception and satisfaction towards cattle insurance respectively. Three-point Likert scale compares not important, moderately important, and very important whereas a five-point Likert scale compares most important, somewhat important, important, less important, and least important using the scores of 1.00, 0.80, 0.60, 0.40 and 0.20 respectively. The index value for perception, and satisfaction was calculated as (where I is the index value for perception/satisfaction, Si is scale value of ith intensity, Fi is frequency of ith response, and N is total number of respondents).
In this study, the probit model was used to determine the factors determining the adoption of cattle insurance. This model was used to identify the determinants (regressors) on the probability of adoption of cattle insurance (regressand). The likelihood of farmers adopting a cattle insurance is a non-linear function of regressors. The the probit model used is of the form Pr (Y = 1) = (Xi) where Pr (Y = 1) represents the probability of adopting cattle insurance scheme with the change in X variable. A positive estimated coefficient implies an increase in likelihood of adoption of cattle insurance. Probit model establishes relation between probability values and explanatory variables and ensures the probability value between 0 and 1.
In probit model, let us suppose Yi is the binary response of the farmers, Yi = 1, if the farmer adopts cattle insurance, and Yi = 0 if the farmer does not adopts the cattle insurance.
If Yi = 1; Pr (Yi = 1) = Pi
If Yi = 0; Pr (Yi = 0) = 1-Pi
Where Pi = E(Y = 1/X) represents the conditional mean of Y given certain values of X.
Model specification
Pr (Y = 1) = f (bo + b1 X1 + b2 X2 + b3 X3 + b4 X4 + b5 X5 + b6 X6 + b7 X7 + b8 X8 + b9 X9 + b10 X10 + b11 X11 + b12 X12 + b13 X13 + b14 X14 + b15 X15)
Where,
Pr (Y = 1) = Probability of adopting cattle insurance scheme
X1 = Age of the household head (Years)
X2 = Gender of the household head (Male = 1 otherwise 0)
X3 = Education of the household head (Years of schooling)
X4 = Household size of the respondent (Number of members)
X5 = Migration status of the household to abroad (Migrated = 1 otherwise 0)
X6 = Land holding of the household (in Hectare)
X7 = Experience in cattle rearing (Years)
X8 = House type of the respondent (Pakki = 1 otherwise 0)
X9 = Income from livestock (natural log transformation)
X10 = Breed of cattle reared (Improved = 1 otherwise 0)
X11 = Shed of the cattle (Traditional = 1 otherwise 0)
X12 = Membership in social organization (Yes = 1 otherwise 0)
X13 = Technical assistance (Yes = 1 otherwise 0)
X14 = Access to loan (Yes = 1 otherwise 0)
X15 = District of the respondent (Chitwan = 1 otherwise 0)
b0 = Regression coefficient
b1, b2 … … … … b14 = Probit coefficient
The description of the variables used is shown in the .
Table 1. Description of the variables used in probit model
3. Results and discussion
3.1. Socio-demographic characteristics
shows the socio demographic characteristics of the respondents by cattle insurance. The average age of the respondent was significantly lower among cattle insurers than that of non-insurers which was significant at 1 percent level. Mohammed and Otrmann (2005), Falola et al. (Citation2013), and Aidoo et al. (Citation2014) also had similar findings, but on the contrary Ali (Citation2013) stated that farmers with higher age were more willing to participate in the food and cash crops insurance. The negative relation of age with joining insurance could be explained that younger farmers are more associated with extension services and access to extension service directly influence the knowledge about risk management strategies. Economically active household members (15–60 age group) and total household size were also found significantly lower among cattle insurers as compared to non-insurers at 10 percent and 5 percent levels, respectively. Kumar et al. (Citation2011) had contrasting findings, which states the number of workers in the farm family found significantly and positively influence the adoption of insurance and premium paid by the farmers. The lower number of active family members associated with insurance could be explained that larger farm families could provide proper time and a greater share of ideas to deal with risk related to cattle and thus less requirement for risk management tools. The result of the chi-square test showed that there was a significant difference between the migration statuses of the household members with non-insurers having a higher number of out-migrants than insurers. Maharjan et al. (Citation2013) in their study had found a similar finding where most of the household tends to neglect subsistence farming when there are alternative sources of income.
Table 2. Socio-demographic characteristics of the respondents by cattle insurance
3.2. Number of cattle insured and claims by district
Among the insurers, the average number of cattle insured per household was 5.98 (). The average number of dairy cattle insured was higher in the Nawalparasi district (7.85) than that of Chitwan district (4.12) and the result was significant at 5% level.
Table 3. Number of cattle insured and claims made by district
The average number of claims made by the insurers in the study area was 0.27. The average number of claims were also higher in the Nawalparasi district (0.45) than that of Chitwan district (0.10) and the result was significant at 1% level. Both the districts having similar infrastructures in livestock husbandry, the higher number of claims in Nawalparasi districts could be related to a higher number of cattle insured.
3.3. Access to technical service from different sources by insurance
The source of technical assistance for the respondents was accessed. Among the various technical service providers’, the majority (64%) of the respondents received technical assistance from agro-vet. It was followed by co-operatives (18%), DADO/DLSO (14%), and others (4%). Among various service providers, DADO/DLSO provided technical service to a greater number of non-insurers whereas Cooperatives provided technical service to a greater number of cattle insurers (). About 4 percent of total respondents were for other sources such as the veterinary teaching hospital of Agriculture and Forestry University and NGOs working in the agriculture sector in the study area.
Figure 2. Source of technical service providers by insurance
3.4. Risk perception and risk management tools used in cattle rearing
shows the risk perception by farmers regarding cattle rearing. The study of risk perception among cattle insurers revealed that disease (56%) was the major risk in cattle rearing followed by parasites (31%), calves management (9%), infertility (3%), and wildlife attack (1%). Similarly, in the case of non-insurers disease (40%) was a major risk in cattle rearing followed by parasites (30%), infertility (15%), calves management (6%), no risk (5%), and wildlife attack (4%).
Figure 3. Farmers’ perception on risk related to cattle rearing by insurance
3.5. Risk management tools used by respondents who experienced cattle loss
Risk management tools used by respondents who experienced cattle loss waere studied. Among various risk management tools, informal sources (friends/relatives), sale of assets, and sale of livestock were used by more non-insurers whereas insurance and cooperative schemes were used by more insurers as a risk management tools. The insurance and cooperative schemes were found similar in both survey districts. The percentage of response for various risk management tools by insurance is given in .
Figure 4. Risk management tools used by respondents who experienced cattle loss
3.6. Perception and satisfaction
presents the perception of different risk management tools used by the respondents who experience cattle loss in the last four years was studied. Three-point Likert scale was used. The calculation of the index of importance showed that the most important risk management tool as perceived by the respondents was cattle insurance with an index of 0.83. Cattle insurance was followed by formal co-operative schemes (0.66), which was followed by an informal sources (friends/relatives) (0.61).
Table 4. Perception on different risk management tools used by respondents who experienced cattle loss
The satisfaction of respondents with the various factors that affect the insurance policy was calculated using five-point Likert scale (). The study showed that there was a significant difference in the satisfaction of cattle insurers regarding factors affecting insurance policy in Chitwan and Nawalparasi district concerning the subsidy policy of government and insurance procedure at 10 percent level. Similarly, there was a significant difference between Chitwan and Nawalparasi district concerning satisfaction in risk coverage and identification of indemnity level at 5 percent level. There was a significant difference between Chitwan and Nawalparasi district with respect to satisfaction in quickness in paying claim at 1 percent level of significance. This could be related to the diversified technical service providers and efficiency of their services in the respective districts as the subsidy policy, insurance procedure and identification of indemnity is similar all over the country.
Table 5. Satisfaction of cattle insurers regarding various factors affecting insurance policy
The satisfaction index showed that risk coverage was perceived as the most satisfying policy for the insurance with a satisfaction index of 0.72. Similarly, premium amount was ranked as the second most satisfied policy with a satisfaction index of 0.71. The least satisfied policy was the quickness in paying claim with a satisfaction index of 0.37.
3.7. Reasons for not joining cattle insurance
The reasons for not insuring cattle were accessed among the non-insurers. Multiple responses were obtained. Altogether there were 115 responses. shows responses for various reasons of not joining cattle insurance. The majority of the response (32.2%) were for not aware of facilities available followed by not aware of cattle insurance (27.8%), not no need of cattle insurance (11.3%), inadequate publicity of the scheme (10.4%), complex documentation (7%), lack of premium paying capacity (4.3%), no faith in scheme/agency (3.5%) and delay in claim payment (3.5%).
Table 6. Reasons for not joining cattle insurance
3.8. Econometrics model on factors determining dairy cattle insurance
To determine the factors that influence the cattle insurance, the probit regression model was used. The likelihood ratio chi-square (LR chi2) for the model was statistically significant at 1 percent level which revealed the model has good explanatory power. The Pseudo R2 was 0.33 ().
Table 7. Results from probit model for factors determining dairy cattle insurance
The results from the Probit model revealed that a number of cattle, income from livestock, access to loan and cattle breed had a significant and positive impact on the adoption of cattle insurance whereas household size and district dummy had a significant and negative impacts on the adoption of cattle insurance. Keeping other variables constant the probability of joining cattle insurance decreases by 5 percent with an increase in household size by one unit, increases by 3.6 percent when the number of cattle increases by a unit, increases by around 15 percent when the income from the livestock increases by one unit, increases by around 37 percent when the household had access to loan, increases by around 44 percent when the cattle breed is improved and decreases by around 23 percent when the district is Nawalparasi.
Falola et al. (Citation2013) in their study applied the same model and found similar positive and significant relation with access to loan but the result with farm income was contrasting that is, farm income had a significant and negative relation with the adoption of cattle insurance. This could be justified that farmers with higher income could easily buy insurance scheme than their colleagues with low income. Serman and Filson (Citation1999) noted that high farm income improves the capacity to adopt agricultural innovations and the amount of farmers are willing to pay for innovations. Ali (Citation2013) also found that increase in household size had a significant and negative relation with joining cattle insurance. Mohammed and Otrmann (2005) also found that farm size had a positive relation with the adoption of cattle insurance.
4. Conclusion and policy implications
The livestock sector directly supports the livelihood of around 600 million poor smallholder farmers in the developing world and is an important component of Nepalese agriculture contributing 33 percent to agriculture gross domestic product (AGDP). Livestock insurance can be the alternative to occasional herd loss and could prevent the downward slide of vulnerable populations. Realizing the importance of livestock insurance as a tool for managing risk, and uncertainties, this paper has examined farmers’ perceptions and determinants of dairy cattle insurance in Nepal. The average age of respondents, household size and economically active household members were found significantly lower among cattle insurers as compared to non-insurers. A significant difference was found in the migration status of households among cattle insurers and non-insurers. Agro-vets were the major technical service provider followed by cooperatives. Disease and parasites were found to be major risks in cattle rearing. Insurance and cooperative schemes were found to be the major risk management tools among insurers whereas informal sources (friends and relatives) and sale of assets were the major risk management tool among non-insurers. Being not aware of facilities available after insurance was found to be the major reason for not joining cattle insurance. The probit model revealed that cattle breed, access to loan, income from livestock and number of cattle were positively significant factors determining cattle insurance whereas household size, and district were negatively significant. Based on the findings from this study, programs to motivate farmers for rearing improved cattle breed, improving access of farmers on agricultural credit, and awareness generation programs regarding risk management strategies would be recommended to avoid economic loss among cattle rearing farmers.
Authors’ contributions
Rishi Ram Kattel conceptualized this research. Sandip Subedi designed and executed a research plan. Moreover, he analyzed the data. Mr. Subedi and Mr. Kattel both prepared this manuscript. All authors approved the manuscript.
Competing interests
The authors declare no competing interests.
Acknowledgements
This research was funded by the Directorate of Research and Extension from Agriculture and Forestry University, Nepal. We are also deeply indebted to the dairy cattle farmers, milk traders, and insurance companies in our study area, who are too numerous to mention individually, but without whose cooperation this study would not have been possible. Errors, if any, are entirely our own.
Additional information
Funding
Notes on contributors
Rishi Ram Kattel
Sandip Subedi a Horticulture Development Officer in the National Center for Potato, Vegetable and Spice Crops Development under the Department of Agriculture, Ministry of Agriculture and Livestock Development, Nepal. Subedi holds a Master Degree in Agricultural Economics form the Agriculture and Forestry University (AFU), Nepal in 2018. His area on research interest includes agribusiness management, climate change, agricultural economics and value chain of horticultural and spice crops.
References
- Aidoo, R., Mensah, J. O., Wei, P., & Dadson, A. (2014). Prospects of Crop Insurance As A Risk Management Tool Among Arable Crop Farmer In Ghana. Asian Economic and Financial Review, 4(3), 341–15. http://aessweb.com/journal-detail.php?id=5002
- Ali, A. (2013). Farmers’ Willingness to Pay for Index Based Crop Insurance in Pakistan: A Case Study on Food and Cash Crops of Rain-fed Areas. Agricultural Economics Research Review, 26(2), 241–248.
- Bullock, W., Ortmnann, G., & Levin, J. (1994). FARMER CHARACTERISTICS, RISK SOURCES AND MANAGERIAL RESPONSES TO RISK IN VEGETABLE FARMING: EVIDENCE FROM LARGE AND SMALLSCALE COMMERCIAL VEGETABLE FARMERS IN KWAZULU-NATAL / Eienskappe van boere, risikobronne en bestuursoptrede ten opsigte van risiko van groenteboerdery met spesifeke verwysing na groot- en kleinskaalse kommersiële groenteboere in KwrZulu-Natal. Agrekon, 33(3), 103–112. https://doi.org/https://doi.org/10.1080/03031853.1994.9524773
- Falola, A., Ayinde, O. E., & Agboola, O. B. (2013). Willingness To Take Agricultural Insurance By Cocca Farmers In Nigeria. International Journal of Food and Agricultural Economics, 1(1), 97–107.
- Ghimire, R. (2013). Crop an Livestock Insurance Practices in Nepal. Journal of Business and Social Science, 1, 2.
- Kumar, S., Baraha, B., Ranganathan, C., Venkatram, R., Gurunathan, S., & Thirumoorthy, S. (2011). An Analysis of Farmers’ Perception and Awareness towards Crop Insurance as a Tool for Risk Management in Tamil Nadu. Agricultural Economics Research Review, 37–46
- Maharjan, A., Bauer, S., & Knerr, B. (2013). Migration for Labour and Its Impact on Farm Production in Nepal. ResearchGate.
- Maltsoglou, I., & Taniguchi, K. (2004). Poverty, Livestock and Household Typologies in Nepal. The Food and Agriculture Organization of United States
- MoAD. (2015) . Nepal Portfolio Performance Review (NPPR). Ministry of Agricultural Development.
- Mohammed, M., & Ortmann, G. (2005). Factors Influencing Adoption of Livestock Insurance by Commercial Dairy Farmers in Three Zobatat of Eritrea. Agrekon, 44(2), 172–186. https://doi.org/https://doi.org/10.1080/03031853.2005.9523708
- Ogurtsov, V. A., Asseldonk, M. A., & Huirne, R. B. (2006). Factors Explaining Farmers’ Insurance Purchase in the Dutch Dairy Sector. ReserchGate, 297–305. https://www.researchate.net/publication/23510257
- Pradhanang, U. B., Pradhanang, S. M., Sthapit, A., Krakauer, N. Y., Jha, A., & Lakhankar, T. (2015). National Livestock Policy of Nepal: Needs and Opportunities. Agriculture, 5(1), 103–131. https://doi.org/https://doi.org/10.3390/agriculture5010103
- Sapkota, K. (2017). Insurance companies providing livestock and crop insurance in Nepal. S. Subedi, Interviewer.
- Serman, N., & Filson, G. (1999). Factors affecting farmers' adaption of soil and watershed conservation practices in Southwestern Ontario.
- Steinfield, H., Gerber, P., Wassennar, T., Castel, V., Rosales, M., & Hann, C. (2006). Livestock’s long shadow: Environmental issues and options. FAO.
- Usman, M. A., & Dodo, H. (2014). Socio-Economic Factors Influencing Agricultural Insurance in Rice Production in Kano State, Nigeria. International Conference on Advances in Agricultural, Biological and Environmental Science(AABES-2014), (pp. 46–48). Dubai (UAE).
- World Bank. (2009). Agricultural Insurance Feasibility Study for Nepal.