
 ?Mathematical formulae have been encoded as MathML and are displayed in this HTML version using MathJax in order to improve their display. Uncheck the box to turn MathJax off. This feature requires Javascript. Click on a formula to zoom.
Abstract
Watersheds provide diverse range of goods and services which are vital for the sustenance of human wellbeing. Despite the huge volume of watershed development work in the intervention sites, sustainable flow of benefits from the constructed structures stayed to be still an issue. This study aimed to analyze Determinates of farmers’ preference for watershed ecosystem services in East and West Belesa Districts, NorthWest Ethiopia. From the two districts, a total of 501 households were selected by using multistage sampling technique. Essential ecosystem services were used to develop and list watershed intervention list of options. The intervention options were created using choice experiment method by employing a D-optimal choice design. The mixed logit result revealed that farmers preferred the inclusion of different ecosystem services such as improved livestock fodder, soil moisture and fertility, stabilized spring water flow, reduced soil erosion and increased crop productivity in watershed interventions. However, the preference of the services was governed by the interaction of farmers’ socioeconomic settings and attitudinal backgrounds. For instance, households with larger family size exceptionally valued the importance of enhanced soil fertility and moisture more than anything else. Similarly, farmers who hold relatively larger farms showed little interest for interventions striving to cut soil erosion at most. More importantly, farmers were found to give special emphasis for feed development and springs enhancement services over the rest of the ecosystem services included in the intervention menus. This implies that farmers give more preference to the two scarce resources of water and fodder more than other values even to those emphasized services aspired in the de-facto interventions which are reduced soil erosion and increased crop productivity. This calls for the need to revisit the undergoing interventions in the areas geared toward more livestock feed and water sources development.
Public Interest Statement
Watersheds provide diverse range of goods and services which are vital for the sustenance of human wellbeing, though it is contribution on improve soil moisture and fertility, reduce soil erosion, improves household’s income, honey production and fruits and vegetable production that improved food security statues of Framers, so the farmers who participate in watershed management activity should base on their preference and willingness to contribution but the current watershed management interventions do not consider the preference and willingness of farmer’s due to this the sustainability of watershed interventions still an issue. Therefore, the author is highly interested to recommend the need to revisit the undergoing interventions in the areas geared toward more livestock feed and water sources development.
1. Introduction
Natural resources provide primary foundation of livelihood sources for many sub-Saharan African smallholder indigenous farming communities with different ecosystem goods and services along with food, medicinal plants, fiber and energy, climate and water regulation, soil formation and nutrients cycling, erosion control, and socio-cultural attachment (Mugwedi et al., Citation2018). Similarly, smallholder farmers in rural Ethiopia heavily depend their livelihood on a wide variety of ecosystem services derived from watersheds. The services provided include safe water for drinking and agriculture, livestock fodder, reduced soil erosion, increase crop productivity, improves soil moisture biodiversity conservation, and rehabilitation of degraded soils (Berhan et al., Citation2017). However, due to continuous and long aged traditional farming practices in the Northern highland of the country coupled with ever-increasing population pressure, land degradation has become imminent feature of the environment degradation (Adimassu, Citation2013).
Understanding the devastating impact of such resources losses, Government and Non-government organization are working in West and East Belesa districts to rehabilitate degraded lands and ultimately improve food security, water access, and income of rural farmers thereby reducing poverty incidence. These grand goals of rehabilitation are facilitated through participating local farmers in several watershed development activities. Despite the huge volume of watershed development work, in the intervention sites, sustainable flow of benefits from the constructed structures stayed to be still an issue (WBDoA, Woreada Agriclure office, 2018). One of the main reasons for the low sustainability of natural resource rehabilitation endeavor’s is believed to be the little understanding of the preference of main actors in the watershed development process, the rural farmers. Therefore, incorporating traditional knowledge, skills and know-how in the ongoing watershed development are important prerequisites for successful accomplishment of the current interventions (United Nations Convention to Combat Desertification [UNCCD], Citation2015). Thus, it is critical to address the local farmers’ preference and constraints in watershed and soil and water conservation technology evaluation (Adimassu, Citation2013).
Thus, there is a need to recheck the intent of local farmers’ driving force to sustainably build and conserve structures for long-term investments in watersheds. This study investigated the relative importance of several ecosystems services that would be derived from the development of watersheds by the public. There are, some empirical evidence in Ethiopia regarding ecosystem valuation for example, (Yibrie, Citation2011); (Berhun. G, Citation2012); (Adimassu, Citation2013); (Vaiknoras. A, Citation2015); (Teshome, Citation2016); (Asmamaw, 2017) and (Buhari. A, Citation2017). However, these research works focused on, valuing the importance of attributes but no one shows the variation of preference for farmers for the ecosystem attributes. Therefore, the purpose of this study is to analyze determinates of farmers’ preference for improvements watershed ecosystem services.
2. Materials and methods
2.1. Description of study area
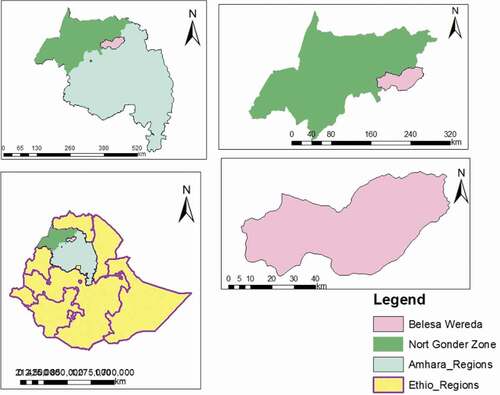
The study was done in four randomly selected kebeles of the 20 CARE intervention Kebeles in East and West Belesa woredas of North Gondar Zone. A total of 501 sample respondents were selected using the kebele resident registration file as a sample frame document. The respondents were drawn using the probability proportional to size of simple random sampling technique (see ).
Figure 1. Map of the study area
2.2. Data type, sample size, and sampling procedure
The study used primary data collected through focus group discussion (FGD) and individual interview. Four FGDs were undertaken in the four CARE intervention kebeles by involving 8–12 farmers of different age, gender, and social groups. Through the FGD, using a checklist, participants discussed on major watershed development structures and their drawbacks and benefits, their preferences, and concerns regarding the ongoing watershed activities, major challenges encountered and the type of agricultural technologies they would like to adopt on their farmyards. On the other hand, the primary data was obtained through choice experimental scenario and the demographical and socio-economic characteristics of the sample households.
In this study, both qualitative and quantitative data were collected from primary and secondary sources. The main primary data was obtained from choice experiment scenario and it includes information on the demographical and socio-economic characteristics of the households. The data that were collected from choice experimental scenario were quantitative whereas qualitative data were collected from focus group discussion and key informant interviews.
The required sample size was calculated using the formula (Yemane, 1967) cited in (Israel, 1992), the formula is given as follows:-
where ‘n’ is the sample size required ‘N’ is the total number of households within project interventions’ kebeles from the two districts and ‘e’ is the level of sampling precision which is assumed to be 5% in this study. According to (SWEEP, Citation2019), the total population of the project interventions’ kebeles from the two districts has 43,715. Therefore, using the above formula, the sample size required from the district is calculated as:-
To gain a higher efficiency in our estimates, we decided to push the sample size from 396 to 501 households for the study. Following this, we have used 12,024 (24 choice sets x 501 sample households) observations for the choice analysis.
A multistage sampling technique was used to select the sample respondents. The sampling technique involves three stages. In the first stage, select the two districts by using purposive sampling because project interventions woredas. In the second stage 20 kebeles (10 from West Belesa and 10 from East Belesa district) were obtained from project intervention kebele’s then four sample kebeles (two from West Belesa and two from East Belesa district) were selected purposefully. The reason for the selection of these kebeles is based on their watershed accessibility and long year’s watershed intervention area. In the third stage, the numbers of all farm households from each selected sample kebele’s were, listed. Finally, headed a total of 501-sample farm households of the study were, selected using simple random sampling technique from the four-sample kebele’s in a proportional-to-size of each kebele’s ().
Table 1. Number of sample households from East and West Belesa
2.3. Methods of data analysis
First, using descriptive statistics, the socio-economic and demographic characteristics of the households were analyzed. The descriptive analysis is essential in providing better understanding of salient features of sample units. The statistics were mean, minimum and maximum values, frequencies, percentages and graph for continuous and categorical variables.
Multinomial logit models and conditional logit models have been the standard techniques for discrete choice data analysis (Hensher & Greene, Citation2003). However, the results of these models have limited applicability due to the restrictiveness of their independence of irrelevant alternatives (IIA) assumption. One alternative model is the mixed logit model, which relaxes the IIA assumption by modeling preference heterogeneity to estimate random utility models (ibid, 2009), the mixed logit model, also known as the random parameter logit model has a more flexible functional form than other logit models. It allows for heterogeneous preferences, or random taste variation. Variables can be specified as having either fixed or random coefficients. The random coefficients allow for preference heterogeneity. It also allows for unrestricted substitution patterns relaxing the IIA assumption and correlation between unobserved factors over time. The mixed logit model also accounts for the panel nature of choice data because it includes an individual specific error term that is, correlated across the choices made by a particular individual. The mixed logit model was used to study consumer preferences for cattle traits, animal welfare attributes, genetically modified foods, and many other ecosystem services valuation (Ouma et al.,); (Teshome, Citation2016); (Eticha, Citation2016) and (Vaiknoras, Citation2015).
Following to (Revelet, Citation1997), we assume a sample of N respondents with the choice of J alternative on T choice occasions. The utility of nth individual from choosing alternative J on t occasions is given by;
where = vector individual-specific coefficient
= is a vector of observed attributes relating to individual n alternative J on t choice occasions and
is a random term which is assumed to be distributed in IID extreme value. The density β denoted as
where θ are the parameters of the distributions. Conditional on knowing
the probability of respondent’s n choosing alternative i on choice occasion t given by;
Which is the conditional logit formula (McFadden, Citation1974).The probability of observed sequence choice conditional on knowing is given by;
where the alternative chosen by individual n on occasions t. the unconditional probability of the observed sequence of choice the conditional probability integrated over the distribution β;
The unconditional probability thus averages products of logit formula evaluated at different value of β with the average given by density f.
3. Results and discussion
3.1. Household demographic characteristics
From the 501 sample households interviewed, about 86.23% and 13.77% were males and female-headed households, respectively (). This is due to that like most our country, the male-headed household dominate decision in household issue (1993 Singh et al. 1993) as cited in Teshome, Citation2016). The mean age of the respondents was 43.03 years that range from 20 to 86 years. The average family size of the respondents was 5 and the values varied between a minimum of 1 and a maximum of 10. The maximum and the minimum years of education were 12 years and 0 years, respectively ().
Table 2. Summary of descriptive statistics for household demographic characteristics
3.1.1. Household socio-economic and institutional characteristics
Landholding is a more decisive socioeconomic variable that is important for agricultural practice and livelihood improvement. The average cultivated landholding of the sampled households was 0.85 hectares (). This figure is relatively lower than the average national figure, which is 1.2 ha (CSA, Citation2011).
Table 3. Summary of descriptive statistics for socio-economic characteristic
Livestock holding; for rural farm households livestock is an important source of cash income, food, manure and source of power for cultivation (Ayele et al., Citation2012). Holding a larger amount of livestock is an indication of wealth. The same is true in the study area where the majority of the farmers’ income is dependent on livestock.
Distance from watershed is an important variable for farmer’s preference of watershed ecological service improvement. From our own survey, the average watershed distance from household residents to watershed is 1.187 km ().
3.2. Determinates of farmers preference of watershed ecosystem services
The mixed logit model allows us to examine farmers’ preference for watershed ecosystem services to varying randomly assigned attributes. To determine if there is preference heterogeneity, preferred to simply run a mixed logit to assess which variables, if any, have random coefficients (Hensher & Greene, Citation2003). Mixed logit models specified as fixed or random coefficients. Random coefficients can be given normal or lognormal distributions. The first mixed logit model was, run with labor contribution fixed and all other variables as random with the normal distribution. Labor contribution was, initially, fixed. Because when the price is, fixed and all other variables have a normal distribution; it can be simple and straightforward to calculate willingness to pay using STATA’s WTP command.
All assigned attributes except increased soil moisture and fertility such as Livestock fodder availability, stabilizing spring water flow, reduce soil erosion, and increase crop productivity are significant at 5% and 1%, respectively. The fixed variable of labor contribution has a positive coefficient and significant at 1%. The significant positive labor contribution coefficient indicates Ceteris paribus, the respondents prefer to contribute more family labor for improvement in watershed services. The negative coefficient of the increase soil moisture and fertility attribute implies that the fewer the number of labor days by the family for such watershed activities which enhance soil moisture and fertility, the higher the farmers’ utility. Whereas the positive coefficients of other significant imply that the improvements of those watersheds ecosystem services are considered desirable.
Moreover, the significant standard deviations associated with the random parameters indicate existence of unobserved sources of preference heterogeneity in the sample. Indeed, the magnitude of the standard deviations of the coefficients of most of the watershed attributes is as large as the corresponding mean estimates indicating large preference heterogeneity among the respondents. Mixed logit results also indicated whether, or not each variable exhibits preference heterogeneity, depending on whether the variable has statistically significant standard deviations. Here, livestock grazing availability attributes have not statistically significant and other attributes like stabilizing spring water flow increase soil moisture and fertility, reduce soil erosion, and increase crop productivity all are significant at 1% level. This indicates that those significant attributes exhibit preference heterogeneity. But the insignificant standard deviation of livestock fodder availability implies that all farm households regardless of their socioeconomics background agree on the importance of the livestock fodder service over other important watershed development benefits.
All the mean parameters of watershed attributes are significant at least at 5% level except increased soil moisture and fertility attribute. Farmers generally are willing to contribute free family labor for the ongoing watershed development interventions. The model result implies that farmers prefer more amount of livestock fodder, more stream flows and increased crop productivity with higher reduction in soil loss to be generated from the watershed development activities. The result also showed the absence of emphasized interest on soil moisture and fertility improvement from watershed interventions. The higher mean coefficient for stabilizing spring water flow and livestock fodder availability, indicating that these attributes are more preferred to other watershed attributes. Generally, stabilizing spring water flow followed by fodder availability has the highest mean coefficient values while increase soil moisture and fertility was the lowest valued attribute. This finding is in line with similar study by (Getnet, Citation2012); (Teshome, Citation2016).
3.3. Econometric results: interaction of mixed logit results
The mixed logit model was also estimated with interaction terms included. The inclusion of these interaction terms allowed us to account for the idea that people with different demographic, socio-economic and attitudinal variables may have different utilities with respect to watershed attributes. shows, five out of ten variables to be statistically significant with the interaction mixed logit results.
Table 4. Mixed logit model results
Table 5. Mix reaction results of mixed logit model
The interaction between increased soil moisture attribute and family size was positive and statistically significant at 10% level. Farmers with more number of family members have higher demand for soil moisture conservation ecosystem service. This might be due to the fact that those types of extended family are more interested in attaining crop production from their farm to be assisted with the increased soil moisture. This result is consistent with the result of (Berhan et al., Citation2017). However, the statistically significant standard deviation estimates of the interaction between soil moisture and family size suggests that the level of heterogeneity of the soil moisture attribute varies beyond what can be explained by household family size.
The interaction between reduced soil erosion and landholding was negative and statistically significant at 5%. This means that the farmers with large land holding are less concerned for reduction of soil erosion in watershed intervention endeavors as opposed to the small land holders. Moreover, those farmers who reported higher number of contact with extension agents were found to show low interest for stabilized stream flow services of watershed activities. The result gives an important hint on the relative emphasis of current extension work to deviate hugely from enhancing farmers know how and interest toward the importance of conserving stream flows in watersheds as little attention given for such activities in the normal agricultural extension work. Likewise, farmers who lives far away from the watersheds showed a decreased preference for soil moisture conservation benefits of watershed intervention activities. This result is consistent with the result of (Getnet, Citation2012).
The interaction between distance from the watershed and reduce soil erosion attribute is positive and statistically significant at 5% indicating, implying framers far from the watershed to be more concerned on reduced soil erosion attribute. However, the significant standard deviation shows that heterogeneity of preference over reduced soil erosion benefit from interventions varies beyond what is explained by distance from the watershed. This result is not consistent with the result of (Getnet, Citation2012) due to soil erosion attributes affect mostly lower watershed stream households farmland. The interaction between climate change perception and stabilized water flow and reduced soil erosion attributes are positively and significantly affected at 5% and 1%, respectively, indicating, the framers who perceive the presence of a climatic change to be more concerned with stabilized water flow and reduced soil erosion attributes of watershed than the rest of watershed intervention benefits.
4. Conclusions and police implication
The results of this study showed that watershed attributes variables livestock fodder availability, stabilize spring water flow, reduce soil erosion, and increase crop productivity are preferred watershed attributes by the farmers. The preference of farmers for watershed attributes varies among the respondents not only the attributes watershed in addition to these farmers’ demographic socio-economic and altitudinal backgrounds. The outcome of this study indicates that the farmers were highly preferred stabilized spring water flow and livestock fodder availability is very important entry points in watershed development activities. The policymaker should consider not only watershed attributes but also family size, landholding and distance from watershed to designing strategy for the improvement of watershed development that detriment for farmer’s watershed management activity. This result important for policymakers and extension workers should thus, not expect all farmers to value these attributes of watershed improvement and to expect some farmers to be more prefer one watershed attribute benefit than others. The Go and NGO organizations should give watershed development trainings would be effective in incorporating practical knowledge on how moisture conservation would enhance agricultural productivity, both crop and livestock in the district.Watersheds provide a diverse range of goods and services which are vital for the sustenance of human wellbeing. So, the farmers who participate in watershed management activity should base on theirs preference and willingness to contribute to suitable watershed investment. But the current watershed management interventions do not consider the preference and willingness of farmer’s due to this the sustainability of watershed interventions still an issue. Therefore, the author is highly interested to recommend the need to revisit the undergoing interventions in the areas geared towards more livestock feed and water source development in Belesa woredas.
Acknowledgements
The author’s thanks special and sincere gratitude goes to my major Advisor Dr. Ermiase Tesfye for his professional support, valuable comments, and guidance from the beginning of designing the research proposal up to thesis write up. I also acknowledge CARE, project for supporting me financially. Also, thank CARE project staffs and development agents in East and West Belesa. Woredas for their help in organizing local people during the survey work. I also thank to my respondents for their patience in providing all the necessary information for my study.
Additional information
Funding
Notes on contributors

Yasin Ahmed
Yasin Ahmed was born in Assosa Woreda, Assosa Zone of Benishangul Regional State in February 1992. He also attended his elementary, secondary and preparatory school education at Assosa Secondary and Preparatory High School in Assosa zone. After completion of his high school education, he joined Wollo University College of Agriculture and Veterinary Medicine (WU) in October 2012 and graduated with BSc Degree in Agricultural Economics in July 03/2014. Soon after his graduation, Assistance Lecturer I employed him at Assosa University. After two-year experience the author joined Bahir Dar University College of Agriculture and Environmental since in October 2018 to pursue of his MSc degree in Agricultural Economics in regular program. After the accumulation of my master degree I joined Assosa University College of agriculture and Natural Resource as Lecturer in department of Agricultural Economics.
References
- Abdulkarim, B., Rusli, M., Makmom, A., & Radam, A. (2017). Using choice experimental model to examine households’ preferences and willingness to pay for watershed services attributes in north slang swamp forest Malaysia. Asian Journal of Economic Modeling, Asian Economic and Social Society, 5(1), 98–11.
- Adimassu, Z. (2013). farmers ’ preference for soil and water conservation practices in central highlands of Ethiopia Land degradation has been a major global agenda because of its adverse impact on environment and food security and the quality of life. African Crop Science Journal, 21(Suppl. s3), 781–790. 1021–9730/2013 $4.00
- Ayele, G., Ermias, E., Caria, A., & Karugia, J. (2012). The role of livestock in the Ethiopian economy: Selected paper prepared for presentation at the international association of agricultural economists (IAAE) triennial conference. Policy analysis using a dynamic computable general equilibrium model for Ethiopia, Brazil.
- Berhan, A., Beyene, B., & Tessema, M. (2017). Assessment of natural resources in Ketech Watershed. East Gojjam Zone of Amhara National Regional State.
- Brighte, G. (2011). Climate change and food security. www.brightergreen.org
- CSA. (2011). Federal democratic republic of Ethiopia population projection of Ethiopia for all regions Woreda level from 2007–11.
- Eticha, A. (2016). Economic valuation of nechisar national park ecosystem: Choice experiment approach. http://localhost:80/xmlui/handle/123456789/3539
- G, Berhanu. (2012). Valuation of Choke Mountain Range Wetland Ecosystem, East Gojjam, Amhara Region, Ethiopia: Application of Choice Experiment Valuation Method
- Getnet, B. (2012). Valuation of Choke Mountain Range Wetland Ecosystem, East Gojjam, Amhara Region. Application of Choice Experiment Valuation Method.
- Hensher, D. A., & Greene, W. H. (2003). The mixed logit model; The state practice
- IFAD. (2013). The importance of scaling up for agricultural and rural development and a success story from Peru. www.ruralpovertyportal.org
- McFadden. (1974). D. McFadden, “Conditional Logit Analysis of Qualitative Choice Behaviour,” In: P. Zarembka, Ed., Frontiers in Econometrics, Academic Press, New York, 1974.
- Mugwedi, L. F., Ray-Mukherjee, J., Roy, K. E., Egoh, B. N., Pouzols, F. M., Douwes, E., Boon, R., O’Donoghue, S., Slotow, R., Minin, E. D., Moilanen, A., & Rouget, M. (2018). Restoration planning for climate change mitigation and adaptation in the city of Durban, South Africa. International Journal of Biodiversity Science, Ecosystem Services & Management, 14(1), 132–144. https://doi.org/https://doi.org/10.1080/21513732.2018.1483967
- NRDBD. (2018). Natural Resources Department of Belesa districts un publish document.
- Revelet, T. (1997). Mixed Logit with Repeated Choices:Households’ Choices of Appliance Efficiency Level.
- Solmon, G., Peden, D., Haileslassie, A., & Mpairwe, D. (2009). Factors affecting livestock water productivity: Animal scale analysis using previous cattle feeding trials in Ethiopia. The Rangeland Journal, 31(2), 251–258. https://doi.org/https://doi.org/10.1071/RJ09011
- SWEEP. (2019). Water for food security and women empowerment and environmental protection.
- Teshome, K. (2016). Addis Ababa university school of graduate studies valuing alternative resource management practices to improve ecosystem services in the Midland and Lowland communities in Bale Eco-Region: Application of choice modeling. http://localhost:80/xmlui/handle/123456789/14974
- UNCCD (United Nations Convention to Combat Desertification). (2015). Combating desertification/land degradation and drought for poverty reduction and sustainable development: The contribution of science, technology, traditional knowledge and practices. Committee on Science and Technology Fourth special session.
- Vaiknoras A Norton, Jeffrey Alwan and Kate, (2015).Study on Farmer Preferences for Attributes of Conservation Agriculture in Eastern Uganda. African Journal of Agricultural and Resource Economics, 101, 158–173.
- Yibrie, A. (2011). valuing the economic benefit of ecotourism areas with travel cost and choice experiment. Addis Ababa Unversity school of grduation.