
 ?Mathematical formulae have been encoded as MathML and are displayed in this HTML version using MathJax in order to improve their display. Uncheck the box to turn MathJax off. This feature requires Javascript. Click on a formula to zoom.
Abstract
This study examined the diversity, distribution and abundance of fish species in Upper Awash River, Ethiopia was assessed. Five sampling sites were selected along the gradient of the river. Fish sampling was carried out using Frame net of 3-mm stretched mesh size from February through April, 2018. There was a considerable variation in river depth and width at all sites. A total of 3018 fish categorized under three species belonging to the Family Cyprinidae, namely, Garra quadrimaculata, Garra dembeensis and Labeobarbus beso were identified. Garra quadrimaculata was numerically the most dominant species in all sampling sites. Perhaps, there was no fish specimen caught from S-I. Similarly, the highest and lowest number of G. dembeensis was collected from S-V (42.73%) and S-II (2.51%), respectively. The composition of L. beso was higher at S-IV (49.1%), but no L. beso collected from S-I and S-II. High number of fish was caught from the pool parts at all sites. Shannon diversity index (H’) varied between 0.14 and 0.80, and evenness index (J’) varied from 0.2 to 1.7, but H’ and J’ of S-I were zero due to the absence of species in the area. Based on Shannon index, the upper Awash River was categorized as an impacted river. Therefore, effective management of the river is very imperative for sustainable utilization of fish resources.
PUBLIC INTEREST STATEMENT
Fish and shellfish are one of the aquatic resources with excellent protein content, and it is highly contributing to the food security. These diversities are, however, highly threatened by natural and human factors. Ethiopia is one of the tropical countries richest in diversified fish species. However, the resources are not well exploited and the contribution of fishes in food security is not significant. Particularly, the role of aquaculture is at its infant stage. This is due to the limited scientific information on the available diversities and their biology characteristics. It is from this background that this study is tried to investigate the diversity, distribution and abundance of fish species in the Upper Awash River basin. The finding revealed that the diversity, distribution and abundance of the fish species is highly influenced by anthropogenic and natural factors in this basin, and this information is a guarantee for using the fish stocks in aquaculture.
1. Introduction
Rivers and streams show signs of surprising phenomena with physical, cultural and psychological expression in life of human beings; they bring life and death, civilization and devastation, opportunity and risks and also used as shelter and feeding opportunities for a wide range of organisms like fish, insects, plants, mollusks, birds and mammals (Anderson et al., Citation2019). They carry water from the mountains to the sea, fueling the water cycle coupling land, ocean and the atmosphere (Karr, Citation1999). They are also the most suitable media to clean, disperse, transport and dispose of wastes from domestic and industries, drainages and irrigation to the water bodies, and change the appearance and quality of water bodies (Meybeck et al., Citation1996). However, river systems throughout the world have been disturbed by a wide variety of anthropogenic activities particularly large rivers have been subjected to dramatic physical alterations which ultimately reduced the diversity and abundance of riverine fish assemblages (Madejczyk et al., Citation1998).
Ethiopia is endowed with numerous water bodies including lakes, rivers, reservoirs and some wetlands. It has about 7334 km2 of major lakes and reservoirs, and 8065 km length of rivers within the limits of Ethiopia (Tesfaye & Wolff, Citation2014). Although Ethiopia is presently separated from both East African and South Arabian mountains (Tudorancea et al., Citation1999), two main biogeography units called Nilo-Sudan and East Coast ichthyofaunal provinces are in contact to this region (Vijverberg et al., Citation2012). This made the freshwater fish fauna of Ethiopia to have a mixture of Nilo-Sudanic, East African and endemic fish forms (Getahun, Citation2005). Nilo Sudanic form which includes the genera of Alestes, Bagrus, Barilius, Citharinus, Hydrocynus, Hyperopisus, Labeo, Malapterurus and Mormyrus is the highly dominant fish in BaroAkobo Basin followed by Webi-Shebele and Omo-Gibe basins (Golubtsov et al., Citation1995).
BaroAkobo Basin is the richest in fish diversity, which could be attributed to the presence of diverse and rich habitats, and the past and present connection with other systems (east and central Africa) (Getahun, Citation2002). In other way, endemicity seems to be highest in AbayBasin (most of them are in Lake Tana due to flock L. barbus and Garra) followed by Ethiopian Rift Valley lakes and Awash Drainage Basins (Golubtsov & Mina, Citation2003).
Fishes of the high mountains torrential streams are largely Cyprinidae, which adapted to live in the swiftly flowing floodwaters that occur seasonally (Getahun & Stiassny, Citation1998). Two genera of fishes (Barbus spp. and Garra spp.) dominated the fish fauna of the highland streams. It has been indicated that fish species diversity decreases with an increase in altitude (Golubtsov & Mina, Citation2003). Elevation, water temperature and the stream size are the important factors for explaining the longitudinal patterns of fish distribution (Brunger et al., Citation2005). Virtually, all studies of longitudinal changes in fish fauna have focused solely on the patterns of fish species richness, and absence or presence of fish species. However, the study of relative abundance and distribution can provide more insight into the factors that affect the structures of fish species (Hubbel, Citation2001). Moreover, the species relative abundance and distributions vary in relation to faunal isolation, speciation rates, community size and size of regional fauna (Hubbel, Citation2001; Magurran, Citation2005).
Many of the drainage basins of Ethiopia, especially the rivers, are not exhaustively explored. In addition, knowledge on diversity, population structure and distribution of fish species in these drainage basins has been poorly known (Getahun, Citation2005). Relatively a large number of small, medium and even large rivers have not been well studied including the present study area on its fish composition in relation to its volume. Information on the available habitats both in quality and quantity can perhaps be obtained based on our knowledge on this information. The composition of fish species related to the scope of water volume should be thus fully known for the management and sustainability of the resources. Similarly, very limited studies have been conducted on fish species in the upper Awash Basin. This study was, therefore, initiated to fill the knowledge gap on assessing the diversity, distribution and abundance of fish species in Upper Awash River Basin, Western Shoa Zone, Ethiopia.
2. Materials and methods
2.1. Description of the study area
The study was conducted at the Upper Awash River Basin in Dandi District, which is located 75 km away from the capital Addis Ababa toward the west direction in West Shoa Zonal Administration, Oromia Regional State, Ethiopia. Dandi District has a total area of 109,729 ha with an altitudinal range from 2000–3200 m.a.s.l. It has a tropical climate condition. The mean temperature and rainfall of the area is 16.5°C and 1409.5 mm, respectively (Dandi District RDO, 2010, unpubl. data). The rainfall distribution is bimodal: a short rainy season from March to April and the main rain season from June to September with mean annual rainfall of 1100 mm.
The district is well known for its richest water resources like Awash River and Dandi Lake. Awash River Basin covers a catchment area of 110,000 km2 and serves as home for 10.5 million people. Based on physical and socio-economic factors, Awash Basin is divided into Upland (all lands above 1500 m a.s.l.), Upper Valley, Middle (area between 1500 m and 1000 m a.s.l.), Lower Valley (area between 1000 m and 500 m a.s.l.) and Eastern Catchment (closed sub-basin between 2500 m and 1000 m a.s.l.). The river is perennial, the water level and flow rate decline drastically during the dry season. The discharge fluctuates concurrently with the rainfall intensity. The maximum volume of the river is in the months from July to September; it reaches its peak in August (16.3 m/s) and lowest in December (0.16 m/s). Catchment of the river is entirely used for mixed agricultural activities (Shawul et al., Citation2019).
2.2. Study design and sample site selection
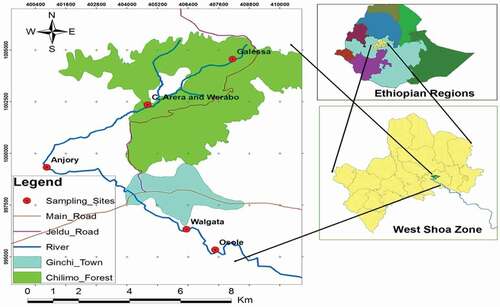
Preliminary survey was made in December, 2017, in order to have the topography and anthropogenic activities information in the basin for sample site selection. Based on physical, chemical, biological and land-use information obtained during the observation, five sampling stations were selected for primary data collection. The sampling stations were selected along the longitudinal zonation of the river and designated as; Station I (Galessa), Station II (Arera), Station III (Anjory), Station IV (Walgata) and Station V (Osole). Sampling stations were classified following the rapid bioassessment protocol criteria (Barbour et al., Citation1999) based on major stressor around the river.
2.2.1. Station I (S-I)
This site is located at upper Awash River at the base of Galessa Stream where there is less human settlement and other activities and few domestic animals sometimes grazing in the area. There is natural vegetation around the station. The Galessa Stream is located in the Gare Arere peasant association in Chillimo forest. Activities such as grazing and deforestation are not common and water is comparatively less polluted in this area. The site is considered as a reference site.
2.2.2. Station II (Arera)
This is located at the confluent point of Arera and Warabbostreams, which are found in the Gare Arere peasant association. At this station, there are some natural vegetation and scattered eucalyptus trees, which are planted at the river bank. There is a scattered human settlement nearby and natural and artificial forest. Activities such as agriculture, grazing and bathing are common in this site. This site is relatively less impacted as compared with the remaining three stations.
2.2.3. Station III (Anjory)
This is located in Arere Kure peasant association, at the back of China camp close to Ginchi town below the point where Kerensa Stream joins Awash River. This site is totally surrounded by grazing lands. The structural habitat of the river is dominated by mesolithic and macrolithal stones at riffle, and by sand and mud at the pool area of the site. Anthropogenic activities such as farming and grazing, cattle watering, bathing, car and washing are common practices in the area. This area is highly impacted as compared to S-I and S-II.
2.2.4. Station IV (Walgata)
This is located below the paper mill Wamara Saqo peasant association, below the town and is polluted by the effluent discharged from the paper mill industry and from Ginchi town. The area is highly covered with immense agricultural activities and no vegetation coverage at the river bank. Anthropogenic activities such as farming and grazing, herbicide spraying, washing clothes, cars and bathing are also common activities and the site is considered as highly impacted. The structural habitat of the river is dominated by mesolithal at riffle; and sand and mud at pool parts of the site.
2.2.5. Station V (Osole)
This is located one to two km away from the fourth site, which is totally surrounded by agricultural activities. It was characterized by high human settlement from the right side and Ginchi town from the left side.
Finally, geographic position and altitude of the study stations were measured using Global Position System (GPS 76S) in order to demarcate the study stations ( and ).
Table 1. The selected sampling stations and morphometric features of Upper Awash River basin with their GPS coordination
Figure 1. Map of the study area showing the sampling stations in Upper Awash River
3. Collection and analysis of physico-chemical parameters
At each sampling site, water samples were collected on a monthly basis for a period of three consecutive months (February 2018 through April, 2018). The water samples were collected between 11:00 and 12:00 am to avoid the effect of diurnal variations. The procedure described in APHA (Citation1998) was followed for the collection of water samples. The parameters, like temperature, pH and conductivity, were measured in situ using digital probes. The major nutrients like Nitrate and Total Phosphorus were also analyzed at Ambo University, chemistry laboratory using spectrophotometer (AOAC, Citation1998). Habitat characteristics were assessed visually, and then width, depth and length of the selected pools and riffles were measured by plastic 100 m.
4. Collection of fish samples
Fish samples were collected monthly between February and April, 2018 from each site (pools and riffles) using frame net mesh size of 3 mm with total area of 4.6 m2. This frame net was pulled by two persons from each side of the net end from downstream to upstream to collect fish from the pool of each station. To collect fish from riffle, a frame net was fixed at the downstream of the selected riffle of each site held by two persons and the third person disturb the fish from upstream of that riffle chasing the fish towards the fixed frame net. The collected fish samples were preserved in 5% formalin and identified to the family and species level in Biology laboratory, Ambo University with the help of standard reference keys (Habteselassie, Citation2012). The fish samples were measured for their total length and total weight using measuring board and sensitive balance, to the nearest to 0.1 cm and 0.1 gm, respectively.
5. Determination of species composition
The relative abundance of fish species was calculated as:
The dominance was also expressed as the percentage of corresponding species in the total number of individuals captured during the whole study period. Fish diversity indices were calculated as per standard method (Shannon & Weaver, Citation1963), which explains both variety and abundance of fish species (Næsje et al., Citation2004). This was calculated as:
H` = Shannon-Wiener indices of fish diversity, ni = Total number of individuals of a species and N = Total number of individuals of all species.
In addition, Evenness (J’) for Shannon diversity index (H’) was calculated from equation:
, Where:
S= number of species (spp. richness)
H` max = the maximum value of Shannon index
J =Evenness based on Shannon index
Dominance (D2) for the most abundant species was also calculated as:
where pi is the proportion of the total sample represented by the ith species (Kwak & Peterson, Citation2007).
6. Data analysis
The data collected were stored in MS Excel 2010; a variety of subjects were analyzed by combining quantitative and qualitative data analysis techniques. Descriptive statistics was used to summarize and analyze the collected data. SPSS version 21 was used to do descriptive and inferential analysis. One-way ANOVA was used to assess the physico-chemical parameters and general habitat difference among the study sites.
7. Results
7.1. Physico-Chemical Parameters
The physico-chemical parameters of the five sampling sites of the upper Awash River Basin are presented in . The pH of water samples ranged between 8.2 and 8.8 with the mean pH of 8.7. The minimum mean pH of the water (8.5 ± 0.465) was recorded at S-I Site and the maximum mean pH was recorded at S-III (8.8 ± 0.7) and S-V (8.8 ± 0.4). The dissolved oxygen content of the water samples was found in the range of 6.7 to 9.4 mg/L. The higher mean dissolved oxygen content was recorded at S-V (8.4 ± 1.0 mg/L) and the lowest mean value was observed at S-II (7.4 ± 0.7) and S-III (7.4 ± 0.841 mg/L), respectively. The water temperature also varied between 11.8 and 24.6°C. The maximum and minimum mean water temperature was recorded at S-V (23.4 ± 1.0°C) and S-I (12.7 ± 0.6°C), respectively. The electrical conductivity of the water samples also ranged between 169.1 and 496.4 µS/cm. The mean electrical conductivity also increased downstream with the lowest mean value recorded at S-I (187.7 ± 1.8 µS/cm) and the highest value recorded at S-V (495.4 ± 1.0 µS/cm). The nitrate content was also found in the range of 0.1 to 0.9 mg/L. Mean nitrate content was highest in S-III (0.8 ± 0.04 mg/L) and lowest at S-I (0.1 ± 0.02 mg/L). The phosphorus content was between 0.04 and 0.6 mg/L. The highest mean total phosphorus content was recorded at S-III (0.3 ± 0.4 mg/L) and the least content was measured at S-I and S-II, respectively. Except for water temperature and electrical conductivity (p < 0.05), the results did not show a significant difference of water parameters among the study sites (p > 0.05).
Table 2. Some physico-chemical parameters (mean ± SD) and range of waters samples collected from five sampling stations
7.2. General habitat characteristics of the river
There was a considerable variation in river depth between the sampling stations. The result showed a significant difference in water depth among the riffle and pool units of all sampling sites (p < 0.05), but no significant difference observed between the upper and lower part of the river segments (p > 0.05). The river width also varied significantly among the stations (p < 0.05), where the down parts of the river (S- III, S-IV and S-V) were wider than the upstream stations (S-I and S-II). The reference station, S-I is much narrower than any of the other lower stations. There was also altitude, substrate type and substrate composition variation between the study sites. The reference and less impacted stations (S-I and S-II) were predominated by rocks, fine sediments and gravels, whereas the down parts of the river (S-III, S-IV and S-V) were dominated by fine sediments, rocks and macrophytes ().
7.3. Diversity and relative abundance of fish species
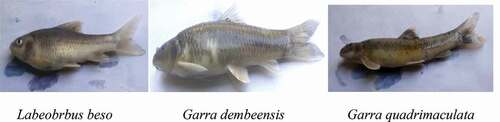
A total of 3018 fish samples belonging to three species under the family Cyprinidae were identified from the upper Awash River Basin. Garra quadrimaculata (Rüppell 1836) (55.70%) were the most dominant fish species in the study area followed by Garra dembeensis (Rüppell 1836) (39.63%). In general, there is no fish collected from S-I (Galessa) Site (; ).
Table 3. Diversity of fish species in Upper Awash River Basin
Figure 2. The sketch of fish species collected from the study sites
7.4. Distribution and relative abundance of fish species
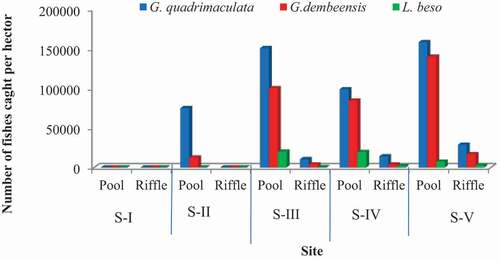
The total number of fishes caught in the present study varied between the sampling sites. Except for S-I, fish samples were caught from all other four sites (S-II, S-III, S-IV and S-V). High numbers of G. quadrimaculata were collected from S-V Site (34.86%) followed by S-III (29.63%) and Site-IV 24.63%), respectively. Similarly, high numbers of G. dembeensis were collected from S-V (42.73%) followed by S-IV (29.68%), whereas the least number were collected from S-II (2.51%). In other ways, there was high number of L. besowas collected from S-IV (49.1%) followed by S-III (33.3%), but there is no L. beso collected from S-I and S-II (). Generally, the total number of fish caught increased downstream up to S- III, declined at S-IV, and then increased at Station-V. The total fish specimens were collected from the fifth site ().
Table 4. Diversity and relative abundance of fish species in all sites of Upper Awash River
7.5. Fish composition by habitat type
The number of fish samples collected from pool and riffle parts of the river has shown a considerable variation among the study sites. In general, a high number of fishes were caught from the pool parts at all the study sites ().
Figure 3. The composition of fish samples collected from riffle and pool habitats of the five sampled sites in the upper Awash River Basin (S-I, S-II, S-III, S-IV and S-V indicate the sampling sites)
7.6. Fish diversity indices
Comparisons between the study sites showed a variation in Shannon diversity indices (H’). H’ was zero for Galessa Stream (S-I), since there was no fish caught from the base of the stream up to the confluence of Arera and Werabo. Shannon diversity index was calculated starting from S- II to S-V. From the calculated Shannon diversity index, the value of Hʹ was highest at S-IV (Walgata) (0.80) and the least was at S-III and S-V, whose values were equal (0.14). Except for S-I and S-II, whose species richness was 0 and 2, respectively, the other three sites (Anjory, Walgata and Osole) showed similar species richness (3 species each). Evenness of fish species in all four sites was also calculated based on Shannon’s diversity index. Lower the value of the calculated evenness index, the less the evenness of the species is in that habitat. Based on this, S-IV was relatively more even than the other three stations, which showed similarity in evenness of fish species ().
Table 5. Species diversity index and richness in present stations of upper Awash River
8. Discussion
8.1. Physico-chemical parameters of the water
Physico-chemical parameters recorded in this study indicated slightly a good quality of water at upper Awash River, which is similar with the earlier reports made in different rivers in Ethiopia (Gebremariam, Citation2002; Kebede et al., Citation1994). Variation between stations was not significantly different (p > 0.05) except for conductivity, which was highest in lower sites. This could be associated with the degree of anthropogenic activities in some parts of the lower area (Eliku & Leta, Citation2018).
The mean dissolved oxygen content recorded in all sites (8.07 mg/L) was higher than the minimum requirements for fish survival and normal functioning under the natural systems (5 mg/ L) (Franklin, Citation2013). The recorded pH was slightly alkaline, but it is still within the optimum range for survival of fish (6.5–8.2) (Campbell & Wildberger, Citation1992). The temperature recorded also falls within the WHO recommendation for normal functioning of aquatic life (12–25°C) (Edition, Citation2011). Perhaps, it was lower than the temperature reported from Guder River (23.2 to 25.6°C) (Garomsa, Citation2017). This might be attributed to the difference of data collection time (morning, versus afternoon) (EPA (U.S. Environmental Protection Agency), Citation2003).
The mean electrical conductivity range recorded in all sites (187.65 ± 1.84 to 495.39 ± 1.02 µS/cm) was lower than the result reported from Guder River (326 ± 7.54 to 608.67 ± 168.62 μs/cm) (Garomsa, Citation2017), Modjo River (910 ± 186.6 µS/cm) (Sitotaw, Citation2006), Debbis River (922 ± 12.29 µS/cm) (Urga et al., Citation2017) and Lake Hayq (900.6 µS/cm) (Alemayehu, Citation2009). This variation might be attributed to the extent of effluents dumped directly into the rivers from domestic and industrial wastes (Tesfaye, Citation2010). The highest mean electrical conductivity recorded at S-IV and S-V might also be associated with the effluent discharged from the paper mill industry and mining practices close to the sampling sites. It is also within the WHO recommendation for electrical conductivity for aquatic organisms survival (400 μS/cm) (WHO, Citation2008).
The highest mean values of nitrates and phosphorus recorded at S-III could be associated with the high number of animals commonly grazing around the sites. These animals deposit their dung either directly into the water or nearby the fields, which is easily washed into the river. The deposition of nitrate and phosphate rich animal’s dung in turn increases the level of these nutrients in the river water (Tesfaye, Citation2010). However, the value of nitrate recorded in all sites was still below the maximum limit (5 mg/ L) for aquatic fauna (Chapman & Kimstach, Citation1996), the total phosphorus was, however, slightly higher than the maximum permissible limit in the water (0.005 to 0.02 mg/ L) (EPA (U.S. Environmental Protection Agency), Citation2003). The result of nitrate and phosphorus obtained in this study was lower than the report made from Debbis River (1.965 mg/ L and 7.89 mg/L, respectively) (Urga et al., Citation2017). This could be associated with the extent of nutrients inputs from the surrounding area (Guignard et al., Citation2017).
8.2. Relative Abundance and Diversity of Fish
Over 78 Garrasspecies have been so far described from Asia and Africa (Zhang, Citation2005), of which 17 are in Africa and 11 of them are from Ethiopia41. According to Stiassny and Getahun (Citation2007), they are adapted to live in slow flowing and less polluted streams. In this study, a total of 3018 fish specimens belonging to three species of the family Cyprinidae were caught from all four sample sites, excluding Station-I. Compared with the previous report from the middle Awash River (five Cyprinidae species) (Abebe, Citation2016), the number of fish species caught in the present study was relatively lower (only three species). The species richness increased from upstream to downstream which is also confirmed in the finding of Wubie et al. (Citation2017). According to Golubtsov and Mina (Citation2003), altitude difference is the main determinant factor that affects the fish community structure in most river basins in Ethiopia.
The results obtained in this study also revealed the marked difference in diversity, abundance, and distribution of fish species among the sampling sites. These differences appeared to be related primarily to the habitat conditions and secondarily to the influence of environmental factors such as human-induced pollutants, natural topography of the area and relative tolerance of the fish fauna to the sites (Hashemi et al., Citation2015). Even though the upper site S-I in Galessa stream possesses good water quality, there was no fish caught from the area. This may be mainly linked with the low water volume, narrow width of the stream which is not easy for free movement of fishes (Bruno et al., Citation2013) and mean temperature of the site (which was not greater than 12.687 ± 0.552°C), consequently not preferable for tropical fishes to survive and reproduce (Eric, Citation2011). In addition, there are large stones before the confluence of Arera and Werabo on the way up to Galessa Stream which may block the fish from migrating upstream. According to Hubbel (Citation2001), the geographical barriers like forests, stones and bridges could be the reason for limiting the movement of fish in the water. Previous investigators also reported that fish assemblage can be affected by stream order, network position and uncontrolled waste disposal to the river (Rahel & Hubert, Citation1991).
Garra quadrimaculata was highly abundant at all sampling sites and this indicates that the species can tolerate the pollution of water, environmental factors like low or high temperature, conductivity, pH and others. The study indicates that genus Garra is found distributed throughout Asia and Africa, but 60% of the African species exist in Ethiopia and most of them are endemic (Krysanov & Golubtsov, Citation1992). According to Stiassny and Getahun (Citation2007), Garra spp. are highly resistant fish that live in hard flow and slightly polluted rivers. However, S-IV which is located below the paper mill industry had low total fish caught and biomass though it has higher volume of water at pool habitat in comparison with S-III. This shows that the discharges dumped to this site are seriously affecting the fish population, which could also affect the survival and growth of fish species in the river (Bukola et al., Citation2015).
Most of the fish species were collected from pool habitats, which could be related to the suitability of pool habitat for fish to survive well because of its depth, low velocity and high water volume. Similarly, Wubie et al. (Citation2017) stated that riffle habitat supports less species diversity than pool habitats as result of change in water temperature, high flow velocity, turbidity, allochthonous nutrient inputs and food resources availability. On the other hand, during the dry season when flow of the water is low or volume of the water is low, the fish is trapped in very small shallow pools that causes stress on fish and make them very visible to the predators, and only very tolerant fish species such as Cyprinidaeand Clariidae can survive in seasonal and swiftly flowing rivers (Ahn et al., Citation2019). In correlation to this, S-II has less volume of pool habitat, which stresses the fish and exposes them to predators. This may be why only tolerant species like G. quadrimaculata and G. dembeensis were caught in the upper sites.
The Shannon diversity index was highest in S-IV and lowest in S-III and S-V, respectively. Even though the number of fish species is only two in S-II, the diversity index was the second largest, which is attributed to the evenness of fish species in this site (Muchlisin & Siti-Azizah, Citation2009). The diversity indices at all sampling sites were relatively low due to the occurrence of few numbers of species in the area. Generally, H` is the value that combines species diversity and evenness, where >3.99 is considered as non-impacted; 3.00–3.99 slightly impacted; 2.00–2.99 moderately impacted and <2.00, severely impacted (Namin & Spurny, Citation2004). Based on this category, the Upper Awash River Basin is categorized as a severely impacted river. The evenness index (J`) values also ranged between 0.3 and 1.7, revealing that the distribution of fish species at the sampling sites was not even (Jost, Citation2010).
9. Conclusion and recommendation
The present study reveals that though there is no significant variation in physico-chemical parameters among the study sites, there is an indication of water pollution in some sites, which might cause the variation in species distribution. The diversity of fish species in the present study is also low compared to other highland rivers, which could be associated with river ecology, water chemistry and temperature.The observation of Garra species in the river indicates the ability of the fish to adapt in small volume and polluted river water. The difference in fish composition among the study sites is also indicative of the habitat variation among the study sites. This calls for an effective management of the river for sustainable conservation and utilization of its resources in the future.
Acknowledgements
The authors would like to acknowledge Ambo University for the financial and logistics support. We would also like to thank the co-workers involved in data collection. In addition, we are very grateful for stakeholders in different administrative positions of Dandi District and the local community who helped in the success of the research project.
Disclosure Statement
The authors declared that we have no conflict of interest.
Additional information
Funding
Notes on contributors

Bacha Temesgen
Bacha Temesgen has MSc Degree in Fisheries and Aquaculture from Ambo University, Ethiopia. Currently, he is the lecturer and researcher at the Department of Fisheries and Aquatic Sciences, Wollega University, Shambu Campus, Ethiopia.
Zenebe Tadesse
Zenebe Tadesse has PhD Degree in Fisheries and Aquatic Sciences from Addis Ababa University, Ethiopia. Currently, he is Associate Professor and Senior Researcher in fisheries sciences at Sebeta National Fisheries and Other Aquatic Life research center, Ethiopia.
Mathewos Temesgen
Mathewos Temesgen has PhD Degree in Fisheries and Aquatic Sciences from Addis Ababa University, Ethiopia. He is Assistant Professor of Fisheries and Aquatic Science at the Department of Biology, Ambo University, Ethiopia.
References
- Abebe, G. (2016). Studies on the diversity, relative abundance and feeding habits of fish in the Upper River Awash Basin, Ethiopia.M.Sc. thesis, Department of Biology, Ambo University 67 p.
- Ahn, C. H., Lee, S., Song, H. M., Park, J. R., & Joo, J. C. (2019). Assessment of Water Quality and Thermal Stress for an Artificial Fish Shelter in an Urban Small Pond during Early Summer. Water, 139, 1–13.
- Alemayehu, E. (2009). Some aspects of the biology of Garradembecha [Pisces: Cyprinidae] andClariasgariepinus[Pisces: Clariidae] in Lake Hayq, Ethiopia. PhD Dissertation, Department of Zoology, Addis Ababa University, Addis Ababa 230 p.
- Anderson, E. P., Jackson, R. E., Tharme, M., Douglas, J. E., Flotemersch, M., Zwarteveen, S., Lokgariwar, C., Montoya, M., Wali, A., Tipa, G. T., Jardine, T. D., Olden, J. D., Cheng, L., Conallin, J., Cosens, B., Dickens, C., Garrick, D., Groenfeldt, D., Kabogo, J., Roux, D. J., … Arthington, A. H. (2019). Understanding Rivers and their social relations: A critical step to advance environmental water management. Wires Water, 6(6), 1–21. https://doi.org/https://doi.org/10.1002/wat2.1381
- AOAC. (1998). Official Methods of Analysis.Association of Official Analytical Chemists, Arlington, USA. https://doi.org/https://doi.org/10.1093/jaoac/81.1.323. 771 p.
- APHA. (1998). Standard methods for the examination of water and wastewater. (20th.). American Public Health Association, American Water Works Association and Water Environmental Federation. 1546
- Barbour, M. T., Gerritsen, J., Snyder, B. D., & Stribling, J. B. (1999). Rapid bioassessment protocols for use in streams and wadeable rivers: Periphyton, benthic macroinvertabrates and fish. In . U.S. Environmental Protection Agency (2nd ed., pp. 344). Office of Water.
- Brunger, L. T. S., Hubert, W. A., & Rahel, F. J. (2005). Relationships of elevation, channel slope, and stream width to occurrences of native fishes at the Great Plains-Rocky Mountains interface. Journal of Freshwater Ecology, 20(4), 695–705. https://doi.org/https://doi.org/10.1080/02705060.2005.9664793
- Bruno, D. O., Barbini, S. A., Astarloa, J. M. D., & Martos, P. (2013). Fish abundance and distribution patterns related to environmental factors in a choked temperate coastal lagoon (Argentina). Brazilian Journal Oceanography, 61(1), 43–53. https://doi.org/https://doi.org/10.1590/S1679-87592013000100005
- Bukola, D., Zaid, A., Olalekan, E. I., & Falilu, A. (2015). Consequences of Anthropogenic Activities on Fish and the Aquatic Environment. Poultry, Fishery and Wildlife Science, 3, 138.
- Campbell, G., & Wildberger, S. (1992).The monitor’s handbook.LaMotte Company, Chestertown, Maryland, USA, 71.
- Chapman, D., & Kimstach, V. (1996). Water quality assessments: A guide to the use of biota, sediments and water in environmental monitoring (2nd ed., pp. 126). E & FN Spon press.
- Edition, F. (2011). Guidelines for drinking-water quality. WHO Chronology, 38(4), 104–108.
- Eliku, T., & Leta, S. (2018). Spatial and seasonal variation in physicochemical parameters and heavy metals in Awash River, Ethiopia. Applied Water Science, 8(6), 177. https://doi.org/https://doi.org/10.1007/s13201-018-0803-x
- EPA (U.S. Environmental Protection Agency). (2003). A summary of general assessment factors for evaluating the quality of scientific and technical information. Science Policy Council, U.S, Environmental Protection Agency.
- Eric, W. (2011). Effect of increased water temperature on warm water fish feeding behavior and habitat use. Journal of Undergraduate Research at Minnesota State University, Mankato, 11, 1–13
- Franklin, P. A. (2013). Dissolved oxygen criteria for freshwater fish in New Zealand: A revised approach.New. Zealand Journal of Marine and Freshwater Research, 48(1), 112–126. https://doi.org/https://doi.org/10.1080/00288330.2013.827123
- Garomsa, F. (2017). Studies on the diversity and some aspects of the biology of fishes in Guder River and its tributary Cholle stream, Ethiopia.M.Sc. thesis, Department of Biology, Ambo University 76 p.
- Gebremariam, Z. (2002). The Ethiopian rift valley lakes, major threats and strategies for conservation. In C. Tudorancea (Ed.), Ethiopian Rift Valley Lakes (pp. 259–271). Euro Net.
- Getahun, A. (2002). The Nile basin: Riverine fish and fisheries (pp. 19). Department of Biology, Addis Ababa University press.
- Getahun, A. 2005. Freshwater Eco-regions of Ethiopia. J. Theime, et al., Eds., Freshwater eco-region of Africa, A conservation assessment/ Island press. 40–67.
- Getahun, A., & Stiassny, M. L. (1998). The freshwater biodiversity crisis: The case of the Ethiopian fish fauna. SINET: Ethiopian Journal of Science, 21(2), 207–230.
- Golubtsov, A. S., Darkov, A. A., Dgebuadze, Y. Y., & Mina, M. V. (1995). An artificial key to fish species of the Gambela region (the White Nile basin in the limits of Ethiopia) (pp. 98). Joint Ethio-Russ BiolExpeJerde.
- Golubtsov, A. S., & Mina, M. V. (2003). Fish species diversity in the main drainage systems of Ethiopia: Current state of knowledge and research perspectives. Ethiopian Journal of Natural Resources, 5(2), 281–318.
- Guignard, M. S., Leitch, A. R., Acquisti, C., Eizaguirre, C., Elser, J., Hessen, D. O., Jeyasingh, P. D., Neiman, M., Richardson, A. E., Soltis, P. S., Soltis, D. E., Stevens, C. J., Trimmer, M., Weider, L. J., Woodward, G., & Leitch, I. J. (2017). Impacts of nitrogen and phosphorus: From genomes to natural ecosystems and agriculture. Frontiers Ecological Evolution, 5, 12–20.
- Habteselassie, R. (2012). Fishes of Ethiopia.Annotated checklist with pictorial identification guide. Ethiopian Fisheries and Aquatic Science Association (pp. 250). Addis Ababa.
- Hashemi, S. A., Ghorbani, R., Kymaram, F., Hossini, S. A., Eskandari, G., & Hedayati, A. (2015). Fish species composition, distribution and abundance in Shadegan Wetland. Fishery and Aquatic Journal, 6, 128–134.
- Hubbel, S. (2001). The Unified Neutral Theory of Biodiversity and Biogeography (MPB-32). Princeton University Press.
- Jost, L. (2010). The relation between evenness and diversity. Development, 2, 207–232.
- Karr, J. R. (1999). Defining and measuring river health. Freshwater Biology, 41(2), 221–234. https://doi.org/https://doi.org/10.1046/j.1365-2427.1999.00427.x
- Kebede, E., Mariam, Z. G., & Ahlgren, I. (1994). The Ethiopian Rift Valley lakes: Chemical characteristics of a salinity-alkalinity series. Hydrobiology, 288(1), 1–12. https://doi.org/https://doi.org/10.1007/BF00006801
- Krysanov, E. Y., & Golubtsov, A. S. (1992). Karyotypes of three Garra species from Ethiopia. Journal of Fish Biology, 42(3), 465–467. https://doi.org/https://doi.org/10.1111/j.1095-8649.1993.tb00350.x
- Kwak, T. J., & Peterson, J. T. (2007). Community indices, parameters, and comparisons. In C. S. Guy & M. L. Brown (Eds.), Analysis and interpretation of freshwater fisheries data, Bethesda (pp. 677–763). MD. American Fisheries Society.
- Madejczyk, J. C., Mundahl, N. D., & Lehtinen, R. M. (1998). Fish assemblages of natural and artificial habitats within the channel border of the upper Mississippi River. The American Midland Natural, 139(2), 296–310. https://doi.org/https://doi.org/10.1674/0003-0031(1998)139[0296:FAONAA]2.0.CO;2
- Magurran, A. E. (2005). Species abundance distributions: Pattern or process? Pattern or Process? Functional Ecology, 19(1), 177–181. https://doi.org/https://doi.org/10.1111/j.0269-8463.2005.00930.x
- Meybeck, M., Kimstach, V., & Helmer, R. (1996). Strategies for water quality assessment. In Water Quality Assessments: A Guide to the Use of Biota, Sediments and Water in Environmental Monitoring (2nd ed., pp. 57). Chapman and Hall.
- Muchlisin, Z. A., & Siti-Azizah, M. N. (2009). Diversity and distribution of freshwater fishes in Aceh Waters, Northern Sumatera, Indonesia. International Journal of Zoological Research, 5(2), 62–79. https://doi.org/https://doi.org/10.3923/ijzr.2009.62.79
- Næsje, T. F., Hay, C. J., Nickanor, N., Koekemoer, J. H., Strand, R., & Thorstad, E. B. (2004). Fish populations, gill net catches and gill net selectivity in the Kwando River, Namibia. NINA Project Report, Namibia, 64 p.
- Namin, J. I., & Spurny, P. (2004). Fish community structure of the middle course of the Becva River. Czech Journal of Animal Science, 49(1), 43–50. https://doi.org/https://doi.org/10.17221/4270-CJAS
- Rahel, F. J., & Hubert, W. A. (1991). Fish assemblages and habitat gradients in a Rocky Mountain–Great Plains stream: Biotic zonation and additive patterns of community change. Transactional American Fisheries Society, 120(3), 319–332. http://2.3.CO;2https://doi.org/https://doi.org/10.1577/1548-8659(1991)120<0319:FAAHGI>2.3.CO;2
- Shannon, C. E., & Weaver, W. (1963). The Mathematical Theory of Communication, 1st (pp. 55). University of Illinois Press.
- Shawul, A. A., Chakma, S. A., & Melesse, M. (2019). The response of water balance components to land covers change based on hydrologic modeling and partial least squares regression (PLSR) analysis in the Upper Awash Basin. Journal of Hydrology and Regional Studies, 26, 2019. https://doi.org/https://doi.org/10.1016/j.ejrh.2019.100640
- Sitotaw, B. (2006). Assessment of benthic macroinvertebrate structures in relation to physicochemical parameters. M.Sc. thesis, Department of Biology, Addis Ababa University, Addis Ababa 145 p.
- Stiassny, M. L., & Getahun, A. (2007). An overview of Labeonin relationships and the phylogenetic placement of the Afro-Asian genus Garra Hamilton, 1922 (Teleostei: Cyprinidae), with the description of five new species of Garra from Ethiopia, and a key to all African species. Zoological Journal of Linnean Society, 150(1), 41–83. https://doi.org/https://doi.org/10.1111/j.1096-3642.2007.00281.x
- Tesfaye, G., & Wolff, M. (2014). The state of inland fisheries in Ethiopia: A synopsis with updated estimates of potential yield. Ecohydrology and Hydrobiology, 14(3), 200–219. https://doi.org/https://doi.org/10.1016/j.ecohyd.2014.05.001
- Tesfaye, T. (2010). Groundwater Potential Evaluation Based on Integrated GIS and Remote sensing Techniques. Bilate River Catchment: South Rift Valley of Ethiopia. American Scientific Research Journal for Engineering, Technology and Science, 10(1), 85–120.
- Tudorancea, C., Zinabu, G. M., & Elias, D. (1999). Limnology in Ethiopia. Limnology Development, 2, 63–118.
- Urga, K. T., Prabhadevi, L., & Tedesse, Z. (2017). Diversity and biology of fishes in the River Debbis, Ethiopia. International Journal of Aquaculture, 7(20), 1–8.
- Vijverberg, J., Dejen, E., Getahun, A., & Nagelkerke, L. A. J. (2012). The composition of fish communities of nine Ethiopian lakes along a north-south gradient: Threats and possible solutions. Animal Biology, 62(3), 315–335. https://doi.org/https://doi.org/10.1163/157075611X618246
- WHO. (2008). Guidelines for Drinking-water Quality, 3rd edition.Incorporating the first and second addenda 668 p.
- Wubie, A., Tadesse, Z., Tesfay, G., & Lakew, A. (2017). Fish distribution and abundance in the Upper Awash River, West Shewa. Ethiopian Journal of Science and Sustainable Development, 5(2), 109–118.
- Zhang, E. (2005). Phylogenetic relationships of labeonine cyprinids of the disc-bearing group (Pisces: Teleostei). Zoological Studies, 44(1), 130–143.