
 ?Mathematical formulae have been encoded as MathML and are displayed in this HTML version using MathJax in order to improve their display. Uncheck the box to turn MathJax off. This feature requires Javascript. Click on a formula to zoom.
Abstract
Haors are slightly depressed bowl or saucer-shaped wetland ecosystems, between the natural levees of rivers flowing into sea. Landraces are locally adapted germplasms, often with and have valuable traits. Genetically diverse germplasm is a valuable resource for the crop improvement programme. Therefore, the genetic diversity of 40 rice landraces from haor areas in Bangladesh was assessed through phenotyping and genotyping. Significant variability was found for several agronomic traits at p ≤ 0.01. Lal paijam was the earliest maturing genotype (130 days) with the lowest yield (8 g/plant). Lal kumri was the best genotype suited to haor lands due to its medium earliness (144 days) and the highest yield (30 g/plant). The genotypes were grouped using phenotypic or genotypic traits into five clusters. The first five principal components with eigenvalue of >1.0 were responsible for a cumulative variance of 72.9% in which principal components (PC); PC1, PC2, PC3, PC4, and PC5 contributed 25.7%, 19.2%, 10.9%, 8.8%, and 8.3%, respectively. A sum of 80 alleles was observed at 6 Simple Sequence Repeat (SSR) loci specifying the range of allele number from 11 (RM 169) to 16 (RM 25) with an average of 14.17. The mean values of polymorphism information content and gene diversity were 0.859 and 0.871, respectively. Most of the genotypes exhibited medium grain size and shape, intermediate gelatinization temperature, and intermediate amylose content. The findings of this study can be exploited to develop early, high-yielding rice varieties with premium grain quality.
PUBLIC INTEREST STATEMENT
Haors are slightly depressed bowl or saucer-shaped wetland ecosystem where cultivation practices and livelihoods of the people are unique. Landraces are locally adapted germplasms that have certain valuable traits which can be used to meet present and future challenges in plant breeding. Study of their genetic variability can help us to extract their valuable traits, protect them from being lost and maintain biodiversity. The results from the present study revealed that the genotypes from the haor areas have ample divergence at both phenotypic and genotypic levels. This basic study would help make precise breeding strategies and improve different agronomical traits in hybridization programme to develop early maturing yet high yielding varieties which can be competent for the haor areas to complement the existing ones.
1. Introduction
As the third largest global rice producer, Bangladesh harvests annually 36 million tonnes to sustain food security of 164 million population (FAO, Citation2020). Vagaries in the flow of water in rivers and floods still pose problems in rice production, particularly in haor lands. Landraces serve as reservoir of valuable genes to breed elite varieties with desired characteristics. The North-eastern region of Bangladesh (covering 7 districts; Sunamganj, Kishoreganj, Netrokona, Sylhet, Habiganj, Maulavibazar, and Brahmanbaria) possesses shallow-depressed bowl or saucer-shaped wetland ecosystem between the natural levees of rivers, collectively called as “haor basin” which looks like inland sea during monsoon because of annual flooding and dries up mostly in dry seasons (Irfanullah et al., Citation2011; Miah, Citation2013). In haor areas, rice is the principal cultivated crop contributing to the one-fifth of the country’s gross production and covers 20% of the total cultivated area (Rabby et al., Citation2011). It is usually cultivated during the boro season (dry season) and cultivation of late varieties during this season can cause significant crop loss if early flash floods appear. So, the development of short duration high yielding varieties is needed. Like other areas, the haor basin also owns its native local landraces which were popular but have become obsolete due to the intrusion of modern high-yielding varieties. For selection, conservation, characterization, and proper utilization of germplasms, genetic diversity is the primary component of any agricultural production system (Emon & Ahammed, Citation2020). Phenotype-based genetic diversity is not authentic enough due to the interaction between gene and environment which impulses plant breeders to opt for molecular or DNA markers as they are more accurate and consistent in different environmental conditions (Sangeetha et al., Citation2020; Schulman, Citation2007). Among the PCR-based DNA markers, microsatellite or SSR marker is the most effective due to their co-dominant nature, extensive dispersal throughout the genome, abundance of allelic diversity, high reproducibility, and high level of polymorphism (Hoshino et al., Citation2012; Zhang et al., Citation2006). According to Ghalmi et al. (Citation2010) and Sharma et al. (Citation2010), the best approach is the morpho-molecular approach for diversity assessment. Recently, few studies on diversity and population structure analysis of Bangladeshi rice landraces through phenotypic and genotypic markers have been reported to provide insights into the diversity of rice germplasm (Akter et al., Citation2022; M.Z. Islam et al., Citation2021; M. Z. Islam et al., Citation2018).
In recent years, premium grain quality has become an essential requirement for producers and consumers, thus significantly affecting global rice trading (Panda et al., Citation2020; Zhao et al., Citation2015). It is important to ameliorate nutritional quality through the biofortification of micronutrients (iron and zinc) (Panda et al., Citation2020). Therefore, the present investigation was designed to phenotype and genotype a set of rice landraces from haor areas to reveal their genetic divergence along with grain quality assessment.
2. Materials and methods
2.1. Phenotyping
2.1.1. Plant material, experimental design, and data collection
Among the seven districts of haor areas in Bangladesh, two districts (Sunamganj and Netrokona) were selected as study area from where 40 rice landraces (24 landraces were collected from Sunamganj district and 16 landraces from Netrokona) were used as plant materials (). To study phenotypic diversity, 39 days old single seedling was transplanted per hill to the main plot maintaining inter-row and inter-plant distances as 20 cm and 15 cm, respectively. Experimental design was Randomized complete block design (RCBD) with three replicates and individual plot size was 3 m × 2 m. Different management practices (e.g., irrigation, fertilization, weeding, and disease and insect management) were performed as and when required (BRRI (Bangladesh Rice Research Institute), Citation2011). Data were obtained from the average values of 5 randomly selected plants from each plot considering 13 agro-morphological traits.
Table 1. List of the 40 landraces of rice
2.2. Genotyping
2.2.1. DNA extraction and quantification
Genomic DNA was isolated from the fresh leaves of 22 days old plants using the Cetyl Trimethyl Ammonium Bromide (CTAB) mini preparation method (Dellaporta et al., Citation1983). The extracted DNA was tested for quality by electrophoresis in 0.8% agarose gel. DNA concentration was quantified using spectrophotometer (NanoDrop, (ND 1000, Thermo Scientific, Madison, USA). Thereafter, concentrated DNA was diluted with ddH2O to a desirable concentration of 50 ng/μL.
2.2.2. Marker assay and DNA amplification through polymerase chain reaction (PCR)
Out of the 10 randomly selected SSR markers (RM 5, RM 25, RM 44, RM 169, RM 286, RM 519, RM 70, RM 219, RM 336, and RM 7075) for the polymorphism survey, 6 primers (RM 5, RM 25, RM 44, RM 169, RM 286, and RM 519) showed clear polymorphism which were used in further analysis. Chromosomal location, repeat motifs, sequences, annealing temperature, and expected PCR product size of the selected primers are presented in Supplementary . The total PCR volume was 10 μL which contained 1 μL of 10X PCR buffer, 1 μL of 2.5 mM dNTPs, 1 μL each of forward and reverse primer, 0.2 μL of Taq polymerase (Western Scientific CO, Bangladesh), 3.8 μL sterile nuclease-free water, and 2 μL genomic DNA. The thermal profile for PCR (PTC-200MJ Thermocycler) amplification was programed as initial denaturation at 94°C for 5 min, followed by 34 cycles of denaturation at 94°C for 1 min, annealing at 55–67°C for 1 min (based on the respective annealing temperature of the primers), polymerization at 72°C for 2 min, then ending with a final incubation at 72°C for 7 min. About 2 µl of each PCR product were poured into each well of the vertically placed electrophoresis tank containing 8% polyacrylamide gel in 1% TBE buffer. A 50 bp DNA ladder was used to compare the size of the DNA fragments. Afterwards, the gel was soaked in 10 mg/mL of ethidium bromide solution for 15 minutes to stain. The amplified alleles were visualized under ultra-violet (UV) transilluminator and documented using Alpha imager HP (Alpha Innotech, Fisher Scientifics, USA) gel documentation system.
2.3. Data analysis
Data on various morphological descriptors were analyzed using MSTAT-C software package (Freed et al., Citation1989) to estimate analysis of variance (ANOVA). D2 values (Mahalanobis, Citation1936) for grouping of the genotypes into different clusters as well as average intra and inter-cluster distances were computed according to Rao (Citation1952). Principal component analysis (PCA) and correlation analysis among grain quality parameters were worked out using Minitab 17 software. For genotyping, Alpha Ease FC 5.0 software (Alpha Innotech, USA) was exploited to score the size of the amplified DNA fragments. Allele number per locus, major allele frequency, gene diversity, polymorphism information content (PIC), Nei’s genetic identity and genetic distance values were determined with the help of POWER MARKER version 3.23 (Liu & Muse, Citation2005). All the genotypes were scored for the presence (1) or absence (0) of the SSR bands and data were exported to NTSYS-pc version 2.2 (Rohlf, Citation2002) to depict an UPGMA (Unweighted Pair Group Method with Arithmetic Means) dendrogram showing the distance-based interrelationship among the genotypes (Nei, Citation1973).
2.4. Grain quality characterization
The landraces were assessed for six grain quality characters which are as follows.
2.4.1. Grain size and grain shape
These quality parameters were determined in millimeters (mm) using graphical method based on grain length (GL) and length/breadth ratio (L/B), respectively (Kanchana et al., Citation2012). According to Singh et al. (Citation2000), the grain size of the genotypes was classified as; very long (when, GL > 7.5 mm), long (GL = 6.61 to 7.5 mm), intermediate (GL = 5.51 to 6.6 mm), and short (GL ≤ 5.5 mm). Grain shape classification was accomplished as slender (L/B > 3.0), medium (L/B = 2.1 to 3.0), and bold (L/B ≤ 2.0).
2.4.2. Aroma
The samples were tested for aroma following the procedure described by Sood and Siddiq (Citation1978) and Seraj et al. (Citation2013). Conical flasks containing fine powder of 43 dehusked grains and 10 ml of 1.7% KOH solution were covered promptly with aluminum foil and left for around 1 hour at room temperature. Afterwards, the flasks were opened individually and rated using olfactory organs and classified as strong (score = 4), moderate (score = 3), slight (score = 2), and non-aromatic (score = 1).
2.4.3. Chalkiness (%)
The chalkiness in percentage was determined through the visual rating of the chalky area of the rice grain and were outwardly scored based on the Standard Evaluation System [SES] scale (0–9 scale) as described by IRRI (International Rice Research Institute; Citation1996); where scale 0 denotes no chalkiness, scale 1 (small, <10% chalky area), scale 5 (medium, 11%–20% chalky area), and scale 9 (large, >20% chalky area).
2.4.4. Gelatinization temperature (GT)
GT was estimated by alkali digestibility test using weak alkali solution (Little et al., Citation1958). Plastic petri plates, each containing six whole milled kernels (keeping enough space among them) and 10 ml of 0.34 M KOH were incubated for 23 hours at 30°C in an oven (Perez & Juliano, Citation1978). Starchy endosperms were visually rated based on a 7-point Alkali spreading value (ASV) scale as; scale 1–2 (Kernel not affected or swollen, GT = high), scale 3 (swollen kernel with incomplete narrow collar, GT = high-intermediate), scale 4 (swollen kernel with complete wide collar, GT = intermediate), scale 5 (split or segregated kernels with complete wide collar, GT = intermediate), scale 6 (kernel dispersed and merging with collar, GT = low), and scale 7 (kernel completely dispersed and intermingled, GT = low). ASV is inversely proportional to GT.
2.4.5. Amylose content
The amount of amylose was estimated following Juliano’s (Citation1971) modified method. 100 mg of rice flour sample was taken in an Erlenmeyer flask and 1 ml of 95% ethanol and 9 ml of 1 N NaOH were mixed with it. Starch was allowed to gelatinize by warming the content in boiling water bath for 5 minutes. Afterwards, the content was cooled and moved in a 100 ml volumetric flask and filled with distilled water up to the desired quantity. 1 ml of 1 N acetic acid and 2 ml of iodine solution were added with 5 ml of the sample solution in a 100 ml volumetric flask and volume was brought to the mark, mixed thoroughly, and left undisturbed for 20 minutes before recording the optical density at 590 nm using spectrophotometer. Thereafter, a standard curve was prepared and used to calculate the amylose content of the studied samples (Perez & Juliano, Citation1978). The classification of the rice samples was done as waxy (Amylose content = 0–2%), very low (3–9%), low (10–19%), intermediate (20–25%), and high (>25%) (Kumar & Khush, Citation1986).
2.4.6. Iron (Fe) and zinc (Zn) content
Fe and Zn content were measured using Atomic Absorption Spectrophotometer (AAS) (Shimadzu a7000) (Miguel et al., Citation1996). About 1 g of finely ground rice powder was digested with 15 ml of di-acid mixture (HNO3+ HClO4 2:1 v/v) at 180–200°C for 2 hrs. The filtrate volume was made up to 100 ml with double distilled water. A competent blank was run simultaneously to estimate the error. Standard wavelengths at AAS were 248.33 nm and 213.86 nm for Fe and Zn, respectively. Calibration graphs were constructed using standard concentration of Fe and Zn and were used to calculate Fe and Zn content of the studied samples.
3. Results
3.1. Phenotypic performance
The genotypes differed significantly for yield attributes revealed from Analysis of variance (ANOVA) at p ≤ 0.01 (). The average maturity period was recorded as 143.14 days and Lal paijam was the earliest maturing (130 days) genotype. Hashem irri was identified as the most late-maturing genotype (161 days) but a good performer in the case of flag leaf area (158 cm2) and yield per plant (29 g). Lal kumri was considered as the best genotype due to its medium earliness (144 days) and the highest yield (30 g/plant) which could be suitable for haor areas. The average plant height was 127.73 cm where Ajanabirun was the most dwarf genotype (96 cm) and Binni dhan was the tallest (161 cm). Hasa (sada), Chinishail-1, and Binni dhan had the highest effective tillers per hill (20), maximum pollen fertility (97%), and the longest panicle (31 cm), respectively ().
Table 2. Analysis of variance (ANOVA) for different phenotypic attributes of 40 landraces of rice
Table 3. Phenotypic performance of the studied landraces for different agro-morphological attributes
3.2. Diversity analysis from the phenotypic traits
Cluster analysis and Principal Component Analysis (PCA) were performed to reveal genetic diversity from the phenotypic data. Based on Mahalonobis D2 values, the genotypes were allotted in five clusters. Cluster III was the biggest cluster accommodating 18 genotypes whereas clusters II and IV were the smallest (5 genotypes each) (). The maximum intra-cluster distance was observed in cluster IV (20.39) and minimum in cluster I (14.41). On the contrary, maximum (28.44) and minimum (17.27) inter-cluster distances were shown from cluster (II and IV) and cluster (III and V), respectively (). In , Cluster II accommodated early maturing but low-yielding genotypes. Cluster I represented the most dwarf plants. In addition, all the high yielding genotypes with the highest total tillers per hill, effective tillers per hill, and pollen fertility (%) were grouped into the cluster V. So, hybridization of the genotypes drawn from cluster V with either cluster I or II would show increased heterosis for most of the desired characters.
Figure 1. Clustering of 40 landraces from haor areas in Bangladesh based on phenotypic attributes.
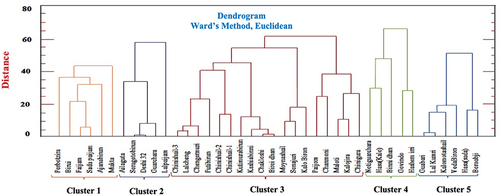
Table 4. Intra-inter cluster distance (D = ) in 40 rice genotypes
Table 5. Cluster mean for yield and yield contributing characters of 40 rice landraces
3.3. Principal component analysis (PCA)
PCA analysis interpreted that the first five principal components cumulatively explained 72.9% of the total variation with Eigenvalue of >1.0 (). A total variance of 55.8% was observed from the first three components which were enough to explain the variation pattern as recommended by Clifford and Stephenson (Citation1975) and Guei et al. (Citation2005). Raji (Citation2002) fixed the cut-off limit for the coefficient vectors as 0.3 and traits crossed over this value (≥0.3) indicated their significant contribution to the total variation. For PC1, filled grains per panicle (0.421), grains per panicle (0.388), yield per plant (0.365), days to maturity (0.339), and days to 50% flowering (0.328) were responsible for 25.7% of the total variation with filled grains per panicle registered the highest loading. In PC2, dominating traits were unfilled grains per panicle (0.420) and grains per panicle (0.341) accounting for 19.2% of data variation. For PC3, the contribution of 10.9% of the total variation was recorded from plant height (0.539) and panicle length (0.486) (). The first and second components are shown in two dimensions placing the variables in different positions, presented as a Loading plot (). depicts that, total tillers per hill, effective tillers per hill, pollen fertility, yield per plant, and days to 50% flowering were positively and negatively correlated with PC1 variance (25.7%) and PC2 variance (19.2%), respectively. Contrariwise, unfilled grains per panicle, grains per panicle, filled grains per panicle, days to maturity, plant height, flag leaf area, panicle length were highly positively correlated with the loadings of both PC1 and PC2 variances and accounted for the highest variability in yield per plant compared to the other traits. The length and position of variables from the center elucidate the magnitude and direction of the contribution of different traits, respectively.
Figure 2. Loading plot of principal component analysis (PCA) showing diversity of yield and yield attributes of 40 landraces from haor areas in Bangladesh.
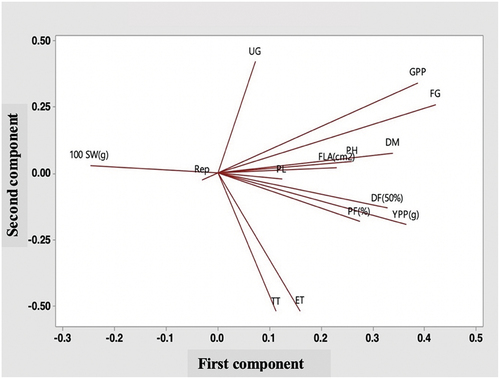
Table 6. Principal components (PCs) for morphological traits of 40 rice genotypes
3.4. SSR marker-based DNA fingerprinting
A total of 80 alleles were detected at 6 microsatellite markers across 40 genotypes having minimum and maximum frequency of 11 (RM 169) to 16 (RM 25), respectively with an average band of 14.17 per locus. Rare alleles were found across all SSR loci ranging from 3 (RM 44 and RM 519) to 8 (RM 169 and RM 286) with an average of 5.83 alleles (). One null allele was found at every locus except RM 44. The overall size of the major alleles varied from 97 bp (RM 286) to 170 bp (RM 169). On average, 22.92% of the 40 rice genotypes shared a common major allele at each locus varying from 12.5% (RM 25 and RM 519) to 37.5% (RM 169). Gene diversity was quite higher ranging from 0.788 (RM 169) to 0.923 (RM 25) with a mean diversity of 0.871. Polymorphism information content (PIC) value varied greatly ranging from 0.764 (RM 169) to 0.917 (RM 25) with an average value of 0.859 per locus (). RM 25 was the best marker to discriminate among the genotypes revealed from its higher gene diversity (0.923) and PIC value (0.917). The DNA profile of RM 25 is shown in and that of the other studied markers are provided in supplementary materials (Supplementary –5).
Figure 3. Banding pattern of 40 landraces from haor areas in Bangladesh for SSR marker RM 25.
Table 7. SSR markers analysis of 40 rice genotypes for 6 microsatellites (SSR) markers
3.5. Cluster analysis
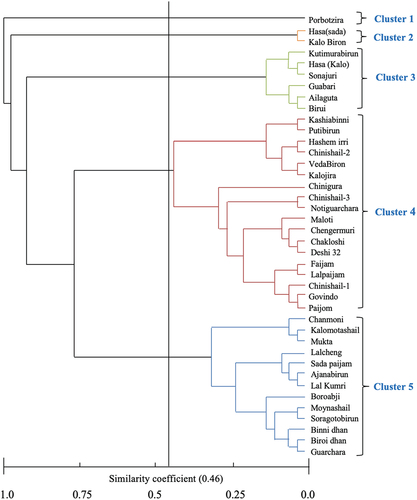
Cluster analysis based on Nei’s genetic distance (Nei, Citation1973) using UPGMA (Unweighted Pair Group Method of Arithmetic means) method segregated the 40 genotypes into 5 clusters at the 0.46 cut-off similarity coefficient producing cluster IV as the largest group (18 genotypes) and cluster I (1 genotype) as a smallest one (). Pair-wise estimates of similarity ranged from 0.0 to 1.0. Cluster II, III, and V housed 2, 6, and 13 genotypes, respectively ().
Figure 4. UPGMA (Unweighted Pair Group Method of Arithmetic means) Phylograph showing clustering of 40 landraces from haor areas in Bangladesh based on 6 SSR marker analysis.
3.6. Performance in the grain quality parameters
The grain length of the studied genotypes was found to be in the range of 3.41 mm (Chinishail-3) to 7.05 mm (Kutimurabirun) with an average value of 5.30 mm. Two landraces (Kutimurabirun and Kashiabinni) were long sized, and the rest 47% and 48% of genotypes were fallen in the category of short and medium grain size, respectively. Sonajuri and Kutimurabirun showed the minimum and maximum L/B ratios (1.66; bold) and (3.82; slender), respectively (; Supplementary Table 2; ). About 23% of genotypes were slender, whereas the rest 7% and 70% of genotypes were bold and medium, respectively (). Kutimurabirun and Kashiabinni were discovered as long and slender grained genotypes. Five landraces had strong aroma (Porbotzira, Notiguarchara, Hasa (Kalo), Chinigura, and Kalojira); three genotypes (Chinishail-1, Chinishail-2, Chinishail-3) were smelt as slightly aromatic, and the rest had no aroma at all (Supplementary ). More than half of the total genotypes (55%) were observed to have no chalky texture in their grains. In the present study, 43% of genotypes showed high GT (>74°C), 45% recorded intermediate GT (70 to 74°C) and the rest 12% of genotypes exhibited low GT (55 to 69°C) (). Among the studied genotypes, the least amylose content (AC) was recorded in Hashem irri (10.58%), and the highest value was observed in Govindo and Lalcheng (34.39%) with an average of 24.62% (). Besides, 43% of genotypes possessed intermediate amylose content (20% −25% AC) which is highly desirable among the Bangladeshi populace (; Supplementary ). Lal paijam contained the highest amount of iron (172.23 ppm) and zinc (33.43 ppm) (; Supplementary Table 2).
Figure 5. Pie chart showing categorization of 40 landraces from haor areas in Bangladesh for grain quality traits.
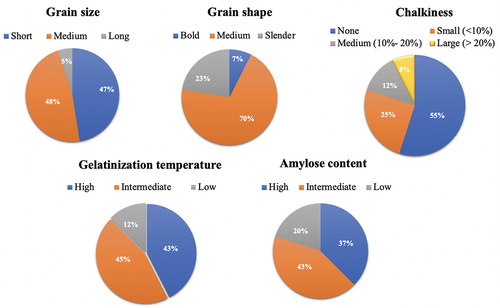
Table 8. Performance of the 40 rice landraces considering grain quality traits
3.7. Correlation among the different grain quality traits
L/B ratio showed a highly significant positive relationship with grain length while a high significant negative relationship was observed with grain breadth. A significant negative association was found between the aroma and grain size-shape related traits (GL, GB, and L/B ratio). A high significant positive correlation was found between % chalkiness and grain breadth. Iron content and zinc content were positively correlated with each other. Amylose content and ASV score did not exhibit any significant relationship with other quality traits ().
Table 9. Correlation among the studied grain quality traits
4. Discussion
Genetic diversity is the principal factor to be considered for meeting the diverse goals of plant breeding with desired characteristics (Emon & Ahammed, Citation2020). The significant divergence among the landraces for the studied traits implies that there was ample scope for selection of valuable traits for yield improvement (; Table ). There was no relation between the clustering pattern and geographic distribution in this study i.e., the clusters did not always assemble the genotypes from the same region indicating their wider genetic base. They were grouped based on their phenotypic similarity. Such findings were also reported in the previous studies (Dhakal et al., Citation2020; Sinha & Mishra, Citation2013). A broad range of intra- (14.41–20.39) and inter- (17.27–28.44) cluster distance suggested heterogenous and wide diversity among the genotypes (). From the cluster mean values of different traits, it was summarized that cluster V was divergent from cluster II for most of the desired characters (). Nisar et al. (Citation2017) and Ashok et al. (Citation2017) suggested parents for hybridization should be chosen from the farthest clusters having an excellent mean performance for desired characters to utilize maximum heterosis to obtain a broad range of segregating populations. PCA is a well-accepted tool to extract minimum components from a number of components explaining the maximum variability out of the total variability (Morrison, Citation1978). Pokhrel et al. (Citation2020) observed 73.8% cumulative variance caused by the first four components while studying 31 rice germplasm which is in line with the present study. Days to maturity, plant height, and filled grains per panicle were the main contributors explaining total variation due to the positive loadings in all the first three principal components which were also supported by Ahmad et al. (Citation2015) (). As unfilled grains per panicle, grains per panicle, filled grains per panicle, days to maturity, plant height, flag leaf area, and panicle length loaded in the positive region of both PC1 and PC2, these traits could be given utmost priority during parent selection ().
Genetic diversity assessment through morphological approaches is not enough to provide transparent results due to the interruption of environmental effects. That’s why molecular characterization was performed to unravel this problem. In the present investigation, all the studied 6 SSR primers provided profuse information to explain genetic divergence and relationships among the genotypes. According to Hartl and Clark (Citation1997), the number and frequency of alleles are important indicators to determine the efficacy of a marker. All the microsatellite loci were multi-allelic (total and average alleles were 80 and 14.17 alleles per locus, respectively) (). This value was higher than the average of 8.46 alleles per locus while using 13 SSR markers in the 167 Thai and exotic rice accessions confirmed by Pathaichindachote et al. (Citation2019), but more or less similar to the average of 13.57 alleles per locus using 7 microsatellites in 300 rice genotypes reported by Choudhury et al. (Citation2013). The mean gene diversity was observed as 0.871 which was quite higher compared to the value (0.630) mentioned by Singh et al. (Citation2019) studying 65 local rice landraces using 22 SSR markers (). Several authors have affirmed the values of polymorphism information content (PIC) to express the level of polymorphism. Salem and Sallam (Citation2016) opined that the PIC value ≥0.7 as very high value. In contrast, Tu Anh et al. (Citation2018) found SSR markers with PIC value ≥0.5 as highly informative and effective in genetic divergence assessment. In our study, all the markers showed PIC values of >0.7 which denoted the suitability of the markers to study genetic relatedness along with the indication of remarkably diverse nature and different phylogeny of the genotypes.
The genotypes were grouped into five clusters during both morphologically and molecular grouping, but the composition of genotypes in each cluster was somewhat different in both cases. A similarity coefficient of 0.49 among 46 rice landraces using 5 microsatellites was found by Mia (Citation2014) which is in line with the present study. Genetically similar genotypes showed comparatively same banding patterns and clustered together. In consistence with the present study, Sajib et al. (Citation2012) also found five groups of 12 genotypes based on the alleles detected with the aid of 9 SSR markers. Likewise, Tarang et al. (Citation2020) found 5 clusters based on the data from 60 SSR markers in 63 rice genotypes belonging to Central and West Asia. In the present study, neither morphological nor molecular clustering followed a geographic pattern. There were 3 different genotypes named Chinishail which were referred to using different numerical (Chinishail-1, Chinishail-2, and Chinishail-3). They were collected from different places in Netrokona. They also clubbed together in the same cluster which means that they were genetically identical and held the same pedigree ().
In the near past in Bangladesh, people were pleased with filling their stomachs with poor quality rice because the high yield was exclusively a major focus in rice breeding. But with the improvement of the yield and living standard of the people, amelioration of grain quality has been added as an extra breeding objective in recent years. Grain size, shape, appearance, palatability, and nutritional value are the major determinants of consumer acceptability (Sharma & Khanna, Citation2019). In the present investigation, Kutimurabirun and Kashiabinni were long and slender grained rice which is highly preferred by most of the rice-consuming populace (Takoradi, Citation2008) (Supplementary ). Fragrant rice demands a premium price in the international market due to its nice flavor and palatability (Ghosh & Roychoudhury, Citation2018). It has also a cultural impact on Bangladesh as they are used to prepare various delicious cuisines like polao, biriani, jarda, payesh, khir etc. and served in different social festivals in Bangladesh. We detected five strongly aromatic genotypes in our study which may be used as a source for breeding scented rice varieties. The white powdery portion in rice grain due to incomplete filling of starch is known as chalkiness (Chen et al., Citation2012). Grains with the excessive chalky area are highly subjected to breakage and deteriorate the milling quality. In our study, we found no chalkiness in more than half of the studied genotypes (55%) (). Gelatinization temperature (GT) determines the time needed for cooking and is inversely proportional to ASV (Alkali spreading value); the higher the ASV, the lower will be GT and vice-versa. Amylose content (AC) is an important consumption parameter that determines the texture and taste of cooked rice. AC is positively correlated with hardness and negatively correlated with stickiness (Juliano & Pascual, Citation1980). Intermediate AC makes the cooked rice fluffy and soft. Near the half of the studied genotypes showed intermediate GT and intermediate AC which gained much popularity in South and Southeast Asia including Bangladesh (Mackill & Khush, Citation2018) (). Lal paijam had the highest iron (172.23 ppm) and zinc content (33.43 ppm) (). Mia (Citation2014) also found a rice landrace named Kumra Ghor possessing 168.52 ppm iron content. Chinigura and Kalojira were found as the best among the aromatic rice genotypes having short-medium grain size and shape, no chalky area, intermediate GT, and intermediate AC. As rice is the principal food in almost every meal of the marginal people in the haor areas, iron and zinc enriched rice will greatly contribute to their sound health.
Correlation analysis among the grain quality traits was performed to know the association and intensity of the relationship among the traits so that the desired characters can be improved simultaneously while obtaining significant association. A significant negative correlation between L/B ratio and grain breadth indicated that a higher L/B ratio was made from a lower grain breadth which is in line with results obtained by Danbaba et al. (Citation2011) while studied with 12 Ofada rice varieties. Aroma and grain size-shape related traits (GL, GB, and L/B ratio) were significantly negatively correlated. Seraj et al. (Citation2013) noticed that grain breadth was significantly negatively correlated with aroma. The significant positive association between chalkiness and grain breadth hints that the chalky area broadens with the increase of grain width. A significant positive association between iron and zinc content discloses that these two micronutrients can be improved simultaneously with the effort of one ().
The current study reveals that the genotypes from the haor areas showed ample divergence at both phenotypic and genotypic levels. Showing outstanding performance in different phenotypic and grain quality traits, Lal paijam, Lal kumri, Hashem irri, Kutimurabirun, Kashiabinni, Porbotzira, Notiguarchara, Hasa(kalo), Chinigura, and Kalojira were discovered as the most potential genotypes and thus need to be conserved as a reservoir of the elite gene pool. This basic study would help make precise breeding strategies to develop short during high-yielding varieties along with superior grain qualities competent for the haor areas and to complement the existing varieties. As the number of microsatellites was relatively low and they were selected randomly from the rice genome, they did not reflect any particular trait or gene. So, further investigations can be initiated for the application of marker-aided breeding using molecular markers linked to certain genes or Quantitative trait loci (QTLs) controlling elite traits based on the findings of the present study.
Authors’ contributions
LH and AH supervised the experiment. SRS carried out the experiment, analyzed the data, and prepared the draft manuscript. AF reviewed and edited the final manuscript. SNB conceptualized the molecular and biochemical works. FY planned and designed the field experiment. WA assisted in phenotyping and biochemical analyses.
Supplemental Material
Download MS Word (2.8 MB)Acknowledgements
The authors gratefully appreciate the Plant Breeding Division, Bangladesh Institute of Nuclear Agriculture (BINA), Mymensingh-2202 for providing research facilities and making this research feasible. The authors also acknowledge their heartiest thanks to the Department of Biochemistry and Molecular Biology and the Department of Agricultural Chemistry, Bangladesh Agricultural University, Mymensingh-2202, Bangladesh for providing technical support during biochemical analysis. The authors would like to express their sincere gratitude to Dr Md. Monirul Islam, Senior Scientific Officer, Biotechnology Division, Bangladesh Institute of Nuclear Agriculture, Mymensingh-2202 as well as Nihar Ranjan Saha, for providing laboratory facilities during genotyping and assistance in analysis of molecular data.
Disclosure statement
No potential conflict of interest was reported by the author(s).
Supplementary material
Supplemental data for this article can be accessed online at https://doi.org/10.1080/23311932.2022.2075130
Additional information
Notes on contributors
Setu Rani Saha
Setu Rani Saha is involved in collection and characterization of germplasms, functional analysis of rice genes involved in tolerance to abiotic stress, and grain quality improvement in rice. The research area and interests of Aleya Ferdausi are focused on stress physiology specially on transcriptomics and metabolomics related to plant biotic and abiotic stress tolerance as well as isolation of bioactive compounds. Lutful Hassan is a reputed researcher in the field of plant breeding and biotechnology of field crops. Md. Ashraful Haque’s research expertise includes biology of higher plants along with plant-microbes interaction. The research specialization of Shamsun Nahar Begum is varietal improvement of rice and pulse crops through Mutation Breeding and Biotechnology. Fahmina Yasmin focuses on abiotic stress breeding and Plant genetic resources (PGR) of different crops. Wasim Akram is involved in some projects on the development of salinity and submergence tolerant rice varieties.
References
- Ahmad, F., Hanafi, M. M., Hakim, M. A., Rafii, M. Y., Arolu, I. W., Abdullah, S. N. A., & Barendse, W. (2015). Genetic divergence and heritability of 42 coloured upland rice genotypes (Oryza sativa) as revealed by microsatellites marker and agro-morphological traits. PLoS ONE, 10(9), e0138246. https://doi.org/10.1371/journal.pone.0138246
- Akter, M. B., Mosab-Bin, A., Kamruzzaman, M., Reflinur, R., Nahar, N., Rana, M. S., Hoque, M. I., & Islam, M. S. (2022). Morpho-molecular diversity study of rice cultivars in Bangladesh. Czech Journal of Genetics and Plant Breeding, 58(2), 64–19. https://doi.org/10.17221/69/2021-CJGPB
- Ashok, S., Jyothula, D. P. B., & Ratnababu, D. (2017). Genetic divergence studies for yield, yield components and grain quality parameters in rice (Oryza sativa L.). Electronic Journal of Plant Breeding, 8(4), 1240–1246. https://doi.org/10.5958/0975-928X.2017.00178.8
- BRRI (Bangladesh Rice Research Institute). (2011). Adhunik dhaner chash (in Bengali) .
- Chen, Y., Wang, M., & Ouwerkerk, P. B. (2012). Molecular and environmental factors determining grain quality in rice. Food and Energy Security, 1(2), 111–132. https://doi.org/10.1002/fes3.11
- Choudhury, B., Khan, M. L., & Dayanandan, S. (2013). Genetic structure and diversity of indigenous rice (Oryza sativa) varieties in the Eastern Himalayan region of Northeast India. SpringerPlus, 2(1), 1–10. https://doi.org/10.1186/2193-1801-2-228
- Clifford, H. T., & Stephenson, W. (1975). An introduction to numerical classification .Academic Press.
- Danbaba, N., Anounye, J. C., Gana, A. S., Abo, M. E., & Ukwungwu, M. N. (2011). Grain quality characteristics of ofada rice (Oryza sativa L.): Cooking and eating quality. International Food Research Journal, 18(2), 629–634 http://www.ifrj.upm.edu.my/18%20(02)%202011/(23)%20IFRJ-2010-105.pdf.
- Dellaporta, S. L., Wood, J., & Hicks, J. B. (1983). A plant DNA minipreparation: Version II. Plant Molecular Biology Reporter, 1(4), 19–21. https://doi.org/10.1007/BF02712670
- Dhakal, A., Pokhrel, A., Sharma, S., Poudel, A., & Rahimi, M. (2020). Multivariate analysis of phenotypic diversity of rice (Oryza sativa L.) landraces from Lamjung and Tanahun Districts, Nepal. International Journal of Agronomy 2020 doi:10.1155/2020/8867961, Article ID 8867961.
- Emon, R. M., & Ahammed, G. J. (2020). Germplasm and genetic diversity studies in rice for stress response and quality traits. In Rice research for quality improvement: genomics and genetic engineering (pp. 47–60) . Singapore: Springer. https://doi.org/10.1007/978-981-15-4120-9_3. ISBN: 978-981-15-4120-9.
- FAO. (2020). FAOSTAT. Food and agriculture data. http://www.fao.org/faostat/en
- Freed, R., Einensmith, S. P., Gutez, S., Reicosky, D., Smail, V. W., & Wolberg, P. (1989). Guide to MSTAT-C analysis of agronomic research experiments. Michigan State University.
- Ghalmi, N., Malice, M., Jacquemin, J. M., Ounane, S. M., Mekliche, L., & Baudoin, J. P. (2010). Morphological and molecular diversity within Algerian cowpea (Vigna unguiculata (L.) Walp.) landraces. Genetic Resources and Crop Evolution, 57(3), 371–386. https://doi.org/10.1007/s10722-009-9476-5
- Ghosh, P., & Roychoudhury, A. (2018). Differential levels of metabolites and enzymes related to aroma formation in aromatic indica rice varieties: Comparison with non-aromatic varieties. 3 Biotech, 8(1), 1–13. https://doi.org/10.1007/s13205-017-1045-6
- Guei, R. G., Sanni, K. A., & Fawole, A. F. J. (2005). Genetic diversity of rice (Oryza sativa). Agronomie Africaine, 5, 17–28.
- Hartl, D. L., & Clark, A. G. (1997). Principles of population genetics (Vol. 116). Wiley.
- Hoshino, A. A., Bravo, J. P., Nobile, P. M., & Morelli, K. A. (2012). Microsatellites as tools for genetic diversity analysis. In Mahmut Çalışkan (eds.), Genetic diversity in microorganisms (pp. 382). InTechOpen.
- Irfanullah, H. M., Azad, M. A. K., Kamruzzaman, M., & Wahed, M. A. (2011). Floating gardening in Bangladesh: A means to rebuild lives after devastating flood. Indian Journal of Traditional Knowledge, 10(1), 31–38 https://www.doc-developpement-durable.org/file/eau/gestionEauxUsees-EauxGrises-Lagunage/Floating%20gardening%20in%20Bangladesh.pdf.
- IRRI (International Rice Research Institute). (1996). Standard evaluation system for rice (pp. 52, 4thedition). Manila, Philippines.
- Islam, M. Z., Khalequzzaman, M., Bashar, M. K., Ivy, N. A., Mian, M. A. K., Pittendrigh, B. R., Haque, M. M., & Ali, M. P. (2018). Variability assessment of aromatic rice germplasm by pheno-genomic traits and population structure analysis. Scientific Reports, 8(1), 1–14. https://doi.org/10.1038/s41598-018-28001-z
- Islam, M. Z., Khalequzzaman, M., Chakrabarty, T., Akter, N., Khan, M. F., Bhuiya, A., & Siddique, M. A. (2021). Genetic diversity and population structure of similar named aromatic rice (Oryza sativa L.) landraces of Bangladesh. SAARC Journal of Agriculture, 19(2), 57–71. https://doi.org/10.3329/sja.v19i2.57826
- Juliano, B. O. (1971). A simplified assay for milled rice amylose. Cereal Science Today, 16, 334–340.
- Juliano, B. O., & Pascual, C. G. (1980). Quality characteristics of milled rice grown in different countries. In IRRI research paper series. 48. International rice research institute 25 pp .
- Kanchana, S., Bharathi, S. L., Ilamaran, M., & Singaravadivel, K. (2012). Physical quality of selected rice varieties. World Journal of Agricultural Sciences, 8(5), 468–472.
- Kumar, I., & Khush, G. S. (1986). Gene dosage effects of amylose content in rice endosperm. The Japanese Journal of Genetics, 61(6), 559–568. https://doi.org/10.1266/jjg.61.559
- Little, R. R., Hilder, G. B., & Dawson, E. H. (1958). Differential effect of dilute alkali on 25 varieties of milled white rice. Cereal Chemistry, 35(2), 111–126.
- Liu, K., & Muse, S. V. (2005). Power marker: Integrated analysis environment for genetic marker data. Bioinformatics, 21(9), 2128–2129. https://doi.org/10.1093/bioinformatics/bti282
- Mackill, D. J., & Khush, G. S. (2018). IR64: A high-quality and high-yielding mega variety. Rice, 11(1), 1–11. https://doi.org/10.1186/s12284-018-0208-3
- Mahalanobis, P. C. (1936). On the generalized distance in statistics. Proceedings of National Institute of Science of India, 2 (1) , 49–55.
- Mia, M. M. (2014). Characterization of rice genotypes for iron content through morphological, chemical and molecular assay. MS Dissertation. Department of Genetics and Plant Breeding, Bangladesh Agricultural University. pp 80.
- Miah, M. R. (2013). Enhancing food security through acclimatized species domestication in the haor region. ABC Journal of Advanced Research, 2(1), 49–65. https://doi.org/10.18034/abcjar.v2i1.19
- Miguel, A. B., Maria, P. M. G., Jesus, M. A., & Juan, R. C. (1996). Graphite-furnace atomic absorption spectrometric method for direct determination of iron and zinc in solid rice samples. Analytical Sciences, 12(3), 483–488. https://doi.org/10.2116/analsci.12.483
- Morrison, D. E. (1978). Multivariate statistical methods. 2nd ed. 4th Print. McGraw Hill Kogakusta Ltd.
- Nei, M. (1973). Analysis of gene diversity in subdivided populations. Proceedings of the National Academy of Sciences, 70(12), 3321–3323. https://doi.org/10.1073/pnas.70.12.3321
- Nisar, M., Kumar, A., Pandey, V. R., Singh, P. K., & Verma, O. P. (2017). Studies on genetic divergence analysis in rice (Oryza sativa L.) under sodic soil. International Journal of Current Microbiology and Applied Sciences, 6(12), 3351–3358. https://doi.org/10.20546/ijcmas.2017.612.390
- Panda, D., Mishra, S. S., & Behera, P. K. (2020). Improvement of rice quality: The new revolution. In Rice research for quality improvement: genomics and genetic engineering (pp. 87–108) https://doi.org/10.1007/978-981-15-4120-9_5. Singapore: Springer.
- Pathaichindachote, W., Panyawut, N., Sikaewtung, K., Patarapuwadol, S., & Muangprom, A. (2019). Genetic diversity and allelic frequency of selected Thai and exotic rice germplasm using SSR markers. Rice Science, 26(6), 393–403. https://doi.org/10.1016/j.rsci.2018.11.002
- Perez, C. M., & Juliano, B. O. (1978). Modification of the simplified amylose test for milled rice. Starch‐Stärke, 30(12), 424–426. https://doi.org/10.1002/star.19780301206
- Pokhrel, A., Dhakal, A., Sharma, S., & Poudel, A. (2020). Evaluation of physicochemical and cooking characteristics of rice (Oryza sativa L.) landraces of lamjung and Tanahun Districts, Nepal. International Journal of Food Science, 2020( Article ID: 1589150), 1–11. https://doi.org/10.1155/2020/1589150.
- Rabby, T. G., Alam, G. M., Mishra, P. K., Hoque, K. E., & Nair, S. (2011). Different economic and policy perspectives in micro population for sustainable development: A study of the haor livelihood in Bangladesh. African Journal of Business Management, 5(6), 2475–2492. https://doi.org/10.5897/AJBM11.224.
- Raji, A. A. (2002). Assessment of genetic diversity and heterotic relationships in African improved and local cassava germplasm. PhD Dissertation. University of Ibadan.
- Rao, C. R. (1952). Advanced statistical methods in biometric research. John Willey and Sons, Inc.
- Rohlf, F. (2002). NTSYS-pc: Numerical taxonomy and multivariate analysis system (2.2 ed.). Department of Ecology and Evolution, State University of NY.
- Sajib, A. M., Hossain, M. M., Mosnaz, A. T. M. J., Hossain, H., Islam, M. M., Ali, M. S., & Prodhan, S. H. (2012). SSR marker-based molecular characterization and genetic diversity analysis of aromatic landraces of rice (Oryza sativa L.). Journal of BioScience & Biotechnology, 1(2), 107–116.
- Salem, K. F. M., & Sallam, A. (2016). Analysis of population structure and genetic diversity of Egyptian and exotic rice (Oryza sativa L.) genotypes. Comptes rendus biologies, 339(1), 1–9. https://doi.org/10.1016/j.crvi.2015.11.003
- Sangeetha, J., Habeeb, J., Thangadurai, D., Alabhai, J. M., Hospet, R., Maxim, S. S., Pandhari, R., & Kushwaha, U. K. S. (2020). Potentiality of wild rice in quality improvement of cultivated rice varieties. In Rice research for quality improvement: Genomics and genetic engineering. (pp. 61–85) https://doi.org/10.1007/978-981-15-4120-9_4). Singapore: Springer.
- Schulman, A. H. (2007). Molecular markers to assess genetic diversity. Euphytica, 158(3), 313–321. https://doi.org/10.1007/s10681-006-9282-5
- Seraj, S., Hassan, L., Begum, S. N., & Sarker, M. M. (2013). Physico-chemical attributes and correlation among grain quality traits of some exotic aromatic rice lines. Journal of Bangladesh Agricultural University, 11(2), 227–232. https://doi.org/10.3329/jbau.v11i2.19899
- Sharma, L., Prasanna, B. M., & Ramesh, B. (2010). Analysis of phenotypic and microsatellite-based diversity of maize landraces in India, especially from the North-East Himalayan region. Genetica, 138(6), 619–631. https://doi.org/10.1007/s10709-010-9436-1
- Sharma, N., & Khanna, R. (2019). Rice grain quality: Current developments and future prospects. In Recent advances in grain crops research (pp. 137–144). IntechOpen.
- Singh, R. K., Singh, U. S., & Khush, G. S. (2000). Aromatic rices. Oxford and IBH Publishing Co. Ltd. New Dellhi, 279.
- Singh, S. P., Singh, Y. T., Ilkovičová, L., Szentpéteriová, E., Macejová, M., Košuth, J., Zulli, A., Debeljak, N., Hudler, P., Jašek, K., Kašubová, I., Kubatka, P., & Solár, P. (2019). Rice of Northeast India harbor rich genetic diversity as measured by SSR markers and Zn/Fe content. BMC Genetics, 20(1), 1–13. https://doi.org/10.1186/s12863-018-0706-8
- Sinha, A. K., & Mishra, P. K. (2013). Agro-morphological characterization and morphology based genetic diversity analysis of landraces of rice variety (Oryza sativa L.) of Bankura district of West Bengal. International Journal of Current Research, 5(10), 2764–2769 http://www.journalcra.com.
- Sood, B. C., & Siddiq, E. A. (1978). A rapid technique for scent determination in rice. Indian Journal of Genetics and Plant Breeding, 38(2), 268–271.
- Takoradi, A. A. (2008). Ghana needs 700000 metric tonnes of rice annually but currently produces only 150000. http//www.modernghana.com/news/18534/1/Ghana-needs-700000-tonnes-of-rice-annually-but-cur.htm
- Tarang, A., Kordrostami, M., Kumleh, A. S., Chaleshtori, M. H., Saravani, A. F., Ghanbarzadeh, M., & Sattari, M. (2020). Study of genetic diversity in rice (Oryza sativa L.) cultivars of Central and Western Asia using microsatellite markers tightly linked to important quality and yield related traits. Genetic Resources and Crop Evolution, 67(6), 1537–1550. https://doi.org/10.1007/s10722-020-00927-2
- Tu Anh, T. T., Khanh, T. D., Dat, T. D., & Xuan, T. D. (2018). Identification of phenotypic variation and genetic diversity in rice (Oryza sativa L.) mutants. Agriculture, 8(2), 30. https://doi.org/10.3390/agriculture8020030
- Zhang, H., Sun, J., Wang, M., Liao, D., Zeng, Y., Shen, S., Yu, P., Mu, P., Wang, X., Li, Z., & Donini, P. (2006). Genetic structure and phylogeography of rice landraces in Yunnan, China, revealed by SSR. Genome, 50(1), 72–83. https://doi.org/10.1139/g06-130
- Zhao, X., Zhou, L., Ponce, K., & Ye, G. (2015). The usefulness of known genes/QTLs for grain quality traits in an Indica population of diverse breeding lines tested using association analysis. Rice, 8(1), 1–3. https://doi.org/10.1186/s12284-015-0064-3