
Abstract
Maize yields in the Senqu River Valley are among the lowest in Lesotho. This study aimed to compare the farm economic margins (FEM) of different maize-based smallholder farming systems (MSFSs) in the Senqu River Valley (SRV) and provide recommendations on farming systems that can be employed to improve the FEM for household income improvement. The Olympe software was used to model and simulate the FEM of the different MSFSs and SWOT–TOWS analysis was used to devise strategies to increase FEM and improve household income. The findings revealed that there was high FEM variability within and across the different MSFSs. The identified sources of variance were the cropping patterns, types of intercrops, and the number of animals raised. Poor crop and livestock management also played a role in the FEM variability, hence the poor performance of some MSFSs. The findings further indicated that MSFSs with high-value intercrops such as pumpkins had higher FEM than their monocropping counterparts. Then, again, MSFSs with both crops and livestock had the highest FEM. Therefore, identified strategies like crop diversification and livestock integration could be recommended for use by farmers, not only in this zone but also in other zones that share similar environmental conditions.
1. Introduction
Maize (Zea mays) is one of the three key world cereal crops flanking rice and wheat. Maize is a staple food that provides 30% to 50% of daily calorie intake in developing countries (Tanumihardjo et al., Citation2019). Meanwhile, in developed countries, maize is consumed in advanced processed products such as meat, milk, eggs, food thickener, sweetener, etc. (Tanumihardjo et al., Citation2019). Apart from its importance as an energy source to humans, maize also plays a pivotal role as feed for animals and in the production of biofuel, which makes it a world’s highly demanded crop (Morojele & Sekoli, Citation2016). In Sub-Saharan Africa (SSA), maize is the main crop for many smallholders due to its contribution to the household’s daily diet (Santpoort, Citation2020).
Like in many other SSA countries, maize is Lesotho’s main staple crop alongside wheat, sorghum, peas, and beans authenticated by both production of more than 65% of the cultivated land across all four agroecological zones (lowlands, mountains, foothills, and Senqu River Valley) and consumption of more than 50% of daily calorie intake at the rate of more than 100 kg/capita/year (Lesotho Bureau of Statistics, Citation2019; Morojele & Sekoli, Citation2016). Thus, maize plays a rather principal role in the food security of Lesotho. While neighbouring South Africa produces maize of around 12,2 million tonnes/year (Greyling & Pardey, Citation2019), recent studies suggest that Lesotho has declined from 102, 000 tonnes/year to 35,000 tonnes/year in 2019 and saw a further decline to 20,000 tonnes/year in 2020 against the national annual requirement of 340,000 tonnes (Lesotho Bureau of Statistics, Citation2021a).
The Lesotho Bureau of Statistics website further shows that maize yield/ha declined to 0.5 metric tonnes in the 2019/2020 agricultural year (Lesotho Bureau of Statistics, Citation2022). To meet the country’s maize demand, the deficit must be imported and dependency on the imported staple puts big pressure on the already impoverished country whose 49.7% of the population lives below the poverty line (World Bank Group & Bureau of Statistics, Citation2019). This low maize yield poses a threat to the food security of Lesotho because it is an agrarian-based economy whose more than 80% of its rural population derive their livelihood through mixed farming of both crops and livestock and other agriculture-related activities (MAFS & Lesotho Bureau of Statistics, Citation2019). Although most of the rural population derives livelihood mainly from agriculture as a key source of both income and employment, agriculture’s economic contribution to Lesotho’s Gross Domestic Product (GDP) has been persistently low at around 8% (Lesotho Bureau of Statistics, Citation2021b). Some of the reasons for this low contribution include but are not limited to the insistently low crop and livestock yields. These low yields may be attributed to poor agricultural practices such as intensive conventional tillage systems, improper or no use of fertilizers, low crop diversification, overdependence on rainfall, and poverty that reduces the ability of farmers to invest meaningfully in agriculture, low seeding rates, biodiversity loss, reduced soil fertility, and soil erosion (Lesotho Meteorological Services, Citation2017). Natural factors such as the recurring El Nino-induced drought that occurs every four years, hailstorms, and floods (Kamara et al., Citation2019), are among the causes of low yields that result in exacerbated poverty and inherent food insecurity in agriculture-dependent households.
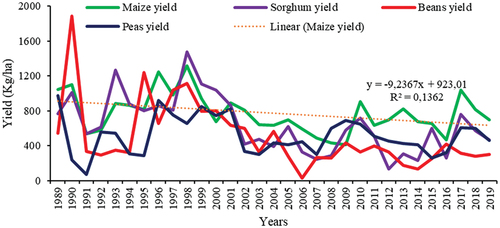
Owing to these mounting pressures, the government of Lesotho devised strategies to relieve the farming population by subsidising inputs such as fertilizers, tillage operations, seeds, etc. and engaging in contract farming (sharecropping) as a demonstration of proper crop management such as proper seed and fertilizer rate application and to increase food availability (Rantšo & Seboka, Citation2019). Despite all these efforts by the government and the Non-Governmental Organizations (NGOs) that support farming and innovations of adaptive and sustainable farming systems, yields have remained stagnantly low. This was substantiated by 2020 FAOSTAT data (), which showed the yields of the major crops in Lesotho from 1989 to 2019. The maize trendline showed a steady decline over the years. Furthermore, a study using the time-series data of 54 years from 1961 to 2013 by Morojele and Sekoli (Citation2016) revealed a general trend decline of 12% that was attributed to climate-related risks and low productivity was ascribed to a lack of substantial efforts by farmers to improve productivity.
Of all the agroecological zones, Senqu River Valley (SRV) is not only the smallest (9% of the total surface area) but also the most food insecure with the highest malnutrition rate for children under the age of five (Lesotho Vulnerability Assessment Committee, Citation2018) and the least productive in maize by being the driest with maximum annual precipitation of 500 mm, which is below maize crop water requirement of more than 500 mm and has low soil fertility (FAO, Citation2020). Other factors include fewer heat units since some parts of the zone experience snow and frost for a long time and fail to accumulate the required heat units for maize productivity. High dependence on rainfed crop production, which typically results in low yields, is among the key production and productivity challenges of this zone (Lesotho Bureau of Statistics, Citation2019).
It was against these vulnerability characteristics that the SRV was selected as the study area because even so, maize remains the most grown and important staple crop. Then, if its yield was increased, it may considerably decrease the high dependency on imported maize, increase the food security of the agriculture-dependent households, decrease abject poverty, and improve the general economy. To achieve this, an understanding of different farming systems and varied factors that contribute to the improvement of maize productivity is required. Such factors could include understanding crop management, production costs and returns on the investment which are yet poorly understood. Some studies have highlighted the renewed emphasis to adopt and intensify climate-smart practices like Conservation Agriculture (CA), Agroforestry as well as Machobane Farming systems because of their potential to increase yields and improve food security (Lambert et al., Citation2016). Although these innovative systems have been in place for more than 20 years (e.g., CA was first introduced in 2000), the adoption rate is very low (Soai et al., Citation2018). This low adoption rate may be ascribed to a lack of research comparing the on-farm income (hereafter referred to as farm economic margin) of different MSFSs practised in Lesotho. The results of which may be used to support successful adoption by giving precise measurements of the degree to which each system contributes to the farming household income.
Therefore, this study seeks to answer the question: to what extent do the farm economic margin of different farming systems differs? This question was grounded on our working assumption that maize yield is influenced by different farming systems and that different farming systems have different farm economic margins. This study further assumes that knowledge of the different farm economic margins offered by different farming systems can influence the farmers’ choice of the farming systems. The objectives of this study are to compare the maize yield under different farming systems, identify the most beneficial intercrop to combine with maize and calculate the FEM of different farming systems. While our focus is on maize, we use a holistic farm approach whereby we consider all farm enterprises in our analysis, that is, different crops and livestock in a farm, hence the use of the concept term maize-based smallholder farming systems (MSFSs). For all crops, we standardize the land size to a 1 ha plot to allow for comparison of the different MSFSs. Among many factors that affect crop and livestock production, drought was mentioned as the biggest threat by all interviewed farmers, and thus, for this study, we focused mainly on drought for modelling and simulation of different systems using Olympe software. We use the results from the field (interviews) for the 2019/2020 agricultural year as the basis for our modelling and simulation of yields to the accepted levels. We recommend strategies for the improvement of the MSFSs through the assessment of Strengths, Weaknesses, Opportunities, and Threats (SWOT), and Threats, Opportunities, Weaknesses, and Strengths (TOWS) whose acronym is SWOT-TOWS analysis.
We further define the MSFSs as they occur and are commonly known and understood in the study area (SRV). The MSFSs occur in about five categories in SRV. The most dominant category is monoculture which is whereby the same crop is grown on the same piece of land for at least two consecutive seasons (Chandra et al., Citation2022). In the SRV, monoculture occurs in two categories: A farmer-sponsored system whereby farmers bear all the costs of production and enjoy all the benefits. Contract farming or block farming is whereby the government or a private company enters into a sharecropping agreement with farmers. While the contracting entity incurs all costs of production, farmers provide only land and labour, and the proceeds are shared according to the agreement (Matenga, Citation2017; Rantšo & Seboka, Citation2019). The second most popular-most is Polyculture or mixed culture is whereby two or more crops are grown on the same piece of land at the same time (Chandra et al., Citation2022). The least popular ones are Conservation Agriculture (CA) or zero tillage is whereby crops are grown with minimum soil disturbance (Corsi & Muminjanov, Citation2019; FAO, Citation2017; Findlater et al., Citation2019; Scheba, Citation2017), the Machobane farming system (MFS) is whereby crops are grown following different cropping patterns such as crop rotation, intercropping, relay cropping, and sequential cropping (Mekbib et al., Citation2011), and the Agroforestry system is whereby crops are grown together with fruit trees and/or animals on the same piece of land (FAO & ICRAF, Citation2019).
2. Methodology
The conceptual framework () of this study was grounded on the two analytical methods, Olympe software and SWOT-TOWS. Olympe software is a multiscale software that can be used for holistic assessments of multifaceted approaches to farming systems. It can build scenarios to assess the response of farmers when faced with external hazards (Stroesser et al., Citation2018). The modelling and simulation tools from the software allow for a better analysis of the impacts of the different hazards forecasted by farmers or stakeholders such as drought, price fluctuations, low yield, etc. and the trajectories they can take to overcome or reduce the impacts of the hazards (Jongrungrot, Citation2021). Olympe software was used to model and simulate the farm economic margin (FEM) of the farms over seven years from 2020 to 2026 using real-time prices fixed in 2019. FEM was calculated from the following formula: FEM = (C1 + … + Cn + L1 + … + Ln)−(Vc1 + … + Vcn + VL1 + … + VLn), where FEM is the total on-farm income, C1 to Cn is the income from maize and other intercrops, L1 to Ln is the income from different types of livestock, VC1 to VCn is variable costs from maize and other intercrops, and VL1 to VLn is variable costs from different types of livestock.
Figure 2. Study conceptual framework.
Three scenarios for the simulation were studied (Jongrungrot, Citation2021): 1) Normal Scenario: the seven years was segregated into two parts for main crops (maize, sorghum, beans and peas), the first two years used real farm conditions and the last five years was simulated through adjustment of inputs to increase yield closer to acceptable potential attainable levels () (FAOSTAT, Citation2020) based on farmers’ cropping plans and the available recommended inputs rates (Table ); 2) Scenario 1 (drought hazard forecasting), drought was forecasted to occur in 2022 and 2026 and envisaged to reduce all the products yield by 40% to assess the resilience of farmers against this threat; and 3) Scenario 2 (trajectories), this scenario highlighted the trajectories farmers could take to build resilience against drought and improve FEM via the crop and livestock management improvement. Procedure: in all farms, the fertilizer and seed application rates were improved to increase the yields and farm economic margin (still regarding FAOSTAT data and Department of Crops Services recommendations taking into consideration the observed survey results and maintaining the 40% loss due to forecasted drought hazard in 2022 and 2026). Livestock products were increased by 5% while neonatal mortality (death in the first 28 days of birth) was reduced by 10% (Wong et al., Citation2021).
Table 1. Seeding and fertilizer rates recommended by the department of crop services
2.1. SWOT-TOWS analysis
SWOT framework is an analysis tool for categorising environmental factors (both internal and external) of an entity under the study by listing its strengths, weaknesses, opportunities, and threats. TOWS (Threats, Opportunities, Weaknesses, and Strengths) on the other hand is a tool that forms the basis for the formulation of strategies on the identified strengths, weaknesses, opportunities, and threats by creating a TOWS matrix that matches the strengths that an entity has to seize new opportunities whilst finding ways to reduce the impact of weaknesses and threats (Asadpourian et al., Citation2020). The four-square grid was developed to list the identified strengths, weaknesses, opportunities, and threats of the farming systems of the studied farmers (SWOT), after which TOWS analysis was performed through cross-matching between strengths, weaknesses, opportunities and threats and strategies were developed in four themes: SO (max–max), WO (min–max), ST (max–min) and WT (min–min). Each strategy was achieved by adding different external and internal factors together (Asadpourian et al., Citation2020).
2.2. Statistical analysis
Descriptive statistics were used to describe and summarize the characteristics, distribution, and variability of the farms through frequencies, percentages, central tendency, and measures of variation.
2.3. Description of the study area
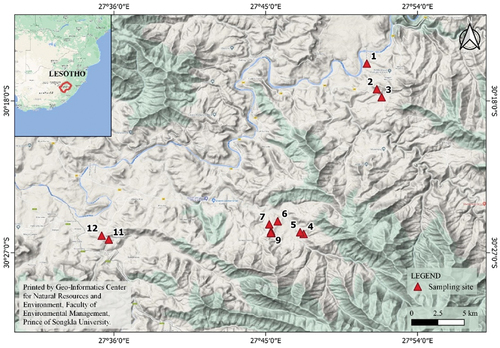
The study was conducted in the Senqu River Valley (SRV) agroecological zone, Lesotho (). SRV is a 2,732 km2 tapering band of land flanking the banks of the Senqu river of the total country land area with a population of about 170,818 people (Lesotho Bureau of Statistics, Citation2016; Lesotho Meteorological Services, Citation2019). shows the map of the study area and the location of the interviewed farmers.
Figure 3. Map of the study area.
2.4. Sampling and data collection
In Lesotho, smallholders are described as resource-poor farmers with a landholding of not more than 1.5 ha. These types of farmers typically produce to feed their families with little or no surplus for sale. Since these constitute most of the farming population, their complex production systems require a deeper understanding of the suggestion of appropriate policies and interventions. Purposive sampling was used to select a sample of six pairs of farms (12 farms) to represent the dominant MSFSs found in the study area based on the following criteria: a) farms not exceeding 1.5 ha in size, b) farmers that lived below the Lesotho poverty line (M648.88/capita/month equivalent to $43.26/capita/month; World Bank Group & Bureau of Statistics, Citation2019), and c) any farmer could be an informant. Additionally, four Extension Officers, one Agricultural Information Officer and one Project Field Officer were orally interviewed as key informants. The purpose was to gather information about the farming systems, agricultural information services available to farmers and government policies supporting agriculture that would form the basis for SWOT-TOWS analysis. The interviews were conducted between February and March 2021 to collect primary data for the 2019/2020 agricultural year through face-to-face interviews with a structured questionnaire. Secondary data were collected throughout the study period from books, online sources, reports, journal publications, etc.
3. Results
3.1. Socio-economic characteristics of studied farming households
Table illustrates that about 67% of the studied household heads were predominantly male and were either separated or widowed. This status could be attributed to the fact that household heads were mostly older people with an average age of 64 years old since Lesotho’s life expectancy was reportedly 54.84 years as of 2020 (Knoema, Citation2021). Additionally, the oldest household head aged 84, while the youngest was 42 years old. About 67% had primary education, that is, they could read and write, and a majority (75%) of them owned their farmland implying they had full power to choose the kind of farming system to practice in their fields. Furthermore, the average household head monthly income was about $35 which was derived mostly from the old-age pensions. Meanwhile, the average total household monthly income (total earnings of all adult household members) was around $44 which was mostly a combination of old age pension, casual labour, and/or remittances from seasonal labour in South Africa. Additionally, the average household size was five members, this implies that the studied households lived in poverty since the Lesotho poverty line is estimated at $43.26/capita/month (World Bank Group & Bureau of Statistics, Citation2019).
Table 2. Socio-economic characteristics of the studied farming households in SRV
3.2. General characteristics of the smallholder farming systems of the studied farmers
Table shows that, generally, all farmers had one common goal for their choice of the farming system, which was to increase the yield. The majority (75%) of households owned the land that provided them with the liberties to practice farming systems of their choice. Notwithstanding,monoculture systems (both farmer-sponsored and contract farming) had better maize yields than other systems, and the evidence suggests that farmers who practised other systems did not achieve their envisaged yields since the average yields were as low as 0.5 metric tonnes/ha. While the farmers claimed that climatic factors such as drought and hail were the main factors affecting their production, the analysis of the crop management suggests that these factors are rather secondary. The main factors could be the crop management strategies like seeding rate, which was found to be lower than recommendations by the Ministry of Agriculture and Food Security (MAFS), seed type, and soil fertility since farmers added little or no fertilizer, and poor agricultural practices as weeds were observed in the fields and there was no proper pruning of trees. This was particularly evident in monoculture contract farming where seed and fertilizer application rates were as recommended by the government and the yield was higher than in all other systems. Livestock management was also a challenge that led to low productivity, for example, livestock feeding depended entirely on communal grazing with little supplementary feeding of only salt. Diseases and pests, which to some extent resulted in livestock mortality, were also reported by all households implying poor livestock management.
Table 3 Management of Different Farming Systems in 2019/2020
3.3. Farm economic margins under the normal scenario, scenario 1, and scenario 2
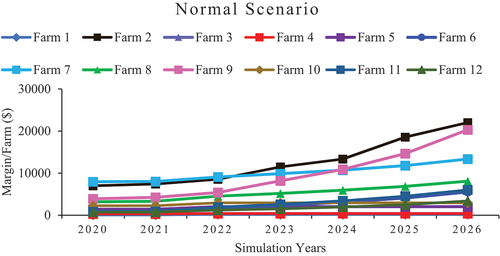
shows that while all the farms had low farm economic margin under the real-time farm conditions (i.e., in 2020 and 2021), farms 2, 7, and 9 had better FEM than the rest of the farms. However, maize contributed the lowest percentage in the whole farm economic margin ranging from 4.0% to 6.2%, the intercrops percentage share ranged from 9.5% to 72.0% and 5.8% to 9.0% for pumpkins and beans, respectively, while peas, which typically follow a monocropping pattern, contributed 2%. Meanwhile, on average, livestock contributed the highest percentage of 28.2–58.2%. Similarly, when the results were simulated over a five-year period where crop inputs (seed and fertilizer) were adjusted by increasing their application rates for main crops (maize, beans, and peas) as per government recommendations and livestock mortality decreased by 10%, similar farms (i.e., farms 2, 7, and 9) continued to show more increase in farm economic margins than other farms. Factors that caused these farms to have better performance than others included increased yields for both maize and intercrops such as pumpkins, beans, and peas, which are high-value crops with high market values. They also had livestock such as sheep and cattle, which have higher market values. Conversely, factors that led to other farms’ poor performance were some grew only maize (no intercrops), some had few intercrops (either beans or pumpkins), and few or no livestock.
Figure 4. Farm economic margin of different farms in normal scenario.
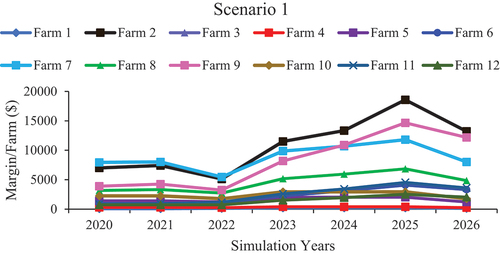
depicts the FEM of farms under a drought hazard. The total average FEM for all farms showed a decline. This is because drought affected both crops and livestock by reducing yields and increasing livestock mortality caused by diseases associated with drought. Nevertheless, farms 2, 7, and 9 displayed a higher resilience than other farms whereby their average FEM was still higher. The reason was that they had many farm products whose economic margins complemented one another even under the drought. Other farms with few farm products were negatively affected.
Figure 5. Farm economic margin of different farms in scenario 1.
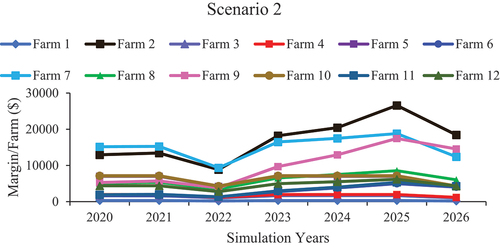
When farms were subjected to further crop and livestock adjustments whereby seed and fertilizer rates were further increased for major crops (maize, sorghum, beans, and peas), other crops (pumpkins and spinach), fruit trees management like pruning, and 5% adjustment on livestock products like milk, wool, and mohair, the average FEM of different farms increased as illustrated on . However, some farms, particularly farms 1, 3, and 4, remained with awfully low FEM. The reasons for their low FEM were that they produced only maize and had no cash crops, and they also had no livestock that would have otherwise assisted to increase FEM.
Figure 6. Farm economic margin of different farms in scenario 2.
3.4. Distribution of the variance of farm economic margins of different farms
presents the different MSFSs economic margin variability distribution. Comparatively, the three-box plots show that there was high farm economic margin variability within and across the scenarios showing strong differences within and across the farming systems. The means for different scenarios were $4,200 ± $4,268, $3,615 ± $3,678, and $6,261 ± $5,235 for normal scenario, scenarios 1 and 2, respectively. This shows that the average FEM was lowest in scenario 1, while it was highest in scenario 2. The high standard deviation in all three scenarios showed that some FEMs were spread out far away from the mean. Notwithstanding, scenario 1 had the lowest average FEM and standard deviation due to drought. However, scenario 2 average FEM increase and a standard deviation lower than the mean highlighted that with improvement in both crops and livestock management, farms could increase FEM and build resilience against drought.
Figure 7. Distribution and variability of farm economic margin of different farms in different scenarios.
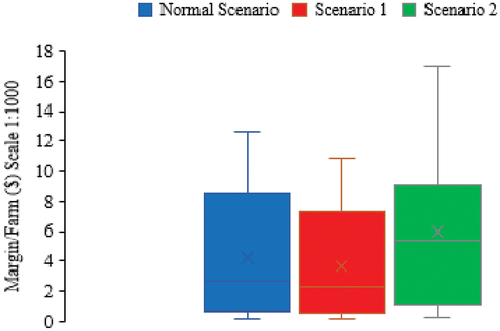
Similarly, the high ranges for the three scenarios, which were $12,461, $10,737, and $16,168/farm/year, marked the extreme differences between the minimum and the maximum FEMs, which ranged from extremely low to exceptionally high. Monoculture farms except farm 2 had the lowest FEM in all the three scenarios, whereas farms with high-value intercrops and livestock (especially sheep and cattle) had the highest FEM. This again underpinned the importance of farm enterprise diversification. While the interquartile ranges (IQR) were also very high at $7,852, $6,670, and $6,998/farm/year for the three scenarios, the smaller IQR for scenario 2 compared to the normal scenario indicated that improvement in both crops and livestock management does not only increase FEM but also reduces the spread of the FEM.
3.5. Strengths, weaknesses, opportunities and threats identification and development strategies (strategies that could be employed to improve the farming systems)
presents the identified strengths, weaknesses, opportunities, and threats of the SRV farming systems and the devised strategies that could assist in reducing the impact of threats, capitalising on the opportunities, and overcoming the weaknesses. The identified strengths included the literacy of the household heads which could assist them in making informed decisions regarding farming systems to practice and could also give them access to information on new agricultural technologies they could use to improve their farming systems. Again, most of the household heads owned the land, meaning a reduction in production costs as they did not have to rent the land. The other strength was that most household heads were still capable of working on the farms, although they were mostly old.
Figure 8. SWOT-TOWS matrix of different MSFSs.
The identified weaknesses included low crop rotation and diversification, which resulted in low farm economic margins. Most farmers reported that they produced similar crops to those they produced in the previous year. This poses a challenge, especially for crop nutrition whereby similar nutrients are taken out with limited replenishment since most farmers did not apply either manure or chemical fertilizers. Again, weeds were observed in the fields, a low seeding rate was also observed, and farmers reported mortality in livestock. This essentially revealed that farmers lacked proper crop and livestock management knowledge or skills, which resulted in low crop and livestock yields. As earlier stated, most farmers were old, this could be a threat to the future of agriculture since most farmers reported their children were seeking jobs in other sectors other than agriculture.
Moreover, the lack of farmers’ groups was another identified weakness. With farmers’ groups, farmers could reduce high production costs through input bulk buying and could also have bargaining power when marketing their produce. They might perhaps be able to voice their opinions to influence policies that affect them. Limited resources were also stated as most farmers reported a lack of productive assets like farming equipment except basic tools like hoes and a lack of funds to invest in farming. Limited research on farming systems, which would otherwise assist in improving the farming systems and inherent food security was observed as another factor contributing to the weaknesses.
Nonetheless, some opportunities were identified that might work to the advantage of farmers. Those opportunities included government policies such as the input subsidy policy that led farmers to buy inputs at subsidised prices, MAFS radio programs and quarterly agriculture publications where farmers could get agricultural information and the availability of agricultural services at the village level for face-to-face interaction. On the contrary, the established threats were a severe drought, crop and livestock pests and diseases that resulted in reduced yields, unstable prices, and high input costs that farmers could not afford due to poverty. Lastly, non-adherence to guiding principles of farming systems such as CA and Machobane whereby no mulch was applied or any cover crop was grown on the CA fields, and different cropping patterns were not well practised in the Machobane farming system.
To take advantage of the strengths and opportunities and reduce the weaknesses and the impacts of the threats, strategies devised included improving and encouraging readership of the agricultural quarterly publication by distribution to the grassroots level. Encouraging the formation of farmers’ groups may help to address the high input costs through bulk buying. The lack of crop and livestock management skills, which in part led to low economic margins in the normal scenario, highlighted a dire need for agricultural extension services to provide rigorous training and demonstrations for farmers to improve production and productivity.
Proper implementation of CA and Machobane together with the adoption of farming systems that reduce input costs like agroforestry strategies devised to maximise the strengths and reduce the impacts of threats. Finally, strategies to minimise the impacts of both weaknesses and threats were among others, to increase crop and livestock diversification to build resilience against severe drought, farmers must participate in government livestock vaccination campaigns and practice crop rotation to reduce the prevalence of crop and livestock pests and diseases. They must also grow high-value crops to increase the household income which could improve their livelihoods and allow them to reinvest back in farming.
4. Discussion
This study reported the results from a survey of 12 interviewed farmers in the Senqu River Valley agroecological zone, Lesotho. The focus was to establish the economic margins of different farming systems practised by farmers in this area. This study found many different factors that could be attributable to low crop and livestock yields that inherently resulted in low farm economic margins that exacerbated poverty and food insecurity. Among others, socio-economic factors such as poverty were found to hinder farmers from investing properly in farming. Except for those practising contract farming, farmers stated that they could not afford the seeds and fertilizers. All interviewed households lived below the poverty line meaning little money they had was spent on more urgent needs like food. Their education level could be another contributing factorsince about 92% had either primary level education or none. This was in line with the findings of (Rothman et al., Citation2019) who reported that poverty and low level of education may have contributed to the food insecurity and poor nutrition status of their study participants. The old age of household heads also implied limited opportunities for off-farm activities and dependence on only remittances or gifts, hence low household income, as was reported by the Lesotho Vulnerability Assessment Committee (Citation2018).
The high farm economic margin variability found within and across the farming systems validated the observed differences in the crop and livestock management in different farming systems. For instance, although most farms used hybrid seeds, they did not use the recommended seeding rates, a majority did not use fertilizers, and others used very low fertilizer rates to the detriment of yield. This was substantiated by the Lesotho Bureau of Statistics, 2021, which reported that SRV used the lowest quantities of inorganic fertilisers in the agricultural year 2019/2020. This could be ascribed to a lack of crop management skills in basic farming techniques such as types and rates of seeds and fertilizers, practising crop rotation, and intercropping with nitrogen-fixing crops, trees, or shrubs that could assist in increasing yields and reducing production costs (Thar et al., Citation2021), while others were constrained by poverty. Maize yield was seemingly not influenced by intercrops such as beans, which are known to improve soil fertility as the yield was highest in monocropping. This again may be attributable to the low seed rate, which might not have provided an adequate bean population for the maximum effect. Furthermore, ignorance was also observed as a contributing factor to low crop yields that resulted in low economic margins since even farmers with livestock hardly took advantage of the available manure to improve soil fertility and did not follow the guidelines and principles of some farming systems like CA and Machobane. While yield is not attributable to fertilizers alone, studies have proved that fertilizers may considerably increase yield (Lenis et al., Citation2017).
Another factor was drought. While drought indeed affected the farm economic margin by reducing the crop and livestock productivity, the farm economic margins achieved in scenarios 1 and 2 proved that with improvement in crop and livestock management, farmers may build resilience against drought. Other factors that could have led to the variability could be the cropping patterns and the different types of enterprises involved in different farms. For example, farms with only maize (monocropping) had lower economic margins than their intercropping counterparts. This could be due to the high economic value of the intercrops used such as beans and pumpkins. There was even a higher tendency for higher farm economic margins to be associated with more diversified farms, such as those with maize, other intercrops, sheep, and cattle, than those with only maize or maize with other crops without livestock. The variability observed in farms with both crops and livestock may be attributed to the differences in the number and types of livestock. This claim has been substantiated by different studies that analysed the differences between the economic margins of monocropping and intercropping systems in rubber production (Chhiev & Jongrungrot, Citation2021; Jongrungrot & Kheowvongsri, Citation2021). This puts more emphasis on the importance of farm enterprise diversification. The benefits of diversification of farm enterprises, either crops or livestock, extend beyond the increase in the economic margin and overall household income improvement but improvement in food security, reduction in soil erosion, and biodiversity improvement (Cheng et al., Citation2017; Cho et al., Citation2016; Massawe et al., Citation2016) and ultimate sustainability of the farming systems.
5. Conclusion
This study was inspired by the reported low yields achieved in this zone (Morojele & Sekoli, Citation2016), the high poverty rate (World Bank Group & Bureau of Statistics, Citation2019) and low food security (Lesotho Vulnerability Assessment Committee, Citation2018). It aimed to provide insights for farmers on how best they could improve their farming systems in a pursuit to increase yields, improve farm economic margins and general household income, and food security. This study found that although maize yield was very low in other farming systems, it was above average in the monoculture farming system, ranging from 0.85 to 1.13 metric tonnes with the contract farming system having the highest. This result suggests that the contract farming system showed the potential to increase maize yield and may be recommended to improve food security. While it cannot be overemphasized that maize yield must be increased at all costs, the trade-offs of this system may outweigh the benefits through loss of biodiversity, disturbance of ecosystems, pest, and disease build-up, etc. thus more resilient and sustainable farming systems may provide a more viable option than monocultures (Lutter et al., Citation2021).
Some findings of this study established that farmers could build resilience against drought and increase overall farm economic margin through improvement in cropping plans like employing different cropping patterns as it was found that farming systems with other cropping patterns than monocropping had better farm economic margins than their monocropping counterparts. The inclusion of intercrops such as beans and pumpkins, which have high market value, has proved to be a viable option for the improvement of farm economic margin. In particular, the crop combinations that had higher FEM were maize and pumpkin, while maize and beans came second. Conversely, the intercrops and livestock influence on the maize yield was not evident since some farms with both intercrops and livestock still achieved low maize yield. However, it was found that farms with livestock had rather higher FEM than those without livestock. It may therefore be concluded that, to increase the FEM, farmers must integrate livestock into the different MSFSs, choose intercrops with high market value, and improve both crop and livestock management skills. This, in turn, may improve households’ income and reduce poverty and consequently result in an overall improvement of household food security.
Finally, the strategies were devised for further consideration by policymakers that may help to mitigate some of the weaknesses and threats of the MSFSs based on the identified strengths and opportunities. Those strategies include that MAFS must ensure that agricultural information reaches the farmers through the delivery of the agricultural publication to the village level, encouraging the formation of farmers’ groups to reduce production costs and to provide training to farmers that may build their capacity to manage both crops and livestock to increase their productivity. For farmers, the devised strategies underscore the need to transition from monoculture to farming systems that employ different cropping patterns and increase the number of intercrops, especially those with high market value like pumpkins and beans to maximise farm economic margins. Additionally, in the face of climate change that exacerbates drought frequency and severity and also to reduce high production costs, farmers must properly implement farming systems that encourage diversification, reduce production costs, and conserve soil and moisture such as CA, Machobane, and Agroforestry for overall farming systems sustainability in the Senqu River Valley agroecological zone. Moreover, farmers are recommended to find ways to complement on-farm income by engaging in some off-farm activities during the off-season to enable them to invest in farming.
Acknowledgements
This work was supported by the Prince of Songkla University under the Prince of Songkla University President Scholarship and the Faculty of Natural Resources Research Grant. It is a part of a master’s degree thesis.
Disclosure statement
No potential conflict of interest was reported by the author(s).
Additional information
Funding
Notes on contributors

Vichot Jongrungrot
Qhithiwe Anna Seko (Miss) A master’s degree student at the Prince of Songkla University, Faculty of Natural Resources, majoring in Agricultural Development. Her thesis research focuses mainly on the agricultural farming systems analysis.
Asst. Prof. Dr. Vichot Jongrungrot A lecturer at the Prince of Songkla University, Faculty of Natural Resources. He is a student advisor to both master’s and PhD students in the Agricultural Development program and Tropical Agricultural Resource Management, respectively. His research interests include farming systems analysis and policy and plan analysis.
References
- Asadpourian, Z., Rahimian, M., & Gholamrezai, S. (2020). SWOT-AHP-TOWS analysis for sustainable ecotourism development in the best area in Lorestan Province, Iran. Social Indicators Research, 152(1), 289–19. https://doi.org/10.1007/s11205-020-02438-0
- Chandra Nath, P., Sileshi, G. W., Ray, P., Das, A. K., & Nath, J. (2022). Variations in soil properties and stoichiometric ratios with stand age under agarwood monoculture and polyculture on smallholder farms. Catena, 213, 106174 . https://doi.org/10.1016/j.catena.2022.106174
- Cheng, A., Mayes, S., Dalle, G., Demissew, S., & Massawe, F. (2017). Diversifying crops for food and nutrition security – A case of teff. Biological Reviews, 92(1), 188–198. https://doi.org/10.1111/brv.12225
- Chhiev, B., & Jongrungrot, V. (2021). Rubber agroforestry system (RAS) practices overcoming rubber price and soil erosion in Southern Thailand. Int J of Agric Tech, 17(1), 13–32 http://www.ijat-aatsea.com .
- Cho, A., Tun Oo, A., & Speelman, S. (2016). Assessment of household food security through crop diversification in Natmauk Township, Magway region, Myanmar. Tropentag 2016. Conf on Int Res on Food Sec, December 2014, 1–5.
- Corsi, S., & Muminjanov, H. (2019). Conservation agriculture: A training guide for extension agents and farmers in Eastern Europe and Central Asia. In Conservation agriculture. Rome: FAO 140 9783319116204 . doi:https://doi.org/10.1007/978-3-319-11620-4.
- FAO. (2017). Conservation agriculture. Soil and climate (Vol. 66 1 pp. 131–162). CRC Press. https://doi.org/10.1201/b21225-4.
- FAO. (2020). 2. Water and soil requirements. Available in http://www.fao.org/3/u3160e/u3160e04.htm [ accessed on 18/02/2020]
- FAO, & ICRAF. (2019). Agroforestry and tenure. In Forestry Working Paper, Rome (No. 8; CC BY-NCSA 3 0.IGO). https://www.purprojet.com/agroforestry-and-reforestation/
- FAOSTAT. (2020). FAOSTAT. Available in http://www.fao.org/faostat/en/#data/QCL [ accessed on 23/03/2020]
- Findlater, K. M., Kandlikar, M., & Satterfield, T. (2019). Misunderstanding conservation agriculture: Challenges in promoting, monitoring and evaluating sustainable farming. Environmental Science & Policy, 100(May), 47–54. https://doi.org/10.1016/j.envsci.2019.05.027
- Greyling, J. C., & Pardey, P. G. (2019). Measuring Maize in South Africa: The shifting structure of production during the twentieth century, 1904–2015. Agrekon, 58(1), 21–41. https://doi.org/10.1080/03031853.2018.1523017
- Jongrungrot, V. (2021). Resilience, various benefits, and constraints of rubber agroforestry systems in southern Thailand. Int J of Agric Tech, 17(2), 517–534 http://www.ijat-aatsea.com.
- Jongrungrot, V., & Kheowvongsri, P. (2021). Comparative study between rubber agroforestry systems and rubber monocultures and soil erosion decreases via rubber agroforestry profile and crown cover in lower southern Thailand Kaset J of Soc Scie . 42, 255–261.
- Kamara, J. K., Agho, K., Renzaho, A. M. N., & Bhattachan, A. (2019). Understanding disaster resilience in communities affected by recurrent drought in Lesotho and Swaziland—A qualitative study. PLoS ONE, 14(3), 1–27. https://doi.org/10.1371/journal.pone.0212994
- Knoema. (2021). Lesotho - Life expectancy at birth. Available in https://knoema.com/atlas/Lesotho/topics/Demographics/Age/Life-expectancy-at-birth [ accessed on 28/10/2021]
- Lambert, D. M., Bisangwa, E., Eash, N. S., & Marake, M. (2016). Minimal tillage and crop residue retention adoption, input demand, and maize (Zea mays L.) production: A household survey analysis of smallholder producers in Lesotho. Journal of Soil and Water Conservation, 71(2), 118–128. https://doi.org/10.2489/jswc.71.2.118
- Lenis, S. O. L.-T., Omonona, B. T., Sanou, A., & Ogunleye, W. O. (2017). Is increasing inorganic fertilizer use for maize production in SSA a profitable proposition? Evidence from Nigeria. Food Policy, 67, 41–51. https://doi.org/10.1016/j.foodpol.2016.09.011
- Lesotho Bureau of Statistics. (2016). . Maseru, Lesotho Vol III (Maseru, Lesotho: Bureau of Statistics) , .
- Lesotho Bureau of Statistics. (2019). 2018-2019_agricultural_production_survey_crops 27 (Maseru, Lesotho: Bureau of Statistics) .
- Lesotho Bureau of Statistics. (2021a). Kingdom of Lesotho agricultural production survey crops 25 (Maseru, Lesotho: Bureau of Statistics) .
- Lesotho Bureau of Statistics. (2021b). QGDP_Final_Report_1st_Quarter_2021. Maseru, Lesotho.
- Lesotho Bureau of Statistics. (2022). Key Indicators crops 2019/2020. Available in https://www.bos.gov.ls/default.htm [ accessed on 15/05/2022]
- Lesotho Meteorological Services. (2017). Lesotho’s national climate change policy. Ministry of Energy and Meteorology, Lesotho. http://cses.washington.edu/db/pdf/snoveretalsok816.pdf-Executivesummary:http://cses.washington.edu/db/pdf/snoveretalsokexecsum819.pdf
- Lesotho Meteorological Services. (2019). The Climate of Lesotho. Available in http://www.lesmet.org.ls/open/Climate-of-Lesotho [ accessed on 10/01/2020]
- Lesotho Vulnerability Assessment Committee. (2018). Vulnerability assessment and analysis report. Maseru, Lesotho, 1–77.
- Lutter, R., Henriksson, N., Lim, H., Blaško, R., Magh, R. K., Näsholm, T., Nordin, A., Lundmark, T., & Marshall, J. D. (2021). Belowground resource utilization in monocultures and mixtures of Scots pine and Norway spruce. Forest Eco and Man, 500 119647 . https://doi.org/10.1016/j.foreco.2021.119647
- MAFS, & Lesotho Bureau of Statistics. (2019). Strategic Plan for Agriculture and Rural Statistics for Lesotho 2019/20 - 2023/24.
- Massawe, F., Mayes, S., & Cheng, A. (2016). Crop diversity: An unexploited treasure trove for food security. Trends in Plant Sci, 21(5), 365–368. https://doi.org/10.1016/j.tplants.2016.02.006
- Matenga, C. R. (2017). Outgrowers and livelihoods: The case of Magobbo smallholder block farming in Mazabuka district in Zambia. Journal of Southern African Studies, 43(3), 551–566. https://doi.org/10.1080/03057070.2016.1211402
- Mekbib, S. B., Olaleye, A. O., Mokhothu, M. N., Johane, M., Tlali, S. B., & Taddese, W. G. (2011). Assessment of the impacts and adaptive capacity of the machobane farming system to climate change in Lesotho Afri Tech Pol Stud (Issue 60).
- Morojele, M. E., & Sekoli, M. (2016). Trend analysis of maize production in Lesotho and its distribution among the ecological zones. Euro J of Agric and Fores Research, 4(March), 1–7 .
- Rantšo, T. A., & Seboka, M. (2019). Agriculture and food security in Lesotho: Government-sponsored block farming programme in the Berea, Leribe and Maseru districts. Cog Food & Agric, 5(1 1657300). https://doi.org/10.1080/23311932.2019.1657300
- Rothman, M., Ranneileng, M., Nel, R., & Walsh, C. (2019). Nutritional status and food intake of women residing in rural and urban areas of Lesotho. South African Journal of Clinical Nutrition, 32(1), 21–27. https://doi.org/10.1080/16070658.2017.1415783
- Santpoort, R. (2020). THE drivers of maize area expansion in sub-Saharan Africa. How policies to boost maize production overlook the interests of smallholder farmers. Land, 9(3), 68. https://doi.org/10.3390/land9030068
- Scheba, A. (2017). Conservation agriculture and sustainable development in Africa: Insights from Tanzania. Natural Resources Forum, 41(4), 209–219. https://doi.org/10.1111/1477-8947.12123
- Soai, P. D., Akintunde, O. A. M., & Keregero, K. J. B. (2018 Assessment of adoption of conservation agriculture in Roma Valley, Lesotho). Int. J of Scie and Res 8 2 739–744 . https://doi.org/10.21275/ART2018345.
- Stroesser, L., Penot, E., Michel, I., Tongkaemkaew, U., & Chambon, B. (2018). Income diversification for rubber farmers through agroforestry practices. Revue Int Des Études Du Dév, 235(3), 117. https://doi.org/10.3917/ried.235.0117
- Tanumihardjo, S. A., McCulley, L., Roh, R., Lopez-Ridaura, S., Palacios-Rojas, N., & Gunaratna, N. S. (2019). Maize agro-food systems to ensure food and nutrition security in reference to the sustainable development goals. Global Food Sec, August, 100327. https://doi.org/10.1016/j.gfs.2019.100327
- Thar, S. P., Farquharson, R. J., Ramilan, T., Coggins, S., & Chen, D. (2021). Recommended vs. practice: Smallholder fertilizer decisions in central Myanmar. Agric (Switzerland), 11(1), 1–20. https://doi.org/10.3390/agriculture11010065
- Wong, J. T., Vance, C., & Peters, A. (2021). Refining livestock mortality indicators: A systematic review. Gates Open Research, 5 75 , 1–31. https://doi.org/10.12688/gatesopenres.13228.1
- World Bank Group, & Bureau of Statistics. (2019). . In Lesotho poverty assessment (washington, DC: The World Bank Group). https://doi.org/10.1596/33030.