
 ?Mathematical formulae have been encoded as MathML and are displayed in this HTML version using MathJax in order to improve their display. Uncheck the box to turn MathJax off. This feature requires Javascript. Click on a formula to zoom.
Abstract
Agroforestry systems are thought to reconcile biodiversity protection with food production and as a means of climate change adaptation and mitigation options. The contribution of a coffee-based agroforestry system to tree diversity and carbon stock along altitudinal gradients in Western Ethiopia was assessed. At 500-m intervals, six transect lines were methodically set up throughout the altitudinal gradient. There were made a total of 60 sample plots, each measuring 40 m by 40 m. A total of 34 woody species were identified. Biomass carbon stocks and tree diversity were quantified across altitudinal gradients. In the middle altitude, there were more woody species (28) than in the top altitude, where there were only a few species (16). The tree plants stored around 40.6 t ha−1 of biomass carbon on average. Aboveground biomass had a carbon stock of 32.22 C t ha−1, whereas belowground biomass had a carbon stock of 8.38 C t ha−1. The lower altitude biomass carbon stocks were substantially bigger than the upper altitude, which were 48.4 C t ha−1 and 25.67 C t ha−1, respectively. With increasing altitude, the study found a statistically significant negative link between tree diversity and biomass carbon storage (P < 0.05). The negative link between biomass carbon stock and altitude was that tree parameters that determine the amount of biomass carbon sequestered in a plant, such as basal area, tree diversity, and density, decreased as altitude increased. Despite differences along altitudinal gradients, the systems supported a diverse range of tree species and biomass carbon stocks.
1. Introduction
Agriculture has become the most vulnerable to the effects of climate change (Mekonnen & Gebreyesus, Citation2011). As a result, human communities all over the world have devised a wide range of complex tactics for coping with climatic change and the natural environment (Gizachew & Shimelis, Citation2014). Understanding the true dynamics of climate change consequences at the local level, such as farm households and communities, is crucial (T. Tadesse et al., Citation2009). Smallholder farmers in a country like Ethiopia, which has a high level of ecological and cultural diversity, such as language, beliefs, and indigenous knowledge of conserving natural resources, are likely to have developed their own indigenous adaption mechanisms (Nair, Citation1993; Lin, Citation2020). To combat climate change, conserve biodiversity, and increase food production, subsistence farmers in various regions of the country have developed and adopted the practice of agroforestry (Jamnadass et al., Citation2013; Reppin et al., Citation2020).
Agroforestry is an old practice that involves growing trees or shrubs near or amid pastureland or crops in order to benefit from the subsequent ecological and economic interactions (Nair, Citation1993; Mkonda & He, Citation2017). They are specific local examples of methods that are relevant to a certain habitat, plant species, arrangement, management, and socioeconomic function, e.g., Coffee-based home-garden. Home-garden is specific due to its distinctive environment, plant species, arrangement and management, social and economic functions (Nair, Citation1993).
The likely importance of agroforestry is designated differently. As a result, due to the locality-specific nature of each agroforestry practice, they have evolved differently across the world. In Ethiopia, where arabica coffee originated, coffee-based agroforestry grows naturally as an understory shrub in native woods (G. Tadesse et al., Citation2014). It is also grown throughout a wide management gradient, but exclusively under shade (Zewdie et al., Citation2022). The practice is abundantly found in the southwestern and western parts of the country, where a large proportion of the country’s forest cover is found. As coffee shrubs are perennial crops, coffee-based agroforestry practices are believed to form a better biodiversity and biomass carbon sequestration system than other agroforestry practices (Buechley et al., Citation2015; Hylander et al., Citation2013; Tesfay et al., Citation2022). Another benefit of coffee-based agroforestry management is that it slows the rate at which ecosystems with trees are being converted to open agricultural landscapes (Hylander et al., Citation2013).
Due to the composition of trees and shrubs, the system sequesters a high amount of biomass carbon. It also contributes to maintaining food and nutrition security, helps diversify household income, provides fiber and energy to local communities (Jamnadass et al., Citation2013). Agroforestry systems have a high potential to offset greenhouse gas emissions compared to land resources converted to other more intensive forms of land uses owing to the carbon storage in trees, shrubs, and soils. In the case of traditional coffee farming, retaining a high degree of the canopy increases the capacity of the system to store more carbon in the tree and perennial crop components (Olsson et al., Citation2019).
In a wide range of ecological settings, the practices maintain biodiversity and provide ecosystem resilience in addition to biomass carbon stocking (Santos et al., Citation2022). Tropical and subtropical ecological zones are home to the majority of agroforestry systems (Nair, Citation1993). According to different researches, many tropical forests are under severe anthropogenic pressure and require management interventions to maintain overall biodiversity, productivity, and sustainability (Kurnar et al., Citation2006). Despite the fact that species composition often varied widely, examples from around the world demonstrate that tropical agroforestry systems can support high levels of biodiversity, often similar to native forest (Tscharntke et al., Citation2011). In such regions, subsistence farmers who care for a diverse range of trees to support their families might hearten carbon storage and tree diversity, which will benefit ecosystems (Sistla et al., Citation2016).
Understanding the places of convergence between carbon storage and biodiversity protection is one of the primary concerns at the intersection of climate change and ecosystem science (Mulatu & Hunde, Citation2020). Nonetheless, higher carbon storage potential is related to its co-existence with biodiversity conservation, which varies with the type of agroforestry practices (Santos et al., Citation2022).
Though carbon stocks and biodiversity in Ethiopian agroforestry systems have been researched (Eshetu et al., Citation2021; Manaye et al., Citation2021), there has been no research on coffee-based agroforestry systems across altitudinal gradients in Western Ethiopia. The majority of studies on agroforestry systems have mostly focused on food production and soil fertility management (Gebrewahid et al., Citation2019; Mulatu & Hunde, Citation2020. However, the impact of coffee-based agroforestry systems to carbon stocks and biodiversity conservation remains unexplored. For that reason, there is a limitation in addressing the contribution of coffee-based agroforestry systems towards tree diversity conservation and carbon sequestration acrossA agro-ecological differences (Tschora & Cherubini, Citation2020).
Therefore, the specific objectives of this study were to analyze tree species diversity in coffee-based agroforestry systems, quantify biomass carbon stock in tree species, and assess the effect of tree diversity on biomass carbon stock along altitudinal gradients. In the study area, the farmers were mostly coffee producers, but they also raise cattle. In addition, population density was varying across the ranges of the altitudinal gradients. The population of the upper land was higher, so they raise many cattle and tend to the production of other grains besides coffee to support the population density. On the other hand, as the altitude increased, the weather variables of the area was varying and decreased at the upper altitude. Therefore, due to these two reasons, we hypothesized that biomass carbon and tree diversity would change amongst the three gradients of coffee-based agroforestry systems. In addition, because of a projected weather variable-related drop with elevation ascent, the high biomass carbon stock would be recorded at lower altitudes and associated to tree diversity; and, as a result, both biomass carbon stock and tree diversity would decrease with elevation.
2. Material and methods
2.1. Study area description
The study was conducted in the Gimbi district in the West Wollega Zone of Oromia National Regional State, Western Ethiopia (Figure ). The district is located between 142,000 and 174,000 UTM E and 99,300–1,029,000 UTM N.
Figure 1. Map of the study area
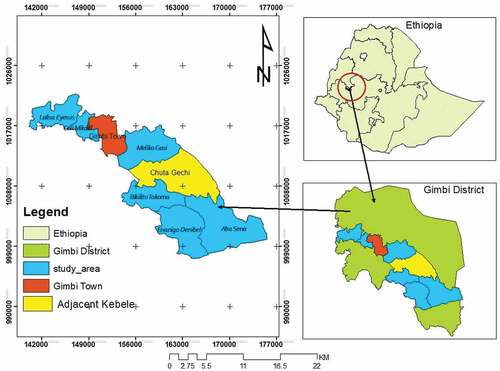
Gimbi district has a Weina Dega climate condition. The mean minimum and maximum annual temperature of the area was between 10°C and 30°C. The mean annual rainfall is 1400–1800 ml per year (Abera et al., Citation2015). In the Gimbi district, June, July, and August are the summer months similar to most of the country’s annual seasons. It lies at an altitudinal range of 1200–2222 m.
Every location in Ethiopia is categorized as lowland, midland, or highland depending on its altitude: below 1500 m asl., between 1500 and 2300 m asl., and beyond 2300 m asl. In this categorization, only altitudinal gradients are taken into consideration. Gimbi district only has lowland and midland altitudinal gradients because it is located between 1200 and 2222 meters above sea level.
2.1.1. Sampling techniques
First, we identified classifications of coffee landscapes based on the farmer’s perceptions and experts. They classified the landscapes into three altitudinal gradients namely lower land (1451–1650 m asl.), mid-land (1651–1850 m asl.) and upper land (1851–2050 m asl.). Then, we adopted this classification scheme for our study. We identified three altitudinal gradients of coffee-based agroforestry systems, with an area of 3.2 ha, for each gradient. Across the three-altitudinal gradients, an area of 9.6 ha was identified using Google Earth. In each altitudinal classification, a 1 km long transect was established. Generally, six transects were established across the whole altitudinal gradients over six kebeles1 in the district.
2.1.2. Sampling design
Data was collected from February 2020 to May 2020. Tree species diversity and biomass carbon stock assessment were carried out using areas of 40 m × 40 m sample plots, along the altitudinal gradients classification. Square plots were selected as they tend to include more of the within-plot heterogeneity and; thus be more representative than circular plots of the same area. A total of 60 sample plots were used for tree parameter measurements. In each plot, tree species diversity, tree height, and tree diameter at breast height (DBH) were recorded following the transect lines.
The coffee farm chosen for the purpose of the study has been producing for a long time, so the trees on the farm were large in height and diameter. During the inventory, the height of most of the trees was >2 m and their thickness was >5 cm. However, a limited number of trees with a height of <2 m and a diameter of <5 cm observed occasionally. Since the number of trees (h < 2 m and d < 5 cm) was small, they have not been included in the estimation of biomass carbon stocks.
Hence, trees with a height ≥2 m and ≥5 cm in diameter at breast height (DBH) were measured. Trees height and diameter were measured using a vertex, diameter tape, and caliper respectively. Branched trees at 1.3 m were measured at the smallest point below 1.3 m, where the stem assumes a nearly cylindrical shape. A woody plant with multiple stems or forked below 1.3 m height was treated as a single individual. Plant identification was done in the field using their local name and useful trees and shrubs for Ethiopia (Bekele-Tesemma, Citation2007). Nomenclature follows the Flora of Ethiopia and Eritrea (Vol 1–8). To quantify the tree diversity of the coffee-based agroforestry systems, the number and names of tree species (both seedling and sapling) were recorded.
2.2. Data analysis
2.2.1. Tree species diversity
For this study, we have used different diversity indices. The weaver indices of the sampled coffee-based agroforestry systems were calculated by using Shannon diversity (Shannon & Weaver, Citation1963) which is a very widely used index for comparing diversity between various habitats (Okpiliya, Citation2012). The evenness of a population was estimated following the Shannon-Wiener index. Additionally, Simpson’s diversity index was used (Simpson, Citation1949). Simpson’s diversity index is the most sensitive to changes in more abundant species and hence places more weight on the most abundant species in the community. The Simpson’s diversity index is derived from probability theory and it is the probability of picking two organisms at random which are of different species (Magurran, Citation1988).
The Sorensen similarity coefficient was used to estimate the similarity/dissimilarity of species between altitudinal gradients (Sorensen, Citation1948). The Sorensen similarity coefficient was widely deployed as it gives more weight to the species that are common to the samples rather than to those that only occur in either sample (Gotelli & Chao, Citation2013).
The IVI of a species was used to express the relative ecological significance of the species in the forest ecosystem. It was calculated by summing up the relative dominance, relative density, and relative frequency of the species. It indicates the significance of species in the system (Mengistu & Asfaw, Citation2016).
2.2.2. Tree carbon estimation
In this study, the non-destructive allometric equation which is described by Chave et al. (Citation2014) was used to estimate both the aboveground and belowground biomass (ton). This method is applied to the global forest type. It helps calculate the aboveground and belowground biomass contained within each tree that is given as a function of height (m), DBH (cm), and wood density (g/cm−3).
The aboveground biomass of trees and shrubs in the coffee-based agroforestry was calculated using the formula in EquationEq. (1)(1)
(1) .
Where, AGB = above ground biomass
= wood density (g/cm−3)
D = diameter at breast height (1.3m above ground) (cm)
H = tree height (m)
Aboveground live carbon (AGC) was estimated at 50% of AGB, while belowground biomass carbon estimated by multiplying the aboveground biomass by 0.26 as conversion factor (Chave et al., Citation2014; Manickam et al., Citation2014). Wood-specific gravity was obtained at the species level from the Global Wood Density Database (Chave et al., Citation2009). For example, one of the studied trees species (Albizia gummifera) from plot1 in the coffee-based agroforestry system has a height of 28 m and DBH of 65 cm. The wood density of this tree species is 0.580. Therefore, the aboveground biomass of the tree was calculated as follow.
Aboveground biomass (AGB) of this Albizia gummifera (Fabaceae) was 0.441 t. From (Pearson & Brown, Citation2005), the follow equation is used to determine the amount of carbon stock of the tree:
Therefore, the carbon stock estimation of this tree was 0.221 t.
Where, T = ton
C = Carbon
AGB = Aboveground biomass
In order to estimate the total carbon sequestered in the agroforestry system, it was necessary to calculate the belowground biomass carbon stock. Therefore, the belowground biomass carbon (BGBC), was calculated by multiplying AGB taking 0.26 as the root-to-shoot ratio used by Sudha et al. (Citation2007). And subsequently, the carbon stock of belowground biomass was calculated by using the equation developed by Manickam et al. (Citation2014).
Furthermore, the formula developed by several scholars is what is used to transform biomass into carbon stock. According to the premise that living biomass (tissues) contains 47% carbon, the carbon stock for both trees and shrubs/bushes was calculated to be 0.47 times the amount of woody biomass (Chave et al., Citation2005). In other words, the biomass has a carbon content of roughly 47% by dry weight and the carbon stock in the biomass was estimated using the formula in EquationEq. (5)(5)
(5) .
3. Statistical analysis
The data which was collected from the field inventory was organized and recorded in Microsoft excel 2010 datasheet. The altitudinal gradients were the independent variables while density, basal area, species richness, species evenness, and species diversities were considered as dependent variables. Vegetation data were analyzed using univariate analysis. Variables were compared using one-way analysis of variance (ANOVA) following the linear model (GLM) procedure at P < 0.05 with the help of the R software for Window versions 3.6.1 with statistical significance difference were observed (P < 0.05), Tukey’s HSD test were used to separate the means. To investigate the effect of tree diversity on carbon stock across altitudinal gradients, repeated analyses of Variance was performed and the relationship between tree diversity and tree and coffee shrubs biomass were analyzed.
4. Results
4.1. Floristic composition
A total of 36 tree species were recorded from coffee-based agroforestry systems (CBAS). Out of this, 27 species were recorded from the 1451–1650 m altitudinal range and 29 were from the 1651–1850 m altitude, while 17 species were from the 1851–2050 m altitude, respectively (Table ). The entire recorded species were belonging to 34 genus and 23 families (Table ). Fabaceae are represented by 7 species (19.44%) followed by Boraginaceae, Combretaceae, Euphorbiaceae, Loganiaceae, Moraceae, Myrsinaceae, Rubiaceae families collectively representing 38.92% (Figure ). The remaining 15 families altogether accounted for 41.7% of the total species composition each family represented by 1 species (Table ). Overall, 3,231 tree individuals and 36,424 coffee stems were counted (Table ).
Figure 2. Tree species and coffee-shrub biomass carbon in coffee-based agroforestry systems.
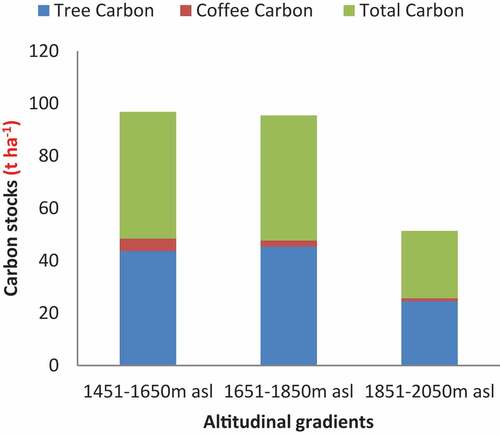
Table 1. Total number of tree families, genera, and species recorded in coffee-based agroforestry
Table 2. Tree diversity indices in coffee-based agroforestry system across altitudinal gradients
Table 3. Tree density and basal area in coffee-based agroforestry systems along different altitudinal gradients
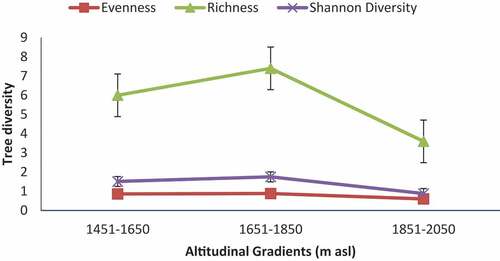
Species richness, Evenness (E), Shannon-Wiener Diversity Index (H’), and Simpson Diversity (1-D) were significantly different along an altitudinal gradient (Table ). The mean species richness, which measures the number of species present per plot, ranged from 3.60 to 7.40. The highest species richness (S =7.40) was measured in the 1651–1850 m altitudinal gradients while the lowest (S = 3.60) was recorded in the 1851–2050 m altitudinal gradient. Shannon evenness index was also highest (J = 0.88) at the 1651–1850 m altitudinal gradient and lowest (E = 0.60) at 1851–2050 m altitudinal gradient (Table ). The highest Shannon–Wiener diversity index (H’) was recorded from 1651 to 1850 m altitudinal gradient while the lowest was recorded in 1851–2050 m altitudinal gradient (Table ). The highest and lowest Simpson’s diversity index for each study site is similar to that of Shannon–Wiener diversity index (H’) across the altitudinal gradients.
Species dominance varies across the three-altitudinal gradients. In the 1451–1650 m altitudinal range, Albizia gummifera (49.95), Terminalia laxiflora (35.54), Combretum molle (27.99), Croton macrostachyus (26.83), Maesa lanceolata (20.97) and Ficus vasta (11.59) were the six most dominant species. In the 1651–1850 m altitude, Albizia gummifera (52.27), Terminalia laxiflora (38.73), Croton macrostachyus (25.6), Combretum molle (22.21), Maesa lanceolata (14.91), and Vernonia amygdalina (12.37) were recorded as a top dominant species. Whereas, the 1851–2050 m altitude was uniquely dominated by Sapium ellipticum (48.15), Croton macrostachyus (36.94), Celtis africana (30.05), Premna schimperi (28.25), Strychnos spinosa (27.17), and Oncoba spinosa (24) species. Of all species, Albizia gummifera was the top ranking in 1451–1650 m and 1651–1850 m altitudes while Sapium ellipticum was found to be the top ranking in 1851–2050 m altitude.
The mean density of the entire tree species recorded along altitudinal gradients in the coffee-based agroforestry systems was 13 individuals per 1600 m2. Tree species density showed a significant difference (F = 5.144; P < 0.05) along altitudinal gradient. It was significantly highest (17 individuals per sample plot) in the 1451–1650 m altitude and lowest in 1851–2050 m altitudes (10 individuals per sample plot). In the 1451–1650 m altitude, the dense species were Albizia gummifera (8 individuals per sample plot), Croton macrostachyus (8 individuals per sample plot), Terminalia laxiflora (7 individuals per sample plot), and Combretum molle (6 individuals per sample plot). The abundance of these four tree species alone covers 40.45% of the total population of tree species in the 1451–1650 m altitudinal range. Albizia gummifera (10 individuals per sample plot), Croton macrostachyus (9 individuals per sample plot), Terminalia laxiflora (8 individuals per sample plot), and Combretum molle (5 individuals per sample plot) were the most abundant in the 1651–1850 m altitude. Unlike the former two altitudinal gradients, Strychnos spinosa (seven individuals per sample plot), Sapium ellipticum (seven individuals per sample plot), Croton macrostachyus (six individuals per sample plot), Oncoba spinosa (six individuals per sample plot), and Premna schimperi (five individuals per sample plot) were the most abundant in the 1851–2050 m altitudinal range; and account for 60% of the total density.
Likewise tree species density, the basal area has also shown a significant difference (F = 5.349, P < 0.05) along the altitudinal gradient. Lower altitude showed a higher mean basal area (3.67 m2 per sample plot) of tree species and the lowest mean basal area was found at 1851–2050 m altitude (1.82 m2 per sample plot; Table ).
4.2. Carbon stock
The pattern of aboveground and belowground carbon stocks distribution varies across altitudinal gradients. The differences in tree carbon stock, both aboveground and belowground, showed a slight increase from 1451–1650 m altitude to 1651–1850 m while it was decreasing from 1651–1850 m to higher 1851–2050 m altitude in the coffee-based agroforestry system (Table ).
Table 4. Mean (± standard error; n = 20) aboveground and belowground biomass (t ha−1) for each of the three altitudinal gradients and results of one-way ANOVA (at α = 0.05, significant differences between the altitudinal gradient of the biomass carbon stocks)
The pattern of aboveground and belowground biomass carbon stock in coffee shrub across altitudinal gradients was significantly different along the altitudinal gradients. It was monotonically decreasing as altitude increased. The maximum aboveground and belowground biomass carbon recorded in coffee shrubs were 4.73 t ha−1 and the minimum was 1.11 t ha−1 respectively (Table ).
The highest BGC for tree species was recorded in the 1651–1850 m altitudinal class (t ha−1) followed by 1451–1650 m altitudinal range (9.01 t ha−1). Similarly, the variation of carbon stock in coffee shrubs along the altitudinal gradient was statistically significant (F = 6.0408, P < 0.001). Overall, the highest carbon stock was observed in the 1451–1650 m altitudinal range while the lowest was found in the 1851–2050 m altitudinal scale (Figure ).
4.3. Total carbon stocks and tree diversity relationships
The carbon stock in the study area was influenced by the variation in tree species diversity, abundance, and dominance of trees across the altitudinal gradients in the coffee-based agroforestry system (Table ; Figure ). The largest carbon stock was contributed by the tree species, which accounted for 93.3% % of the system for the three altitudinal gradients while the remaining was contributed by coffee shrubs (Table ). The mean tree carbon stock was calculated to be 38.68 t ha−1, and the average coffee shrub carbon stock was estimated to be 2.73 t ha−1. The overall mean carbon stock stored in the system was estimated to be 41.4 t ha−1 (Table ).
Figure 3. Tree diversity indices across altitudinal gradient.
5. Discussion
5.1. Floristic composition
Floristic composition and variety were found to be highest in the 1651–1850 m height, followed by the 1451–1650 m altitude, and lower in the 1851–2050 m altitude. Desalegn and Beierkuhnlein (Citation2010) found a similar trend of species richness and pattern. They discovered that woody species richness follows a trend that begins with an increase and peaks about 2000 m, then begins to fall and level off at elevations over 2500 m. In addition, Gebrewahid and Abrehe (Citation2019) stated that species richness had a hump-shaped distribution, with the highest species richness in the intermediate elevation and the lowest species richness at the upper elevation. Altitudes and slopes, according to Eilu and Obua (Citation2005), influence tree species richness and dispersion behavior. As reported by Sharma et al. (Citation2017), tree species richness was found to be highest at a lower altitude, followed by middle altitude, and lowest at a higher altitude. They also reported that tree species richness (including genera and family richness) shows a similar pattern, reaching a maximum at intermediate elevations in the subtropical Andes of Argentina.
Several studies have shown that species richness patterns can show a monotonic reduction (Gebrehiwot et al., Citation2019; Sharma et al., Citation2017). Ali and Yan (Citation2017) and Gebrehiwot et al. (Citation2019) have found a monotonic increase along altitudinal gradient. In contrast, some researchers have discovered that species richness is lowest at mid-elevations, resulting in an inverted hump-shape (Nanda et al., Citation2018), while others have discovered no apparent association between species richness and elevation. According to Toledo-Garibaldi and Williams-Linera (Citation2014), species, genus, and family richness decreased in a unimodal fashion along the entire elevation gradient, while diversity decreased monotonically.
Several researchers conclude that there is no general pattern along elevation gradients; however, particular patterns, such as the unimodal hump-shaped and monotonic reduction, do exist. Due to a multitude of rules driving the general ecology of forest ecosystems (Lawton, Citation1999) and the existence of a wide variety of strategies and ways developed by species to adapt to environmental stresses (Grime, Citation1977). However, there is no general conclusion on the correlation between species distribution and altitude, the fact that tree species show variation along altitudinal gradients. Pausas and Austin (Citation2001) affirmed that the distribution of species richness over any wide area is likely to be influenced by two or more environmental factors.
In the 1851–2050 m altitudinal range, Shannon–index Weiner’s values ranged from 0.88 to 1.75 and dropped. Our findings are consistent with those found in other temperate woods (Sharma et al., Citation2009). Similarly, the important value indexes differed throughout elevation gradients, and different tree species predominated at various altitudes. In this study, Albizia gummifera was the major tree species in the coffee-based agroforestry systems at altitudes of 1451–1650 m and 1651–1850 m, respectively, whereas Croton macrostachyus was the dominating tree species at elevations of 1851–2050 m. According to Curtis and Mcintosh (Citation1950), the highest important value index obtained for a given woody species indicates that it is the dominating species among other plant species in the same area.
According to Nemera et al. (Citation2018), a species’ ecological dominance may be linked to pathogen resistance or competition, adaptability to growth in the shade, least preferred by browsing animals, pollinator attraction, and diversity of seed predators that facilitated seed dispersal within the existing environmental conditions. Environmental factors and selective human use of the available species, on the other hand, may be due to the woody species with the least important value.
Tree dominance varies with variation in the coffee-based agroforestry systems across elevation. Simpson’s index value was 0.14 in the 1451–1650 m and 1651–1850 m gradients, which gradually increased and reached finally up to 0.41 for the tree species in the 1851–2050 m gradients. This was due to the tolerance-based dominance of only a few tree species under severe environmental conditions. The high importance value index (IVI) of species between 1651 and 1850 m altitudes indicated their dominance and ecological success, good power of regeneration, and ecological amplitude. Similar observations were also recorded by Sharma et al. (Citation2017) and Gebrewahid et al. (Citation2019).
5.2. Tree diversity and carbon stocks along altitudinal gradients
The mean above and below ground biomass carbon stocks of both trees and coffee shrubs decreased with increasing altitude, which could be attributable to the absence of large trees with maximum DBH, a decrease in tree species diversity, and a decrease in the number of coffee shrubs in the upper altitude. Because tree species richness decreased as altitude increased from 1851 to 2050, relatively small trees (low DBH) with low diversity became dominant. This could be the result of anthropogenic influences in the study area. The farmers did raise animals and grow other crops, but they mostly grew coffee. The population density fluctuated along the altitudinal gradients’ ranges as well. For instance, the population of the upper land increased along with the number of cattle and crops produced which displaced coffee production and transformed the land into open agriculture, according to agricultural office report.
On the other hand, in the lower altitudes, farmers cut trees for charcoal making and wood selling. Furthermore, as altitude increased, the weather variables of the area varied with a pattern of decreasing at the upper altitude. Because of these factors, lower and higher tree diversity were observed at lower and upper altitudes, respectively. The study’s findings were similar to those of Esubalew et al. (Citation2019) and Tesfaye and Seifu (Citation2016). According to them, the variations in the parameters could be due to a variety of factors that change with altitude. The elements that caused the variation could have been soil humidity or temperature, as well as a study site’s dissimilarity.
Similar research has found that a number of factors influence the variability of tree variety, which affects both above and belowground carbon reserves in a forest ecosystem. Because of good species diversity, environmental conditions, and soil characteristics in the mid-altitudinal gradient, Eshetu and Hailu (Citation2020) reported that the pattern of total carbon stock in their study had a humped shape with altitudinal gradient and formed a peak carbon stock at the mid-altitude. Yohannes et al. (Citation2015) discovered a declining trend in soil organic carbon stock as elevation increased, which they attribute to canopy cover, litter biomass accumulation, and species diversity. Another reason, as Gedefaw et al. (Citation2014) point out, is that climatic conditions can influence forest carbon stock along an elevation gradient. Farm size, management, socioeconomic needs, species diversity, tree age, local climate, and tree spacing among agroforestry systems could all have a role in carbon stock variation (Kumar, Citation2011). A continual removal of falling litter, deadwood, and twigs, as well as unlawful cutting for charcoal production, construction, agriculture, and livestock grazing, were also discovered to have an impact on the forest carbon stock balance (Gedefaw et al., Citation2014). The highest amount of carbon was stored in coffee shrubs at 1451–1650 m, followed by 1651–1850 m, and the lowest at 1851–2050 m. That might be because the upper land forest, which located in the 1851–2050 m altitudinal gradient, is dominated by natural forest, while the 1651–1850 m altitude is mixed, and the 1451–1650 m altitude is dominated by planting because of farmers’ shade tree preference intervention.
This research provides valuable information on tree diversity, coffee shrub density, biomass, and carbon stock in coffee-based agroforestry ecosystems over an altitudinal gradient in the study area. The impact of human intervention on tree species variety and coffee shrub density throughout an altitudinal gradient is also highlighted in our research. In comparison to the 1451–1650 m and 1651–1850 m systems, the agroforestry system in the 1851–2050 m altitudinal range is frequently subjected to more intense human disturbance and has a lower density of huge trees, according to local experts. The agroforestry systems in the altitudinal ranges of 1451–1650 m and 1651–1850 m sustained more large trees due to long-term management of larger trees by coffee producers. The 1851–2050 m altitude, which mainly comprises natural forest, was found to contribute low accumulations of carbon stocks as compared to the 1451–1650 m and 1651–1850 m altitudes. The more coffee shrubs, large tree diversity, and high carbon storage potential of 1451–1650 m and 1651–1850 m altitudes show that the two sites are more productive and have more sustainable ecosystems compared to the 1851–2050 m altitude, which has lower coffee shrubs density and small size and less diversity tree with less carbon stock potential.
Thus, comparing these species diversity and carbon storages phenomena, coffee-based agroforestry systems can be seen as an agroecosystem function that is directly interrelated to biodiversity conservation and carbon storage. However, the effect of species diversity on biomass carbon storage depends on management practices, species, and site factors.
6. Conclusions
This study highlights coffee-based agroforestry systems are important for conserving Ethiopian tree species that are either indigenous or highly endangered. In comparison, the system has a high proportion of native woody species equal to some unmanaged natural forests. Farmers typically establish or keep nearly multipurpose indigenous trees in the coffee-based agroforestry system. Our finding revealed that the system considerably improves native tree conservation.
Compared to the coffee shrubs, shade trees significantly stored large carbon stocks across the altitudinal gradients. Higher carbon stock and large trees with diverse species recorded in the lower and mid-altitudinal gradients indicate that plant density and diversity can actively influence total carbon stock in agroforestry systems than elevation gradients. This shows that the system is vital for carbon sequestration and help in alleviating climate change issues.
The system contributes to the augmentation of productivity of the area by providing food and assisting the community’s livelihoods, protecting soil and watersheds. Hence, coffee-based agroforestry systems were found to be vital for biodiversity conservation, carbon sequestration, and ecosystem services that can lead to sustainable ecosystem management.
Declarations
Beshea Abdissa Chemeda: Conceived and designed the research survey; Performed the data collection; Analyzed and interpreted the data; Contributed materials, analysis tools, or data; Wrote the paper.
Feyera Senbeta Wakjira: Conceived and designed the research survey, Supervised, edited the paper.
Emiru Birhane Hizikias: Supervised, edited the paper.
Additional information
No additional information is available for this paper
Acknowledgements
The authors are thankful to the Center for Environment and Development of Addis Ababa University for providing research funds for Ph.D. students under MoE-Ethiopia. We also thank the CLIFF-GRADS to support “Improving productivity and adaptive capacity of Coffee-based agroforestry systems for enhancing food security in a changing climate in Ethiopia”. Our sincere thanks also go to all workers of Agriculture and Natural Resources, EFCCA, OFWE, and Coffee and Tea offices of Gimbi Zonal and District for their participation in data collection during surveying and interview processes.
Disclosure statement
No potential conflict of interest was reported by the author(s).
Additional information
Funding
References
- Abera, Z., Degefu, H., Gari, G., Kidane, M., Zelalem, A., Degefu, H., Gari, G., & Kidane, M. (2015). Sero-prevalence of lumpy skin disease in selected districts of West Wollega zone. BMC Veterinary Research, 11(1), 1–20. https://doi.org/10.1186/s12917-015-0432-7
- Ali, A., & Yan, E. (2017). Relationships between biodiversity and carbon stocks in forest ecosystems : A systematic literature review. Tropical Ecology, 58(1), 1–14. Accessed 10 Sep 2022. https://moam.info/relationships-between-biodiversity-and-carbon-stocks-in-forest-_5bb093cb097c4754428b4575.html.
- Bekele-Tesemma, A. (2007). Useful trees and shrubs of Ethiopia : Identification, Propagation and Management for 17 Agroclimatic Zones. RELMA in ICRAF Project,(1), 552. 92 9059 212 5. https://apps.worldagroforestry.org/usefultrees/frontpages/Useful_Trees_Ethiopia.pdf.
- Buechley, E. R., Şekercioğlu, Ç. H., Atickem, A., Gebremichael, G., Ndungu, J. K., Mahamued, B. A., Beyene, T., Mekonnen, T., & Lens, L. (2015). Importance of Ethiopian shade coffee farms for forest bird conservation. Biological Conservation, 188(1), 50–60. https://doi.org/10.1016/j.biocon.2015.01.011
- Chave, J., Andalo, C., Brown, S., Cairns, M. A., Chambers, J. Q., Eamus, D., Folster, H., Fromard, F., Higuchi, N., Kira, T., Lescure, J. P., Nelson, B. W., Ogawa, H., Puig, H., Riera, B., & Yamakura, T. (2005). Tree allometry and improved estimation of carbon stocks and balance in tropical forests. Oecologia, 145(1), 87–99. https://doi.org/10.1007/s00442-005-0100-x
- Chave, J., Coomes, D., Jansen, S., Lewis, S. L., Swenson, N. G., & Zanne, A. E. (2009). Towards a worldwide wood economics spectrum. Ecology Letters, 12(4), 351–366. https://doi.org/10.1111/j.1461-0248.2009.01285.x
- Chave, J., Savanna, M., Delitti, W. B. C., Réjou-Méchain, M., Búrquez, A., Chidumayo, E., Colgan, M. S., Duque, A., Eid, T., Fearnside, P. M., Goodman, R. C., Henry, M., Martínez-Yrízar, A., Mugasha, W. A., Muller-Landau, H. C., Mencuccini, M., & Vieilledent, G. (2014). Improved allometric models to estimate the aboveground biomass of tropical trees. Global Change Biology, 20(10), 3177–3190. https://doi.org/10.1111/gcb.12629
- Curtis, J. T., & Mcintosh, R. P. (1950). The Interrelations of Certain Analytic and Synthetic Phytosociological Characters. R.P.Ecology, 3(31), 434–455. https://about.jstor.org/terms%0D
- Desalegn, W., & Beierkuhnlein, C. (2010). Plant species and growth form richness along altitudinal gradients in the southwest Ethiopian highlands. Journal of Vegetation Science, 21(March), 617–626. https://doi.org/10.1111/j.1654-1103.2010.01177.x
- Eilu, G., & Obua, J. (2005). Tree condition and natural regeneration in disturbed sites of Bwindi Impenetrable Forest National Park, southwestern Uganda. Tropical Ecology, 46(1), 99–111.
- Eshetu, E. Y., & Hailu, T. A. (2020). Carbon sequestration and elevational gradient: The case of Yegof mountain natural vegetation in North East, Ethiopia, implications for sustainable management. Cogent Food and Agriculture, 6(1), 1733331. https://doi.org/10.1080/23311932.2020.1733331
- Eshetu, R., Muhle, S., & Mulu, S. (2021). Assessment of carbon stock potential of parkland agroforestry practice: The case of Minjar Shenkora; North Shewa, Ethiopia. Environmental Systems Research, 10(1). https://doi.org/10.1186/s40068-020-00211-3
- Esubalew, E., Giday, K., Hishe, H., & Goshu, G. (2019). Carbon stock of woody species along Altitude gradient in. International Journal of Environmental & Agriculture Research (IJOEAR), 5(7), 13–21.
- Gebrehiwot, K., Demissew, S., Woldu, Z., Fekadu, M., Desalegn, T., & Teferi, E. (2019). Elevational changes in vascular plants richness, diversity, and distribution pattern in Abune Yosef mountain range, Northern Ethiopia. Plant Diversity, 41(4), 220–228. https://doi.org/10.1016/j.pld.2019.06.005
- Gebrewahid, Y., & Abrehe, S. (2019). Biodiversity conservation through indigenous agricultural practices: Woody species composition, density and diversity along an altitudinal gradient of Northern Ethiopia. Cogent Food & Agriculture, 5(1), 1700744. https://doi.org/10.1080/23311932.2019.1700744
- Gebrewahid, Y., Teka, K., Gebre-Egziabhier, T. B., Tewolde-Berhan, S., Birhane, E., Eyasu, G., & Meresa, E. (2019). Dispersed trees on smallholder farms enhance soil fertility in semi-arid Ethiopia. Ecological Processes, 8(38). https://doi.org/10.1186/s13717-019-0190-8
- Gedefaw, M., Soromessa, T., & Belliethathan, S. (2014). Forest Carbon Stocks in Woody Plants of Tara Gedam Forest: Implication for Climate Change Mitigation. STAR Journal, 3(1), 101–107. https://doi.org/10.4314/star.v3i1.16
- Gizachew, L., & Shimelis, A. (2014). Analysis and mapping of climate change risk and vulnerability in central rift valley of Ethiopia. African Crop Science Journal, 22(Vi), 807–818.
- Gotelli, N. J., & Chao, A. (2013). Measuring and estimating species richness, species diversity, and biotic similarity from sampling data. Encyclopedia of Biodiversity,Second Edition, 5(1), 195–211. https://doi.org/10.1016/B978-0-12-384719-5.00424-X
- Grime, J. P. (1977). Evidence for the existence of three primary strategies in plants and its relevance to ecological and evolutionary theory. American Society of Naturalists, 111(982), 1169–1194. https://doi.org/10.1086/283244
- Hylander, K., Nemomissa, S., Delrue, J., & Enkosa, W. (2013). Effects of coffee management on deforestation rates and forest integrity _ enhanced reader. Conservation Biology, 27(5), 1031–1040. https://doi.org/10.1111/cobi.12079
- Jamnadass, R., Place, F., Torquebiau, E., Malézieux, E., Iiyama, M., Sileshi, G. W., Kehlenbeck, K., Masters, E., McMullin, S., & Dawson, I. K. (2013). Agroforestry, food and nutritional security. ICRAF Working Paper No. 170. Nairobi, World Agroforestry Centre. https://doi.org/10.5716/wp054.pdf.
- Kumar, B. M. (2011). Species richness and aboveground carbon stocks in the homegardens of central Kerala, India. Agriculture, Ecosystems & Environment, 140(3–4), 430–440. https://doi.org/10.1016/j.agee.2011.01.006
- Kurnar, A., Marcot, B. G., Saxena, A., Kumar, A., Marcot, B. G., & Saxena, A. (2006). Tree species diversity and distribution patterns in tropical forests of Garo Hills. Current Science, 91(10), 1370–1381.
- Lawton, J. H. (1999). Are there general rules in ecology? Oikos, 84(2), 177–192. https://doi.org/10.2307/3546712
- Lin, C. (2020). Understanding cultural diversity and diverse identities. Current Science, (1)929–938. https://doi.org/10.1007/978-3-319-95870-5_37
- Magurran, A. E. (1988). Ecological diversity and its measurement. Princeton University Press.
- Manaye, A., Tesfamariam, B., Tesfaye, M., Worku, A., & Gufi, Y. (2021). Tree diversity and carbon stocks in agroforestry systems in northern Ethiopia. Carbon Balance and Management, 16(14), 1–10. https://doi.org/10.1186/s13021-021-00174-7
- Manickam, V., Krishna, I. V. M., Shanti, S. K., & Radhika, R. (2014). Biomass Calculations for Carbon Sequestration in Forest Ecosystem. Journal of Energy and Chemical Engineering, 2(1), 30–38.
- Mekonnen, K., & Gebreyesus, B. (2011). Impact assessment of soil and water conservation measures at medego watershed in Tigray, northern Ethiopia. Maejo International Journal of Science and Technology, 5(3), 312–330.
- Mengistu, B., & Asfaw, Z. (2016). Woody species diversity and structure of agroforestry and adjacent land uses in Dallo Mena District, South-East Ethiopia. Natural Resources, 7(10), 515–534. https://doi.org/10.4236/nr.2016.710044
- Mkonda, M., & He, X. (2017). the potentials of agroforestry systems in east Africa: a case of the eastern arc mountains of Tanzania. International Journal of Plant & Soil Science, 14(3), 1–11. https://doi.org/10.9734/IJPSS/2017/31299
- Mulatu, K., & Hunde, D. (2020). Agroforestry: A supplementary method for biodiversity conservation and climate change mitigation and adaptation. International Journal of Ecotoxicology and Ecobiology, 5(3), 29–35. https://doi.org/10.11648/j.ijee.20200503.11
- Nair, R. (1993). An Introduction to Agroforestry. In cooperation with International Centre for Research in Agroforestry (ICRAF). Kluwer Academic Publishers, Dorecht/ Boston/ London. .
- Nair, R. P. (1993). An Introduction to Agroforestry. Kluwer Academic Publishers: In Cooperation with International Centre for Research in Agroforestry, Dordrecht/Boston/London.
- Nanda, S. A., Reshi, Z. A., Manzoor-Ul-Haq, L., A, B., & Mir, S. A. (2018). Taxonomic and functional plant diversity patterns along an elevational gradient through treeline ecotone in Kashmir. 59(2), 211–224.
- Nemera, F., Zewdu, T., & Ebro, A. (2018). The effect of altitude gradients in the species diversity of woody plants of the natural grazing lands of west shoa. 8(11), 1–6.
- Okpiliya, F. I. (2012). Ecological Diversity Indices : Any Hope for One Again ? Journal of Environment and Earth Science, 2(10), 2224–3216.
- Olsson, L., Barbosa, H., Bhadwal, S., Cowie, A., Delusca, K., Flores-Renteria, D., Hermans, K., Jobbagy, E., Kurz, W., L, D., Sonwa, D. J., & Stringer, L. (2019). Land Degradation. Climate Change and Land. an IPCC special report on climate change, desertification, land degradation, sustainable land management, food security, and greenhouse gas fluxes in terrestrial ecosystems.
- Pausas, J. G., & Austin, M. P. (2001). Patterns of plant species richness in relation to different environments : An appraisal. Journal of Vegetation Science, 12(2), 153–166. https://doi.org/10.2307/3236601
- Pearson, T., & Brown, S. (2005). Guide de Mesure et de Suivi du Carbone dans les Forêts et Prairies Herbeuses. Winrock International, 1–39.
- Reppin, S., Kuyah, S., de Neergaard, A., Oelofse, M., & Rosenstock, T. S. (2020). Contribution of agroforestry to climate change mitigation and livelihoods in Western Kenya. Agroforestry Systems, 94(1), 203–220. https://doi.org/10.1007/s10457-019-00383-7
- Santos, M., Cajaiba, R. L., Bastos, R., Gonzalez, D., Petrescu Bakış, A. L., Ferreira, D., Leote, P., Barreto da Silva, W., Cabral, J. A., Gonçalves, B., & Mosquera-Losada, M. R. (2022). Why do agroforestry systems enhance biodiversity? evidence from habitat amount hypothesis predictions. Frontiers in Ecology and Evolution, 9(January), 1–11. https://doi.org/10.3389/fevo.2021.630151
- Shannon, C. E., & Weaver, W. W. (1963). The mathematical theory of communications. University of Illinois Press, Urbana.
- Sharma, C. M., Mishra, A. K., Tiwari, O. P., Krishan, R., & Rana, Y. S. (2017). Effect of altitudinal gradients on forest structure and composition on ridge tops in Garhwal Himalaya. Energy, Ecology and Environment, 2(6), 404–417. https://doi.org/10.1007/s40974-017-0067-6
- Sharma, C. M., Suyal, S., Gairola, S., & Ghildiyal, S. K. (2009). Species richness and diversity along an altitudinal gradient in moist temperate forest of Garhwal Himalaya. Journal of American Science, 5(5), 119–128. https://www.researchgate.net/publication/228591101 Species.
- Simpson, E. (1949). Measurement of Diversity. Nature, 163(1943), 688. https://doi.org/10.1038/163688a0
- Sistla, S. A., Roddy, A. B., Williams, N. E., Kramer, D. B., Stevens, K., & Allison, S. D. (2016). Agroforestry practices promote biodiversity and natural resource diversity in Atlantic Nicaragua. PLoS ONE, 11(9). https://doi.org/10.1371/journal.pone.0162529
- Sorensen, T. (1948). A method of establishing groups of equal amplitude in plant sociology based on similarity of species content. PLoS ONE, 5(9).
- Sudha, P., Ramprasad, V., Nagendra, M. D. V., Kulkarni, H. D., & Ravindranath, N. H. (2007). Development Of An Agroforestry Sequestration Project In Khammam District Of India. 35–43. https://escholarship.org/uc/item/4qw168vk
- Tadesse, T., Hassan, R. M., Ringler, C., Alemu, T., & Yusuf, M. (2009). Determinants of farmers ’ choice of adaptation methods to climate change in the Nile Basin of Ethiopia. Global Environmental Change. https://doi.org/10.1016/j.gloenvcha.2009.01.002
- Tadesse, G., Zavaleta, E., & Shennan, C. (2014). Coffee landscapes as refugia for native woody biodiversity as forest loss continues in southwest Ethiopia. Biological Conservation, 169(1), 384–391. https://doi.org/10.1016/j.biocon.2013.11.034
- Tesfaye, W., & Seifu, L. (2016). Climate change perception and choice of adaptation strategies: Empirical evidence from smallholder farmers in east Ethiopia. International Journal of Climate Change Strategies and Management, 8(2), 253–270. https://doi.org/10.1108/IJCCSM-01-2014-0017
- Tesfay, F., Moges, Y., & Asfaw, Z. (2022). Woody species composition, structure, and carbon stock of coffee-based agroforestry system along an elevation gradient in the moist mid-highlands of Southern Ethiopia. International Journal of Forestry Research, 2022(1), 1–12. https://doi.org/10.1155/2022/4729336
- Toledo-Garibaldi, M., & Williams-Linera, G. (2014). Tree diversity patterns in successive vegetation types along an elevation gradient in the Mountains of Eastern Mexico. Ecological Research, 29(6), 1097–1104. February 2016 https://doi.org/10.1007/s11284-014-1196-4
- Tscharntke, T., Clough, Y., Bhagwat, S. A., Buchori, D., Faust, H., Hertel, D., Ho, D., Juhrbandt, J., Kessler, M., Perfecto, I., & Scherber, C. (2011). Multifunctional shade-tree management in tropical agroforestry landscapes – A review. Journal of Applied Ecology, 48(3), 619–629. https://doi.org/10.1111/j.1365-2664.2010.01939.x
- Tschora, H., & Cherubini, F. (2020). Co-benefits and trade-offs of agroforestry for climate change mitigation and other sustainability goals in West Africa. Global Ecology and Conservation. 6(1), 22. https://doi.org/10.1016/j.gecco.2020.e00919
- Yohannes, H., Soromessa, T., & Argaw, M. (2015). Carbon Stock Analysis Along Altitudinal Gradient in Gedo Forest: Implications for Forest Management and Climate Change Mitigation. American Journal of Environmental Protection, 4(5), 237. https://doi.org/10.11648/j.ajep.20150405.14
- Zewdie, B., Tack, A. J. M., Ayalew, B., Wondafrash, M., Nemomissa, S., & Hylander, K. (2022). Plant biodiversity declines with increasing coffee yield in Ethiopia’s coffee agroforests. Journal of Applied Ecology, 59(5), 1198–1208. https://doi.org/10.1111/1365-2664.14130
Appendix
Table A1. Plant species recorded from coffee-based agroforestry system of the study area, Gimbi District, western Ethiopia
Table A2. Value for the different phytosociological parameters measured for different tree species of Coffee-based Agroforestry System in 1451–1650 m asl. altitudinal range
Table A3. Value for the different phytosociological parameters measured for different tree species of Coffee-Based Agroforestry System in 1651–1850 m asl. altitudinal range
Table A4. Value for the different phytosociological parameters measured for different tree species of Coffee-Based Agroforestry System in 1851–2050 m asl. altitudinal range