
 ?Mathematical formulae have been encoded as MathML and are displayed in this HTML version using MathJax in order to improve their display. Uncheck the box to turn MathJax off. This feature requires Javascript. Click on a formula to zoom.
Abstract
Anthropogenic plot-level disturbances may influence insect communities in an ecosystem. Documenting these small-scale disturbances through remote sensing in forested habitats of the developing world can be expensive. Disturbance indices can also be computed using visible signs of disturbance documented through ground-level surveys. In this study, we use a previously reported disturbance index to document the level of anthropogenic disturbances in two forested habitats in West Bengal, India, in the context of exploring plot-level habitat disturbances likely to influence the resident bee (Hymenoptera: Apoidae) fauna of the study sites. We introduce modifications to the established index by using rank-order weights of each identified criterion, instead of perceived weights. Using rank-order weights of criteria is considered suitable for removing evaluator bias when working with human-assigned weights. It is also thought that it is easier for expert as well as non-expert decision makers to arrive at a consensus when evaluating the ranks of criteria, instead of weights. This approach may be considered for calculating other ecological indices that involve multiple criteria with human-assigned weights. In addition, we report the results of our investigation into the relation between bee abundance and disturbance at each study site based on monthly surveys.
Anthropogenic disturbances are important contributors to habitat complexity. Disturbance results in habitat heterogeneity, which, in turn, opens up new niches (Bird, Citation2015) and makes previously unavailable resources open for exploitation, which could increase insect diversity. Conversely, large-scale disturbances may be detrimental to resident insect diversity. Thus, quantifying the disturbance of heterogenous habitats may help us understand the community structure of the resident entomofauna of specific habitats. Over the years, several methods have been proposed for estimating disturbance in tropical and subtropical forest habitats, ranging from visual surveys to remote sensing applications (Lopes & Ferrari, Citation2000; Rocchini et al., Citation2010; Tuanmu & Jetz, Citation2015; Zurlini et al., Citation2006). Dewan and Vacik (Citation2010) proposed an index to determine human-induced disturbance in the forested tracts of Chittagong Hills in Bangladesh. Their method involves a simple quantification of habitat disturbance using visual signs of disturbance. For computing this index, a qualitative assessment of the intensity of different human activities in the study area is made.
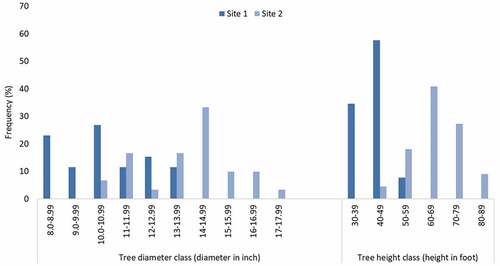
We used this index to determine the level of habitat disturbance caused by anthropogenic activities at the plot level in two forested sites in southern West Bengal, India, which we hypothesized to have an effect on the resident insect species, particularly the bee fauna of the study sites. There have been several habitat disturbance studies focussed on bees (Biesmeijer et al., Citation2006; Chiawo et al., Citation2017; Eltz et al., Citation2002; Gikungu, Citation2006; Grixti & Packer, Citation2006; Kearns et al., Citation1998; Kevan, Citation1991; Kevan & Viana, Citation2003), but none centred around the open-canopied forested habitats of southern West Bengal. We documented wild bees at two sites in the district of West Midnapore (Paschim Medinipur) as part of a bigger field-based study between October 2013 and September 2015, and noted signs of disturbance at the plot level during monthly bee sampling surveys. For the purpose of this study, we used bee species abundance data and the documented frequencies of anthropogenic disturbances from that study. The first study site is a protected forest (22°28′01.2″N 87°09′28.0″E), originally one of the many pockets of natural forests in this range, where the dominant tree is Sal (Shorea robusta). This forest is maintained by the state forest department and periodically coppiced by it, but limited human usage is permitted here as part of Joint Forest Management. The second site is an eco-restored wetland site (22°25′58.9″N 87°13′00.5″E) that until recently used to be a tourist spot. This site has seen afforestation and soil conservation activities undertaken intermittently since 1983 till 2009 and Sal is the dominant tree here as well. The two sites varied significantly in several stand characteristics analysed, including mean stand density (trees per acre: 900 ± 130.76 in site 1 vs. 520 ± 135.27 in site 2; t = 3.49, df = 4, p = 0.02, n = 3) and frequency of trees belonging to different height and diameter classes (Figure ; data expressed as mean ± SD for three plots of radius 6.5 m each within the bee sampling area). The greater stand density of site 1 points to the forested nature of this site, while the lower stand density of site 2 suggests a more open landscape pattern. Sørensen-Dice index of similarity computed for the two sites to determine the degree of similarity between them in terms of terrestrial floral (flowering herbs and shrubs within the sampling area) assemblage showed an 82.6% similarity (Supplementary data; Table S1).
Figure 1. Frequency of trees in different diameter and height classes at two sites.
We introduced slight modifications to Dewan and Vacik’s index. Instead of using perceived weights, we used rank-ordered weights of each disturbance activity in the index. The use of ordinal rank of an activity to derive its approximate weight was based on the assumption that there is a universal weight–rank functional relationship between criteria ranks and average weight values. Roszkowska (Citation2013) argues that using ranks to determine the weights of criteria rather than directly assigning weights to criteria is more reliable as ranks are easier to comprehend. It is also suggested that using criteria ranks, instead of perceived weights, helps experts and non-experts arrive at a consensus during decision-making (Roszkowska, Citation2013).
Following Dewan and Vacik (Citation2010), the ranks of the disturbance activities were determined through qualitative assessments of their intensity at the two study sites. It has been argued that qualitative assessments by trained and experienced personnel can generate useful information on ecological functions, which can help in identifying areas for monitoring, restoration, and other landscape-level management changes (Lepak et al., Citation2022). Similar ranking of habitat-level disturbance has been previously reported by Mallick and Chakraborty (Citation2018).
We identified six disturbance activities at the plot level that we hypothesized could potentially affect the bees (Apis + non-Apis) of the two sites. A brief description of each activity is provided in Table . Accordingly, ranked weights of these activities were determined using Stillwell et al.’s (Citation1981) rank reciprocal function. Using this conversion, numeric activity weights may be obtained from the reciprocal of ranks, which are normalized by dividing each term by the sum of the reciprocals.
Table 1. Disturbance-causing activities and their calculated weights
where wj is the weight of the jth activity, n is the number of activities, and rj is the rank of the jth activity ( Stillwell et al., Citation1981).
The weights (wj) obtained using Eq. 1 for each activity were then used in Eq. 2 for the computation of the final disturbance index, following a modification of Dewan and Vacik’s formula.
where n is the number of activities, wj is the weight of the jth (j = 1, 2, 3 … n) activity, and fj is the observed frequency of an activity.
Monthly frequency of each of the six activities noticed during each bee sampling event was recorded and monthly disturbance index computed accordingly for each site using the modified index (Figure ). Bees were sampled during these visual surveys using two methods within a ~ 1 hectare area at each study site (Bhattacharyya, Citation2019): a) through active netting (using sweep nets along three 100 m × 2 m belt transects and along the edges of the natural clearings used for passive sampling; Droege, Citation2010), and b) via passive sampling (using UV blue bowls placed on the ground in 3 m × 3 m “X” shaped transects in three clearings at gaps of 20 m, as well as above the ground, up to 10 ft. using a height-adjustable stand; Surcica & Droege, Citation2010).
Figure 2. Monthly disturbance index values and bee species abundance at study sites 1 and 2. Disturbance index values are indicated by bars; species abundance is depicted by line graphs.
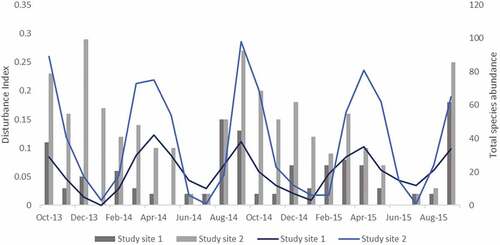
The disturbance indices computed monthly over two years at the two sites differed significantly (mean ± SD 0.05 ± 0.04 for site 1; mean ± SD 0.13 ± 0.08 for site 2; independent sample’s t = 4.077, df = 46, p < 0.0001, n = 24). We interpret this observation to suggest that the values of the index reflected the land-use patterns of the two study sites at the local community level, which is also evident from the stand characteristics data. The more heterogenous eco-restored site showed greater anthropogenic activities, which is in keeping with its former status of an ecotourism-park that has only recently fallen into disrepair because of anti-insurgent operations since 2010, but still experiences considerable local human traffic. Study site 1, on the contrary, presented a more homogenous forested habitat, which is congruent with its status of a protected forest that experiences less frequent disturbance at the plot level owing to restricted human entry.
In connection with bee abundance, positive correlations were observed between the monthly disturbance index scores and the sampled bee abundances at each site (site 1, Pearson’s r = 0.441, p = 0.03, n = 24; site 2, Pearson’s r = 0.447, p = 0.02, n = 24). Monthly disturbance index scores and bee species abundances at the two sites are shown in Figure .
From the context of insect community studies, knowledge of small-scale periodic disturbances caused by humans or animals is important as these are instrumental in creating microhabitats and making resources available, thereby supporting higher species richness and diversity (Van Lien & Âà-Ëüåí, Citation2013; Vera Y Conde & Rocha, Citation2006) because of increased niche occupation, niche expansion, and niche utilization by insects. Habitat complexity, a direct effect of disturbance, has been found to increase biodiversity in several studies (Sheffield et al., Citation2013; Winfree et al., Citation2007). For instance, Kambach et al. (Citation2013) suggest that disturbed forested ecosystems in the tropics have higher bee diversity and abundance, and tend to have shifts in their pollinator communities in favour of bees. Activities like litter sweeping, controlled fires, and grazing may clear the ground of debris, making it available for excavation of nests by ground-nesting bees. Leaf and twig collection may result in thinning of trees, thereby making branches suitable for comb building. They might also reduce the chances of attack by predatory birds by reducing the availability of perching sites. Human activities like excursions and picnics can prevent the growth of dense undergrowth in forested and semi-forested ecosystems, while also having negative effects on the resident flora and fauna by displacing them and causing pollution. Therefore, it is important to document plot-level disturbance when studying insect communities, and a disturbance index determined from visual data at the ground level may offer a suitable and economic evaluation method, especially in tropical forested ecosystems. The disturbance index suggested by Dewan and Vacik was used in this study for this purpose; following Roszkowska’s argument, our modifications made to the index following Stillwell et al.’s rank order weighting formula may add more objectivity to the index. However, further research is needed to attest to the robustness of the proposed method. A limitation of our study was that no sensitivity analysis was performed to determine the strength of the rankings. Further, we did not account for disturbance activities that left no visual signs. Future studies could build on our findings, address these limitations, and explore the suitability of using the proposed modified index to determine anthropogenic disturbance in forested habitats.
Supplemental Material
Download MS Word (16.6 KB)Disclosure statement
No potential conflict of interest was reported by the authors.
Data availability statement
Data available on request from the authors.
Supplementary material
Supplemental data for this article can be accessed online at https://doi.org/10.1080/23311932.2022.2132846
Additional information
Funding
References
- Bhattacharyya, M. (2019) Diversity and Ecology of Pollinator Bees (Hymenoptera: Apoidae) of Two Contrasting Habitats in Tropical Forest Ecosystem of Midnapore (West) District, West Bengal, India [ Doctoral dissertation]. Vidyasagar University.
- Biesmeijer, J. C., Roberts, S. P., Reemer, M., Ohlemuller, R., Edwards, M., Peeters, T., Schaffers, A. P., Potts, S. G., Kleukers, R., Thomas, C. D., Settele, J., & Kunin, W. E. (2006). Parallel declines in pollinators and insect-pollinated plants in Britain and the Netherlands. Science, 313(5785), 351–7. https://doi.org/10.1126/science.1127863
- Bird, R. B. (2015). Disturbance, complexity, scale: New approaches to the study of human–environment interactions. Annual Review of Anthropology, 44(1), 241–257. https://doi.org/10.1146/annurev-anthro-102214-013946
- Chiawo, D. O., Ogol, C. K., Kioko, E. N., Otiende, V. A., & Gikungu, M. W. (2017). Bee diversity and floral resources along a disturbance gradient in Kaya Muhaka Forest and surrounding farmlands of coastal Kenya. Journal of Pollination Ecology, 20, 51–59. https://doi.org/10.26786/1920-7603(2017)four
- Dewan, S., & Vacik, H. (2010). Analysis of regeneration and species diversity along human induced disturbances in the kassalong reserve Forest at Chittagong Hill Tracts, Bangladesh. Ekologia Bratislava, 29(3), 307–325. https://doi.org/10.4149/ekol_2010_03_307
- Droege, S. (2010). The very handy manual: How to catch and identify bees and manage a collection. USGS Native Bee Inventory and Monitoring Lab, 1–65. https://d9-wret.s3.us-west-2.amazonaws.com/assets/palladium/production/s3fs-public/atoms/files/The%20Very%20Handy%20Manual%20-%202015.pdf
- Eltz, T., Brühl, C. A., Van der Kaars, S., & Linsenmair, E. K. (2002). Determinants of stingless bee nest density in lowland dipterocarp forests of Sabah, Malaysia. Oecologia, 131(1), 27–34. https://doi.org/10.1007/s00442-001-0848-6
- Gikungu, M. W. (2006). Bee diversity and some aspects of their ecological interactions with plants in a successional tropical community [ Doctoral dissertation]. Universitäts-und Landesbibliothek Bonn.
- Grixti, J. C., & Packer, L. (2006). Changes in the bee fauna (Hymenoptera: Apoidea) of an old field site in southern Ontario, revisited after 34 years. The Canadian Entomologist, 138(2), 147–164. https://doi.org/10.4039/n05-034
- Kambach, S., Guerra, F., Beck, S. G., Hensen, I., & Schleuning, M. (2013). Human-induced disturbance alters pollinator communities in tropical mountain forests. Diversity, 5(1), 1–14. https://doi.org/10.3390/d5010001
- Kearns, C. A., Inouye, D. W., & Waser, N. M. (1998). Endangered mutualisms: The conservation of plant-pollinator interactions. Annual Review of Ecology and Systematics, 29(1), 83–112. https://doi.org/10.1146/annurev.ecolsys.29.1.83
- Kevan, P. G. (1991). Pollination: Keystone process in sustainable global productivity. Acta Horticulturae, 288(288), 103–110. https://doi.org/10.17660/ActaHortic.1991.288.11
- Kevan, P. G., & Viana, B. F. (2003). The global decline of pollination services. Biodiversity, 4(4), 3–8. https://doi.org/10.1080/14888386.2003.9712703
- Lepak, N., Newingham, B. A., Kachergis, E., Toledo, D., & Moffitt, J. (2022). Where do qualitative assessments fit in an era of increasingly quantitative monitoring? Perspectives from Interpreting indicators of rangeland health. Rangelands, 44(1), 39–49. https://doi.org/10.1016/j.rala.2021.07.008
- Lopes, M. A., & Ferrari, S. F. (2000). Effects of human colonization on the abundance and diversity of mammals in eastern Brazilian Amazonia. Conservation Biology, 14(6), 1658–1665. https://doi.org/10.1111/j.1523-1739.2000.98402.x
- Mallick, P. H., & Chakraborty, S. K. (2018). Forest, wetland and biodiversity: Revealing multi-faceted ecological services from ecorestoration of a degraded tropical landscape. Ecohydrology & Hydrobiology, 18(3), 278–296. https://doi.org/10.1016/j.ecohyd.2018.04.002
- Rocchini, D., Balkenhol, N., Carter, G. A., Foody, G. M., Gillespie, T. W., He, K. S., Kark, S., Levin, N., Lucas, K., Luoto, M., Nagendra, H., Oldeland, J., Ricotta, C., Southworth, J., & Neteler, M. (2010). Remotely sensed spectral heterogeneity as a proxy of species diversity: Recent advances and open challenges. Ecological Informatics, 5(5), 318–329. https://doi.org/10.1016/j.ecoinf.2010.06.001
- Roszkowska, E. (2013). Rank ordering criteria weighting methods–a comparative overview. Optimum Studia Ekonomiczne, 5(65), 14–33. https://doi.org/10.15290/ose.2013.05.65.02
- Sheffield, C. S., Kevan, P. G., Pindar, A., & Packer, L. (2013). Bee (Hymenoptera: Apoidea) diversity within apple orchards and old fields in the Annapolis Valley, Nova Scotia, Canada. The Canadian Entomologist, 145(1), 94–114. https://doi.org/10.4039/tce.2012.89
- Stillwell, W. G., Seaver, D. A., & Edwards, W. (1981). A comparison of weight approximation techniques in multiattribute utility decision making. Organizational Behavior and Human Performance, 28(1), 62–77. https://doi.org/10.1016/0030-5073(81)90015-5
- Surcica, A., & Droege, S. (2010). Height adjustable bee bowl traps. Penn. State Co-Operative Extension.
- Tuanmu, M. N., & Jetz, W. (2015). A global, remote sensing‐based characterization of terrestrial habitat heterogeneity for biodiversity and ecosystem modelling. Global Ecology and Biogeography, 24(11), 1329–1339. https://doi.org/10.1111/geb.12365
- Van Lien, V., & Âà-Ëüåí, Â. (2013). The effect of habitat disturbance and altitudes on the diversity of butterflies (Lepidoptera, Rhopalocera) in a tropical forest of Vietnam: Results of a longterm and large-scale study. Russian Entomological Journal, 22(1), 51–65. https://kmkjournals.com/upload/PDF/REJ/22/ent22_1%20051_065%20Vu%20for%20Inet.pdf
- Vera Y Conde, C. F., & Rocha, C. F. D. (2006). Habitat disturbance and small mammal richness and diversity in an Atlantic rainforest area in southeastern Brazil. Brazilian Journal of Biology, 66(4), 983–990. https://doi.org/10.1590/S1519-69842006000600005
- Winfree, R., Griswold, T., & Kremen, C. (2007). Effect of human disturbance on bee communities in a forested ecosystem. Conservation Biology, 21(1), 213–223. https://doi.org/10.1111/j.1523-1739.2006.00574.x
- Zurlini, G., Riitters, K., Zaccarelli, N., Petrosillo, I., Jones, K. B., & Rossi, L. (2006). Disturbance patterns in a socio-ecological system at multiple scales. Ecological Complexity, 3(2), 119–128. https://doi.org/10.1016/j.ecocom.2005.11.002