
 ?Mathematical formulae have been encoded as MathML and are displayed in this HTML version using MathJax in order to improve their display. Uncheck the box to turn MathJax off. This feature requires Javascript. Click on a formula to zoom.
Abstract
Aquaculture potential as a source of food security, protein, income, employment and poverty alleviation can be realized through improved production efforts in Zimbabwe. A survey was conducted in three districts of Masvingo to assess rural small-scale fish farmers’ perception and technical efficiency. Data was collected from 63 fish farmers using a primary cross-section approach. The field study was conducted from July to September 2021. A stochastic frontier production model (with technical inefficiency effects) was used to assess production. There were 73% male respondents, the average age was 51 years and 73% had attained formal education up to primary, secondary or tertiary level. Fish farming system was in earthen ponds stocked with mixed-sex tilapia fingerlings, collected mainly from the wild and fed mostly on local farm bi-products. The Cobb-Douglas production function was applied to relate production output to input variables. Results indicated significant positive correlation between the production output and the quantity of fingerling and feed inputs. Pond size had an inverse relation with production output. Fingerling and fish feed quality significantly reduced technical inefficiency, however, time allocated to fish farming and education insignificantly reduced technical inefficiency. Experience significantly increased technical inefficiency, but age, training, gender and occupation insignificantly increased technical inefficiency. Fish farmers were operating at 67% technical efficiency. The significance of input quantity and quality on aquaculture output, in the current study, informs any future aquaculture development plans in Zimbabwe, to consider investing in training and capital support.
PUBLIC INTEREST STATEMENT
Africa is generally a poverty-stricken continent, a problem currently being worsened by Climate Change, frequent droughts and the COVID-19 pandemic. In Zimbabwe, almost all food production systems are operating below optimal production level. More innovative approaches in exploiting some of the potential sources of protein, such as aquaculture, are long overdue. The findings from this study are meant to inform the different sectors on the key challenges significantly hampering aquaculture production and propose mitigatory measures for future management efforts.
1. Introduction
Aquaculture is gradually increasing in Africa, with Egypt being the highest aquaculture producer in Africa and globally second to China (Hinrichsen et al., Citation2022). Nigeria follows after Egypt, in production in the continent; however, in terms of aquaculture growth, Rwanda, Burundi, Lesotho and Benin have made most progress (Hinrichsen et al., Citation2022; Mmanda et al., Citation2020). In 2018, the global aquaculture production level for Africa was 2.7% contributing less than 2% to GDP (Food and Agriculture Organization of the United Nations (FAO), Citation2020). Meanwhile, in Zimbabwe, the 2018, aquaculture contribution to GDP was less than 0.2% (Food and Agriculture Organization of the United Nations (FAO), Citation2020). Only four (4) Southern African member states have managed to reach the 19 kg per capita consumption recommended by Food and Agricultural Organization (FAO), the 2018 per capita consumption in Zimbabwe was at 2.9 kg/annum (Food and Agriculture Organization of the United Nations (FAO), Citation2020). Some of the efforts to improve aquaculture from local, national to regional level were attempted through the establishment of the (2016–2026) Regional Aquaculture Strategy and Action Plan (SADC, Citation2016).
Although aquaculture was introduced, in the early 1950ʹs in Zimbabwe, progress has been hampered by the fact that fish as a source of protein tends to be out competed by livestock-based animal protein (Mangeni & Mhlanga, Citation2019). Fish farming started through stocking of fish in individually owned farm dams, as was similarly the case in Zambia (Kefi & Mwango, Citation2018). More aquaculture projects, in the country, developed in the 1980s with the technical and financial support from non-governmental organizations (NGOs; Shava & Gunhidzirai, Citation2017). Unfortunately, most of these projects were unsustainable beyond the different projects’ lifespans (Machena & Moehl, Citation2001). Zimbabwe has the suitable natural resources for aquaculture, but as in other African countries, aquaculture development was also affected by poor infrastructure, unavailability of aquaculture inputs, lack of aquaculture training, conflicting policies, limited capital investment and poor access to credit (Mangeni & Mhlanga, Citation2019; Nayibizi et al., Citation2022).
More efforts to promote aquaculture in Zimbabwe were also through the introduction of exotic species such as Nile tilapia (Oreochromis niloticus), a species which has now spread worldwide into over 100 countries, because of the assumption that the fish grows fast and is more resistant to adverse conditions (El-Sayed, Citation2006; Kefi & Mwango, Citation2018). In Zimbabwe, Nile tilapia has spread throughout the country despite efforts to control its spread by conservationists, who considered it as a threat to indigenous species, while on the contrary, extension service providers and NGOs regarded the fish species as a valuable bream suitable for alleviating protein shortage (Canonico et al., Citation2005; Mangeni & Mhlanga, Citation2019). The majority of small-scale farmers have grown Nile tilapia mixed with some local tilapia breeds under extensive aquaculture production systems (Machena & Moehl, Citation2001). However, intensive Nile tilapia cage culture was established in 1997, at Lake Harvest, in Lake Kariba, Zimbabwe (Mangeni & Mhlanga, Citation2019). Lake Harvest is a privately owned aquaculture enterprise, which was producing 2,500 tons per annum in 2010 and has been expanding ever since (African Development Bank, Citation2011). The enterprise specializes in the rearing of monosex fingerlings of Nile tilapia. The enterprise sells whole fish and fish fillets to Europe, in the region and in the country. Another exotic species is the rainbow trout cultured in raceways in the Eastern highlands of Zimbabwe (Mangeni & Mhlanga, Citation2019).
Generally, most sub-Saharan states, including Zimbabwe, continue to face perennial problems associated with availability and accessibility fish feed and fish fingerling inputs (Machena & Moehl, Citation2001; SADC, Citation2016). Significant implications of inputs are partly contributed to by the fact that fish feed is known to account for 50–60% of the total aquaculture production costs (El-Sayed & Kawanna, Citation2008; Hinrichsen et al., Citation2022), while fish growth performance is compromised by the use of tilapia fingerlings collected from the wild (Agykwah et al., Citation2020).
Literature reports that increase in production may be realized through improved technical efficiency, even without increase in input quantities, on condition there is also corresponding technological advancement, reduction in farm-level inefficiencies coupled with user-friendly policies (Baruwa & Omodara, Citation2019). Rural aquaculture is usually dominated by small-scale operators whose performance is influenced by stochastic biological, chemical, physical and socioeconomic factors (Khan et al., Citation2021). Zimbabwe’s rural fish farming efforts have been subject to ranging input use and inefficiency associated with socio-economic factors worsened by a lack of evidence on studies in technical efficiency in rural small-scale aquaculture production (Machena & Moehl, Citation2001; Mangeni & Mhlanga, Citation2019). The stochastic frontier approach is, commonly applied in the analysis of small-scale, farm-level production technical efficiency (Chirwa, Citation2007; Onumah et al., Citation2009). Technical efficiency is an indicator of production level commonly used to address input to output ratio in aquaculture production (Long et al., Citation2020). This study aims to examine the level of technical efficiency and its determinants in Masvingo.
Although the status of rural small-scale fish farming has been studied, more research is still needed on the assessment of factors relating to technical efficiency and inefficiencies. Using Chivi, Mwenezi and Chiredzi districts of Masvingo Province, Zimbabwe, the study seeks to (i) investigate the rural fish farmers’ characteristics and perceptions (ii) assess aquaculture input challenges and (iii) analyze the current level of technical efficiency in aquaculture production.
2. Materials and methods
2.1. Study sites
The study was carried out in three districts (Chivi, Mwenezi, and Chiredzi) of Masvingo Province, Zimbabwe between July and September 2021. Masvingo Province lies in Agro-ecological Zone III (650–800 mm of rainfall annually), IV (with less than 800 mm annual rainfall) and V (with less than 450 mm of annual rainfall) see, Figure . Furthermore, the province has some of the major countries’ drainage systems which include the Save, Mwenezi, Runde and Mutirikwi river systems and in addition, the two countries’ largest inland waterbodies, Tugwi-Mukosi and Mutirikwi dams (Chapungu, Citation2017). Based on the secondary data obtained from Ministry of Agriculture, Provincial sector, Chivi, Chiredzi and Mwenezi districts were rated highest in the province in aquaculture production.
Figure 1. Agro-ecological Zones of Masvingo Province, (Vincent & Thomas, Citation1960).
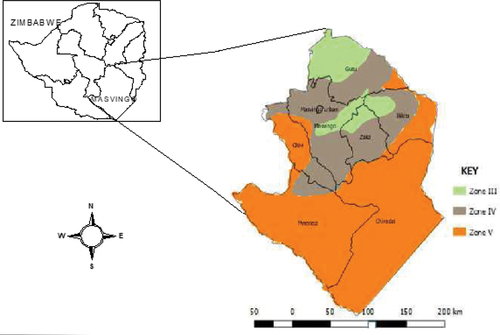
This study survey concentrated on aquaculture farmers from Agro-ecological Zone V. Zonal demarcations were set based on agricultural potential and constraints which took into consideration similarities in the climatic factors, soil type, physiographic features and waterbody availability (Chikodzi & Mutowo, Citation2012; Vincent & Thomas, Citation1960). In terms of aquaculture, farmers in Agro-ecological Zone V were exposed to similar environmental farming features, same land allocation specifications, producing almost similar crops and livestock. Aquaculture projects were spearheaded by NGOs and extension services which initially supplied tilapia fish for culture.
2.2. Research design and data collection
The research design was based on a primary cross-section approach (Kodua et al., Citation2022) in three districts, Chivi, Mwenezi and Chiredzi of Masvingo Province. Districts were selected from Agro-ecological Zone V, in consultation with Agricultural Technical and Extension Services (AGRITEX). A structured and semi-structured questionnaire instrument was used for data collection. The questionnaires were used as a guide in capturing information including data on fish farmers’ household sizes, active gender, marital status, age, formal education level, including perceptions and operational challenges in fish farming. More information was also collected on pond sizes, fish farming experience, training, occupation of farmer, exposure to extension services, fish fingerling source and fish feed source.
The study districts and farmers interviewed were selected through a multi-stage sampling technique (Onumah et al., Citation2009). The first stage involved the selection of districts that showed evidence of aquaculture production. The second stage was a purposive sampling of all those farmers which had ponds stocked with fish during the time of the study and more information on the fish farming activities was also obtained from agricultural officers based in the study area. A total of sixty-three (63) farmers were interviewed between July and September 2021. All information gathered was based on data from one production season. Data was collected by a team of three trained assistants using a validated questionnaire after adjustments were made following a pilot trial. Information gathered for the technical efficiency data was obtained as part of the questionnaire guided interviews which were conducted on farm-level operations (Nayibizi et al., Citation2022). Gathered information was in relation to pond size, fish seed sources, fish seed quantities, fish feed sources, feed quantities, fish stocking densities, time dedicated to fish culture duties, level of experience in fish farming and estimated fish yields per/m2.
A Great Zimbabwe University research ethics form was completed and approved. The ethical considerations included seeking for official permission to visit and interview the fish farming communities from all the relevant Provincial and District offices in Masvingo province. All site visits and interviews were conducted in company of the local Agricultural extension officers. Research participants were informed on the purpose of the research and how the data would be used. Participants were free to withdraw at any stage as well as to probe for any further clarification. The collected data was used for the purposes of this research, and all efforts were made not to interfere with the welfare of the respondents. The amount of time taken for the interviews depended on the number of farmers met at any given site, but a session was approximately an hour per farmer.
2.3. Data analysis and Stochastic frontier analysis (SFA)
Survey data was assessed through descriptive statistics in the form of frequency distribution tables and histograms (Mulokozi et al., Citation2020). The information obtained was used to assess the varying factors impacting on technical efficiency. Data analysis for both technical efficiency and various operational farm-specific variables was conducted through STATA software which was used in fitting an appropriate Stochastic Frontier Model (SFM). A logarithm transformation was applied to the quantitative variables, which is a pre-requisite when fitting a Cobb-Douglas function. The stochastic production frontier model is used to calculate whether a firm or a farmer is operating below the technical efficiency level (Chirwa, Citation2007; Onumah et al., Citation2009; Singh et al., Citation2009).
Stochastic frontier analysis uses econometric methods while Data Envelopment Analysis (DEA) uses mathematical programming. Stochastic frontier approach is preferred to DEA because of its inherent stochasticity (Aigner et al., Citation1977; Meeusen & van den Broeck, Citation1977). Stochasticity assumes randomness and uncertainty. SFA specifies output variability by a non-negative random error term (u) to generate a measure of technical inefficiency as considered also by advocates of the deterministic approach and a systematic random error (v) to account for effects of exogenous shocks beyond the control of the analyzed units e.g., diseases, weather, theft, measurement errors and any other statistical noise (Singh et al., Citation2009). The stochastic frontier model was used to establish the impact of variables such as quantity and quality of fish fingerling and fish feed, pond size, gender of the farmer, farmer’s age, education, experience, occupation of famer, time dedicated to aquaculture and training on fish production efficiency. The assessment applied a stochastic production frontier model to measure production variability in relation to inputs (Sesabo & Tol, Citation2006).
2.4. Model specification
Empirical data were analyzed using STATA software. The level of technical efficiency was calculated in relation to the production output using the Battese and Coelli (Citation1995) model. The truncated normal distribution was applied instead of the half normal and the exponential distribution. The decision to use the truncated normal distribution was made after an error message appeared with both the half normal and exponential distribution, thus validating the use of the truncated normal distribution applied in this study. The truncated normal distribution allows for the estimation of both a frontier model and technical inefficiency using the one-step approach. The stochastic frontier production function of first-order flexible Cobb-Douglas form was adopted for this study. This functional form is widely used in frontier production studies (Coelli & Battese, Citation1996). In this study, a Cobb–Douglas stochastic production function was fitted simultaneously with the technical inefficiency.
2.5. Definition of variables
Variables considered for technical efficiency were fish feed quantity, fingerling quantity and pond size which are defined below and a model first proposed by Aigner et al. (Citation1977) and Meeusen and van den Broeck (Citation1977) was used.
The SFM was expressed in equation (I) as:
LnYi = β0 + β1ln(feedquantity) + β2ln(fingerlingquantity) + β3(lnpondsize) + vi-ui (I)
Where i and Ln are the ith farmer and logarithm to base e; vi is independent and identically distributed random errors independent of μi., μi is the technical inefficiency effects; Y denotes the quantity of fish harvested (kgs) per m2; Feedquantity represents the amount of feed used to maturity per 1000 m2 pond area; Fingerlingquantity represents the number of fingerlings stocked per/1000 m2; Pondsize represents the pond size in m2.
The model for various operational farm-specific variables with possible influence on technical
inefficiencies in this study are defined in equation (II) below:
ui = δ0 + δ1 ln(Hd) + δ2 ln(Age) + δ3 ln(Edu) + δ4 ln(Traing)+ δ5 ln(Occ.) + δ6 (Ge) + δ7 ln(Exp)
+ δ8 ln(Fingerlingsource) + δ9 ln(Feedsource) (II)
where: ui is the Technical Inefficiency; Humandays represents the level of time per month dedicated to fish farming activities by the farmer; Age represents the age of the farmer in years; In this study educated referred to those who had attained Primary, Secondary or Tertiary Education while not educated meant those who had not gone to school; Training is a dummy variable which has a value of one if the farmer has fisheries training, zero if not; Occupation is dummy variable which has a value of one if farmer is fulltime, zero if not; Gender is a dummy variable which has a value of one if farmer is a male, zero if female; Experience represents number of years in fish farming by the farmer; Fingerlingsource is a dummy variable which has a value of one if fingerling source is commercial/certified, zero is noncommercial (refers to fingerlings from the wild/middleman); Feedsource is a dummy variable which has a value of one if feed source is commercial/certified, zero if non-commercial (refers to feed from kitchen or farm bi-products), also determining quality of input. The effects of several variables on technical inefficiency was calculated using Equation II. To check if the SFA is appropriate for the data, when fitting the SFA model, the parameter has to be calculated and should be between 0 and 1. If the obtained value is equal to 0 this implies that technical inefficiency is not present, hence the ordinary least square estimation would be an adequate method to estimate parameters. If the obtained value is close or equal to 1, this means the SFA is appropriate (Chirwa, Citation2007).
3. Results
3.1. Fish farmers’ information
In total 63 fish farmers were interviewed from three districts in Agro-ecological Zone V of Masvingo. Most of the respondents (42.9%) were from Chiredzi, followed by (33.3%) from Mwenezi and (23.8%) from Chivi. Fish farming households comprised of 73% male and 23% were female headed households most of whom were widows, see, Table . Of the 63 respondents 65% had a family size of 4–9 members Most fish farmers were between the 46–56 years constituting 68.3% of the total sampled farmers followed by 26–36 years (12.7%), >56 years (9.3%), 36–46 years (6.3%) and <26 years (3.2%).
Table 1. Household information
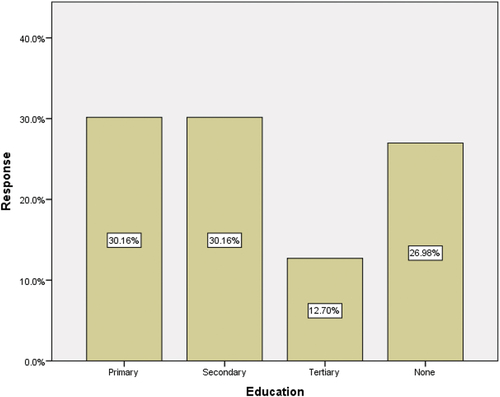
In this study, educated referred to those who had attained Primary, Secondary or Tertiary education while Not educated meant those who had not gone to school. Primary and Secondary level were 30.16% respondents in each level, Tertiary level had 12.70% respondents, while the those who had not attended school were 26.98%, see, Figure .
Figure 2. Farmers’ response on Education level attained.
3.2. Fish farming characteristics
The majority of the respondents (79.4%) were into full time farming because they were also into crop and livestock farming see, Table . Those who were in formal employment (12.5%) conducted fish farming as means of generating extra income and for some it was a hobby. Fish farming training (66.7%) was in region of 2–5 years, and it was mostly provided by the donor organizations as part of the package of the aquaculture project objectives. All the ponds were earthen. Most had practiced aquaculture for 2–5 years after having received donor funding. However, 19% obtained their training from observing neighbors who were already in the business. Fish feed (76.2%) was from non-commercial sources (e.g., kitchen wastes, livestock manure and grain-byproducts) and (23.8%) from commercially produced fish pellets.
Table 2. Fish farming information
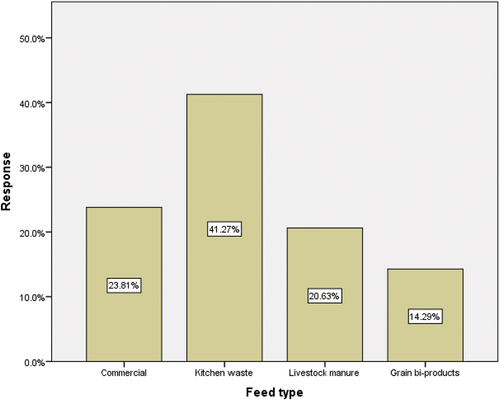
The different types of feeds used by farmers (41.27%), kitchen wastes (23.81%), commercial feed (20.63%), livestock manure and (14.29%) grain bi-products, see, Figure . Non-commercial feeds were 76.19% and commercial feeds were 23.81%.
Figure 3. Farmers’ responses on commonly used feed type.
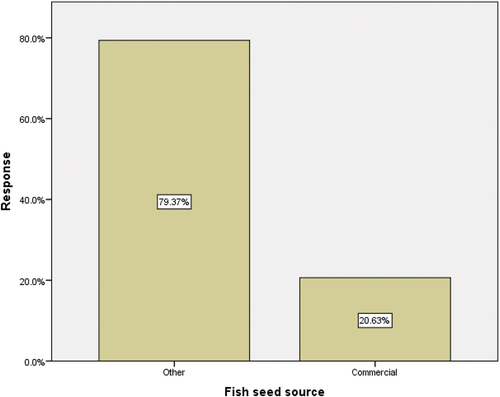
Fish seed/fingerling source was either commercial (20.63%) or other (79.37%), where other refers to sources including the wild, middleman or neighbors, see Figure .
Figure 4. Farmers’ responses on fish seed/fingerling source.
3.3. Variables and Descriptive statistics
The descriptive statistics for some of the variables which include fish production, pond size, feed quantity, fingerling quantity, experience, age and human days are presented in Table . All pond observations were in Agro-ecological Zone V, which implied the climatic condition, the soil, water availability and physiological characteristics were similar within the three districts. All observed ponds were being operated by individuals who owned one or two earthen ponds. The average pond size was 1000 m2, with an average depth of 1 to 1.5 m. All ponds had no water outlets. The commonly cultured fish was tilapia bream in all the observed ponds. According to respondents Catfish was not cultured since it was not consumed by the majority due to different beliefs and backgrounds.
Table 3. Variables and descriptive statistics
Feed quantity administered by the farmers was on average 784 kg/growth season. The average fingerling quantity was about 671 fish fingerlings/1000 m2 translating to a stocking density of one fish/m2. Respondents said stocking was mostly determined by the provision of fish fingerlings which was mostly from the wild, middleman or neighbors. Fish growing period was estimated to be between 8 and 10 months; however, a few of the farmers had not yet harvested their fish and were not sure of the culture period. The production estimates per 1000 m2 pond was 300 kg. According to experience most had at least 2 years of experience. The mean age was 51 years old. In terms of time committed to fish farming activities, the mean number of days was 15 days per month.
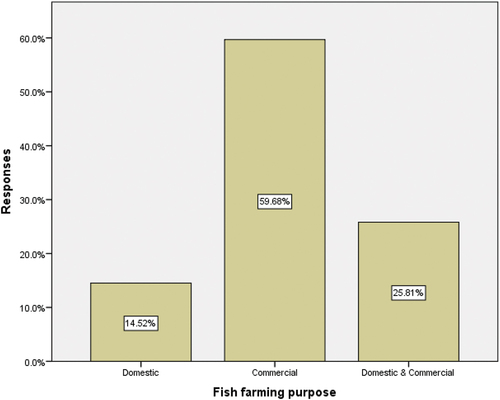
Respondents reported that fish production was for different purposes, see, Figure .e. commercial/for sale (59.68%), both domestic and commercial use (25.81%) and for domestic use purpose (14.52%).
Figure 5. Framers’ perception on purpose of fishing farming.
3.4. Estimation of the production frontier
Output and input variables considered in the stochastic frontier model and the relevant operational and farm-specific variables specified in the inefficiency model are as shown in Table .
Table 4. Maximum likelihood estimation of the production frontier with inefficiency model (dependent variable: fish production)
3.4.1. Estimated technical efficiency
Results in this study show that elasticity of fingerling quantity stocked was β3 = 2.07, p < 0.05, implying that a 10% increase in fingerling quantity significantly increased fish production by 20.7% and the elasticity of feed quantity was β1 = 0.30, p < 0.05, meaning that an increase of 10% in feed quantity significantly increased fish production by 3%. Meanwhile, elasticity of pond size (β3 = −2.35, p < 0.05) reduces fish production, since a 10% increase in pond size significantly decreased fish production by 23.5% implying that there was an inverse relation between pond size and production output. The overall result on the assessment of technical efficiency among the fish farmers was below optimal output capacity. A typical farmer in the sample had a technical efficiency level of 63% meaning that operations were 37% below expected output.
3.4.2. Technical Inefficiency
Fingerling source (δ8 = —4.07, p < 0.05) and feed source (δ9 = —2.83, p < 0.05) had negative significant coefficients which reduced technical inefficiency. Experience (δ7 = 0.81, p < 0.05) had a positive significant coefficient which increased technical inefficiency. However, Humandays i.e. time allocated to fish farming (δ1 = —0.08, p > 0.05) and Education (δ3 = —2.15, p > 0.05) had negative insignificant coefficients which reduced technical inefficiency. Meanwhile, Age (δ2 = 0.02, p > 0.05), Training (δ4 = 0.60, p > 0.05), Occupation (δ5 = 0.65, p > 0.05) and Gender (δ6 = 1.73, p > 0.05) had positive insignificant coefficients which increased technical inefficiency.
4. Discussion
4.1. Fish farmers’ information and fish farming perspectives
An assessment of aquaculture production was conducted from June to September 2021 in three districts in Agro-ecological Zone V of Masvingo Province, Zimbabwe. The observation that more males (73%) are into fish farming was also reported by Mmanda et al. (Citation2020) and Asamoah et al. (Citation2012). In Zimbabwe, males are household heads and dominate the decision-making role including determination on projects to be undertaken by the family. Females are more responsible for domestic issues except when they are widowed, unmarried or divorced, agreeing with findings by Mangeni and Mhlanga (Citation2019); Mulokozi et al. (Citation2021). Most of the respondents were between 46 and 56 years (68.3%), in-line with the almost similar age group reported by Singh et al. (Citation2009) with the average age of 51 years being consistent with 50 years observed by Asamoah et al. (Citation2012). The elderly in this study, were into fish farming partly because of their land ownership status. Most of the respondents had attended primary (30.2%), secondary (30.2%) and tertiary (12.6%) and only a few (26.98%) had not attended any form of formal education. Results indicated that the majority of the fish farmers were literate and could comprehend some basic fish farming techniques as similarly observed by Mangeni and Mhlanga (Citation2019); Agykwah et al. (Citation2020).
The majority of the respondents were fulltime farmers who conducted fish farming at a smaller scale when compared to crop and livestock farming since they considered aquaculture as a high-risk enterprise (Hasimuna et al., Citation2019). All ponds were earthen, as respondents found them cheaper to construct (Agykwah et al., Citation2020). Only individually owned ponds were still functional while all group owned ponds had seized operations due to poor sense of ownership and mistrust among group members (Machena & Moehl, Citation2001; Mulokozi et al., Citation2021). Cultured fish were mainly fed from non-commercial feed (76.19%), which comprised of kitchen wastes (41.27%), livestock manure (20.63%) and grain bi-products (14.29%). Kitchen waste was referred mainly to left-over meals from the staple food prepared from maize meal. Grain bi-products were from millet products, but millet grains were usually produced in much less quantities than maize and livestock manure being also used in cropping. Commercially produced fish feeds were only purchased by a few farmers who could afford the feed including the transport costs (Yakubu et al., Citation2022). However, and Khan et al. (Citation2021) observed that farmers who practiced integrated farming had better access to resources such as grain-byproducts and manure for use in aquaculture (Mulokozi et al., Citation2021). Tilapia fish was the dominating fish, and fish farmers were of the opinion that Catfish was not a favored species for different reasons including religious beliefs (Mustapha et al., Citation2013). Fish fingerlings were being sourced from non-established points such as neighbors, from the wild and middleman, because of shortages in fish hatchery facilities (El-Sayed, Citation2006; Mangeni & Mhlanga, Citation2019).
In the face of input and technical knowledge challenges farmers’ perceptions were that fish farming had unexploited potential and felt motivated to continue (Haque & Dey, Citation2017). In their opinion, it was a sure source of protein for their families and also a source of income . However, marketing of harvested fish was still a challenge since the fish farmers lacked freezing facilities were not aware of the fish markets, the competitive selling prices and had no reliable transport to ferry the product (Mangeni & Mhlanga, Citation2019). Tangible evidence obtained by respondents through fish income included constructed homestead structures, payment of fees for dependents, diversification into poultry farming and setting up of solar powered activities. Despite the frequent droughts they encountered, respondents mentioned the existence of many waterbodies in their province as an advantage towards aquaculture.
4.2. The Production frontier: technical efficiency
In this study, the elasticity of fingerling quantity (β3 = 2.07, p < 0.05) meant that a 10% increase in fingerling quantity, having all other inputs constant, raised fish yield by 20,7% similar positive correlation between fingerling quantity and yield was reported by El-Sayed (Citation2006) and Asamoah et al. (Citation2012). In addition, the elasticity of feed quantity (β1 = 0.30, p < 0.05), meant that a 10% increase in feed quantity, having all other inputs constant, increased fish production by 3% confirming findings also reported in Egypt by El-Sayed (Citation2006) and in Ghana by Kodua et al. (Citation2022). Current results confirm the varying effects that different inputs can have on production output, hence agreeing with observations by Alam and Guttormsen (Citation2019); Baruwa and Omodara (Citation2019). Fingerling quantity and feed quantity differed in elasticity; however, there is need to relate stocking densities to feed cost, since feed accounts for over 60% of production costs (El-Sayed, Citation2006; Hinrichsen et al., Citation2022).
Elasticity of pond size (β3 = −2.35, p < 0.05) implied a 10% increase in pond size decreased fish production by 23.5%, the inverse relation in pond size and fish yield agreed with the results by Inoni (Citation2007) and Khan et al. (Citation2021). In this study, it implies that any increase in pond size, under the current operational scale, will not add any value but have a negative impact on fish yield. Loss of technical efficiency under larger ponds occurs due to resource limitations, for example, insufficient monitoring effort increases management risk (Kapute et al., Citation2016; Losinger, Citation2006). The average pond size of 1000 m2 in this study agrees with the 954 m2 reported by Asamoah et al. (Citation2012). A typical farmer in the sample had a technical efficiency level of 63% meaning that operations were 37% below expected output.
4.2.1 The lack of precise economic information within the small-scale fish farming sector in developing countries which impacts on the management efficiency criteria was observed as reported by Sergio (Citation2011). The aquaculture sector in the three districts suffered from capital and resource scarcity which included failure to provide adequate quantity and quality of inputs, hence impacting on production performance (Sesabo & Tol, Citation2006). Availability and accessibility of fish feed and fish fingerling inputs was the major challenge in the three studied districts (Machena & Moehl, Citation2001; SADC, Citation2016). Small-scale fish farmers opted for non-formal input sources, as means of reducing input costs, despite the possible compromise on the production output, supporting findings by Akhtarul et al. (Citation2019). Production performance in this study was, therefore, partly influenced by stochastic socio-economic factors associated with poor data collection and record keeping as similarly observed by Khan et al. (Citation2021).
4.3. Technical inefficiency
Fingerling source (δ8 = —4.07, p < 0.05) and feed source (δ9 = —2.83, p < 0.05) negative coefficients meant a reduction in technical inefficiency also positively impacting on technical efficiency. Results indicating a positive correlation between input quality and technical efficiency confirmed similar findings by Mustapha et al. (Citation2013) and Pandit et al. (2017). Most of the feed in this study came from the farmers’ homesteads (Khan et al., Citation2021) while fingerlings were obtained from neighbors, some middleman or from the wild (El-Sayed, Citation2006; Asamoah et al., Citation2012). Production was partly impacted as respondents cited their lack of control in terms of stocking time, densities and fingerling quality (Awoyemi et al., Citation2003). Despite being within the recommended feed limits of 640–800 kg for the average pond size of 1000 m2 (Bhujel, Citation2013), poor harvest was realized probably due to the limited awareness among farmers on the required feed nutritional composition (El-Sayed, Citation2006; Khan et al., Citation2021).
Human days (time allocated to fish farming) (δ1 = —0.08, p > 0.05) reduced technical inefficiency. In this study, the mean number of days dedicated to fish farming was about 15 days per month. Results although not significantly show a positive relation between days allocated and technical efficiency, in-line with Khan et al. (Citation2021) who stated that fish require more observation time when compared to terrestrial organisms. In addition, almost all the farmers relied on family labor which was considered less efficient when compared to hired labor because in the case of hired labor the farmer tends to be alert and strict as a means of ensuring best work output and value for money (Kodua et al., Citation2022). Education (δ3 = —2.15, p > 0.05) reduced technical inefficiency, implying, although insignificantly, that fish farmers were generally literate, thus contributing to their ability to perceive, appreciate and manage basics in aquaculture production, as also reported by Khatiwad et al. (Citation2022).
Experience (δ7 = 0.81, p < 0.05) had a positive significant coefficient which increased technical inefficiency implying a negative impact on technical efficiency these results are similar to the findings of Raphael (Citation2008) and Singh et al. (Citation2009) who reported that, experienced farmers, were older and tended to be more conservative, less receptive to change and new technology. The inefficiency which came with experience was also partly attributed to decreased level of commitment (Baruwa & Omodara, Citation2019; Kodua et al., Citation2022).
Age (δ2 = 0.02, p > 0.05), training (δ4 = 0.60, p > 0.05), occupation (δ5 = 0.65, p > 0.05) and gender (δ6 = 1.73, p > 0.05) had positive insignificant coefficients which increased technical inefficiency.
In this study, there was a high number of older, 46–56 years of age, individuals with conservative and risk eversion tendencies which increased with age as similarly noted by Singh et al. (Citation2009). Poor training in aquaculture was evident as respondents were neither aware of the implications of feed and fingerling quality or quantity to growth performance nor the relevance of pond water inlets and outlets to water quality management (Bhujel, Citation2013; Khan et al., Citation2021). Respondents were convinced, better performing farmers benefitted from more technical exposure to extension services since their plots were sometimes used as demonstration sites. Inefficiency associated with poor training can only be addressed through an emphasis on extension services as recommended by Mulokozi et al. (Citation2020). The occupation of the majority of the respondents was fulltime farming in crop and livestock production. Time allocation under such integrated production could compromise attention to fish farming since fish production in all observed farms was conducted at a smaller scale leading to the effects of farmer/farm specific factors on technical inefficiencies (Singh et al., Citation2009). Gender also insignificantly contributed to technical inefficiency, probably due to the differences in performance capacity between male and female fish farmers in rendering certain duties. For instance, when theft and predation of fish were threatening, some women could not perform night duties, fish theft is a common global challenge (FAO, Citation2018).
5. Conclusion
The study assessed the fish farmers’ characteristics, perceptions and technical efficiency in aquaculture production of small-scale rural fish farmers in three districts within Agro-ecological Zone V, Masvingo Province, Zimbabwe. The potential for aquaculture as an alternative source of protein is high in Zimbabwe. Availability and accessibility of good quality fish feed and fish fingerlings has significant impacts on production output. Currently, farmers in this study are operating at 67% technical efficiency. The findings inform planners and policymakers on how the current aquaculture production can be increased through provision of aquaculture training, extension services, technological advancement, access to credit and supportive policies.
Acknowledgements
This study was conducted through the assistance of Great Zimbabwe University staff, namely Doctor N. Mabika and Doctor T. Makoni including the field involvement of Agricultural Technical and Extension Services, Masvingo Province, Zimbabwe.
Disclosure statement
The authors did not report any conflict of interest.
Additional information
Funding
Notes on contributors
Rachel Gwazani
Rachel Gwazani is a Senior Lecturer in the Department of Livestock, Wildlife and Fisheries, at Great Zimbabwe University and responsible for fisheries and wildlife modules. She holds a Masters degree in Fisheries Management and BSc Hons degree in Agriculture. Previously Rachel worked as an Aquatic Ecologist for the Zimbabwe Parks and Wildlife Management Authority.
Edson Gandiwa
Edson Gandiwa is a Director of Scientific Services at the Zimbabwe Parks and Wildlife Management Authority. He has a PhD in Wildlife Conservation and Management from Wageningen University, the Netherlands. He has widely published in the areas of wildlife conservation andmanagement.
References
- African Development Bank (2011) Lake Harvest Aquaculture Expansion Project, Zimbabwe
- Agykwah, S. K., Asmah, R., Mensah, E. T. D., Ragasa, C., Amewu, S., Tran, N., Oyih, M., & Ziddah, P. (2020). Farmers’ manual on small-scale tilapia pond farming in Ghana. CSIR-Water Research Institute.
- Aigner, D. J., Lovell, C. K., & Schmidt, P. (1977). Formation and estimation of stochastic frontier production function models. Journal of Econometrics, 6(1), 21–15. https://doi.org/10.1016/0304-4076(77)90052-5
- Akhtarul, A., Vasquez LE, M., Rp, A., Erdoes, G., Schreiber, J. U., Fassl, J., Wilkinson, K., A, F. F., von Dossow, V., Greenhalgh, D., Plamondon, M.-J., Neto C, N., Paternoster, G., Landoni, G., Erb, J. M., Guarracino, F., Mukherjee, C., Rosseel, P., Howell, S., Antoniou, T. (2019). Production risk and technical efficiency of tilapia aquaculture in Bangladesh.marine resources economics. Journal of Cardiothoracic and Vascular Anesthesia, 34(2), 512–520. https://doi.org/10.1053/j.jvca.2019.09.029
- Alam, M. A., & Guttormsen, A. G. (2019). Risk in aquaculture: Farmers’ perceptions and management strategies in Bangladesh. Aquaculture Economics & Management, 23(4), 359–381. https://doi.org/10.1080/13657305.2019.1641568
- Asamoah, E. K., Nunoo, F. K. E., Osel-Asare, Y. B., Sumulla, U. R., & Sumaila, U. R. (2012). A production function analysis of pond aquaculture in Southern Ghana. Aquaculture Economics & Management, 16(3), 183–201. https://doi.org/10.1080/13657305.2012.704616
- Awoyemi, T. T., Amao, J. O., & Ehirim, N. C. (2003). Technical Efficiency in Aquaculture in Oyo State, Nigeria. Indian Journal Of Agricultural Economic, 38(4). https://ageconsearch.umn.edu/record/297989/files/ijae-620.pdf
- Baruwa, O. I., & Omodara, O. D. (2019). Technical efficiency of aquaculture systems in Oyo State, Nigeria: Stochastic frontier approach. Journal of Aquatic Research and Marine Sciences, 2(1). file:///C:/Users/Dry%20Land/Downloads/ARMS-103026Final.pdf
- Battese, G. E., & Coelli, T. (1995). A model for technical inefficiency effects in a stochastic frontier production function for panel data. Empirical Economics, 20(2), 325–332. https://doi.org/10.1007/BF01205442
- Bhujel, R. C. (2013). On-farm feed management practices for Nile tilapia (Oreochromis niloticus in Thailand. In FAO Fisheries and Aquaculture Technical, Vol. 583 (pp. 159–189). https://www.fao.org/fishery/docs/CDrom/T583/root/06.pdf
- Canonico, G. C., Arthington, A., Mccrary, J. K., & Thieme, M. (2005). Invasive tilapia species Conserv: Mar. Freshw. Ecosyst, 15(5), 463–483. https://doi.org/10.1002/aqc.699
- Chapungu, L. (2017). Impact of Climate Change on vegetative species diversity in Masvingo province, Zimbabwe. DPhil Theses, University of South Africa
- Chikodzi, D., & Mutowo, G. (2012). Agro-ecological zonation of Masvingo region: land suitability classification factoring in climate change, variability swings and new technology. 1–318. https://dx.doi.org/10.4172/scientificreports.318
- Chirwa, E. W. (2007). Sources of technical efficiency among smallholder maize farmers in Southern Malawi. The African Economic Research Consortium. https://www.future-agricultures.org/wp-content/uploads/pdf-archive/Chirwa%20-%202003%20-%20Sources%20of%20technical%20efficiency%20among%20Smallholder.pdf
- Coelli, T. J., & Battese, G. E. (1996). Identification of Factors which Influence the Technical Inefficiency of Indian farmers. Australian Journal of Agricultural Economics, 40(82), 103–128. https://doi.org/10.1111/j.1467-8489.1996.tb00558.x
- El-Sayed, A. M. (2006). Tilapia Culture. CABI Publishing CAB International.
- El-Sayed, A. M., & Kawanna, M. (2008). Effects of dietary protein and energy levels on spawning performance of Nile tilapia (Orechromis niloticus) broodstock in a recycling system. Aquaculture, 280179–280184. https://doi.org/10.1016/j.aquaculture.2008.04.030
- FAO. (2018). The State of World Fisheries and Aquaculture 2018 – Meeting the sustainable development goals. https://www.fao.org/3/I9540EN/i9540en.pdf
- Food and Agriculture Organization of the United Nations (FAO). (2020). The State of world fisheries and aquaculture 2020. In Sustainability in Action (pp. 244). FAO.
- Haque, A. M., & Dey, M. M. (2017). Impacts of community-based fish culture in seasonal floodplains on income, food security and employment in Bangladesh. Food Security, 9(1), 25–38. https://doi.org/10.1007/s12571-016-0629-z
- Hasimuna, O. J., Maulu, S., Monde, C., & Mwemba, M. (2019). Cage aquaculture production in Zambia: Assessment of opportunities and challenges on Lake Kariba, Siavonga district. Egyptian Journal of Aquatic Research, 45(3), 281–285. https://doi.org/10.1016/j.ejar.2019.06.007
- Hinrichsen, E., Walakira, J. K., Langi, S., Ibrahim, N. A., Tarus, V., Badmus, O., & Baumuller, H. (2022). Prospects for Aquaculture Development in Africa: A review of past performance to assess future potential. Center for Development Research University of Bron, Working Paper, 211, 1–45. https://doi.org/10.48565/bonndoc-17
- Inoni, O. E. (2007). Allocative efficiency in pond fish production in Delta State, Nigeria: A production function approach. Agricultura Tropica Et Subtropica, 40(4), 127–134. http://agriculturaits.czu.cz/pdf_files/vol_40_4_pdf/1Inonix.pdf
- Kapute, F., Valeta, J., Likongwe, J., Kang’ombe, J., Nagoli, J., & Mbamba, D. (2016). Growth performance of three tilapia fish species raised at varied pond sizes and water depths. International Journal and Fisheries Aquaculture, 8(8), 81–86. https://doi.org/10.5897/IJFA2016.0566
- Kefi, A. S., & Mwango, J. (2018). Is the culture of exotic fish species the answer to low fish productivity? A case study on the use of Oreochromis niloticus in Zambia. International Journal of Fisheries and Aquaculture, 10(11), 129–139. https://doi.org/10.5897/IJFA2018.0703
- Khan, A., Ratna, B., Rasmus, N., & Ayoe, H. (2021). Production risk, technical efficiency and input use nexus. Lessons from Bangladesh aquaculture. Journal of the World Aquaculture Society, 52(1), 57–72. https://doi.org/10.1111/jwas.12767
- Khatiwad, D., Yadav, P., & Jaiswal, D. (2022). Technical efficiency of Ginger production in Ilam district of Nepal: A Stochastic Production Frontier Approach. Advances in Agriculture, 2022, 1–8. https://doi.org/10.1155/2022/3007624
- Kodua, T. T., Onumah, E. E., & Mensah-Bonsu, A. (2022). Technical efficiency of improved and local variety seed maize farms in Ghana: A meta-frontier analysis. Cognet Economica & Finance, 10, 1. https://doi.org/10.1080/23322039.2021.2022858
- Long, L. K., Thap, L. V., Hoal, N. T., & Pham, T. T. T. (2020). Data envelopment analysis for analyzing technical efficiency in aquaculture: The bootstrap methods. Aquaculture Economics and Management, 24(4), 422–446. https://doi.org/10.1080/13657305.2019.1710876
- Losinger, W. C. (2006). Factors influencing the variance in expected yield on catfish farms in the United States. Aquaculture International, 14(5), 415–419. https://doi.org/10.1007/s10499-006-9044-3
- Machena, C., & Moehl, J., 2001, Sub-Saharan African aquaculture: Regional summary, In R. P. Subasinghe, P. Bueno, M. J. Phillips, C. Hough, S. E. McGladdery, & J. R. Arthur (FAO/ NACA), eds, Aquaculture in the third millennium. technical proceedings of the conference on aquaculture in the third millennium, Bangkok, Thailand, 20-25 February 2000, pp. 341–355.
- Mangeni, H., & Mhlanga, W. (2019). The role of smallholder pond aquaculture in livelihoods, income and food security. A case of Kushinga fish-farmers, Masvingo. International Journal of Aquaculture, 9(3). https://doi.org/10.1038/s43016-022-00467-1
- Meeusen, W., & van den Broeck, J. (1977). Efficiency estimation from Cobb-Douglas production function with composed error. International Economic Review, 18(2), 435–444. https://doi.org/10.2307/2525757
- Mmanda, F. P., Mulokozi, D. G., Lindberg, J., Halden, E., Mtolera, A. N., Kitula, M., & Lundh, T. (2020). fish farming in Tanzania: The availability and nutritive value of local feed ingredients. Journal of Applied Aquaculture, 32(4), 341–360. https://doi.org/10.1080/10454438.2019.1708836
- Mulokozi, P. M., Berg, H., Tamatamah, R., Lundh, T., & Onyango. (2021). Assessment of pond and integrated aquaculture (IAA) systems in six districts of Tanzania. Journal of Agriculture and Development in the Tropics and Subtropics, 122(1), 115–126. https://doi.org/10.1038/s43016-022-00467-1
- Mulokozi, D. P., Mmanda, F. P., Onyango, P., Lundh, T., Tamatamah, R., & Berg, H. (2020). Rural aquaculture: Assessment of its contribution to household income and farmers’ perception in selected districts. Tanzania. Aquaculture Economics & Management, 24(4), 387–405. https://doi.org/10.1080/13657305.2020.1725687
- Mustapha, N. H. N., Aziz, A. A., & Hashim, N. M. H. (2013). Technical efficiency in aquaculture industry using Data Envelopment Analysis (DEA) window. Evidence from Malaysia Journal of Sustainability Science and Management, 8(2), 137–149. https://doi.org/10.1038/s43016-022-00467-1
- Nayibizi, L., Vidakovic, A., Hladen, A. N., Tabaro, S. R., & Lundh, T. (2022). Aquaculture and aquafeed in Rwanda: Current status and perspectives. Journal of Applied Aquaculture, 1–22. https://doi.org/10.1080/10454438.2021.2024315
- Onumah, E. E., Hoerstgen-Schwark, G., & Bemhard, B. (2009). Productivity of hired and family labor and determinates of technical inefficiency in Ghana’s fish farms. Discussion Papers Nr, 9(7). https://doi.org/10.17221/38/2009-AGRICECON
- Prabu, E., Rajagopalsamy, C. B. T., Ahilan, B., Jeevagan, J. M. A., & Renuhadevi, M. (2020). Tilapia- An excellent candidate species for world aquaculture: A Review Annual Research & Review in Biology, https://doi.org/10.1038/s43016-022-00467-1
- Ragasa, C., Charo-Karisa, H., Rurangwa, E., Tran, N., & Shikuku, M. (2022). Sustainable aquaculture development in sub-Saharan Africa. Nurture Food, 3(2), 92–94. https://doi.org/10.1038/s43016-022-00467-1
- Raphael, I. O. (2008). Technical efficiency of cassava farmers in southeastern Nigeria: Stochastic frontier approach. Agricultural Journal, 3, 152–156. https://doi.org/10.1038/s43016-022-00467-1
- SADC. (2016). Regional Aquaculture Strategy and Action Plan. SADC.
- Sergio, C. (2011) Measuring Technical Efficiency in a small-scale fishery: A causality analysis. AAEA & NAREA Joint Annual Meeting, Pittsburg, Pennsylvania. AgEcon.
- Sesabo, J. K., & Tol, R. S. J. (2006). Technical efficiency and small-scale fishing households in Tanzania coastal villages: an empirical analysis source, track citations by RSS feed, Research unit Sustainability and Global Change, Hamburg University. New Economics Papers.
- Sharma, K. R., & Leung, P. (2003). A review of production frontier analysis for aquaculture management. Aquaculture Economics & Management, 7(1–2), 1–2, 15–34. https://doi.org/10.1080/13657300309380329
- Shava, E., & Gunhidzirai, C. (2017). Fish farming as an innovative strategy for promoting food security in drought risk regions of Zimbabwe. Journal of Disaster Risk Studies, 9(1). https://doi.org/10.1080/13657300309380329
- Singh, K., Dey, M. M., Rabbani, A. G., & Sudhakaran, P. O. (2009). Technical efficiency of freshwater aquaculture and its determinants in Tripura, India. Agricultural Economic Research Review , 22, 185–195. https://doi.org/10.1080/13657300309380329
- Vincent, V., & Thomas, R. G. (1960). An agricultural survey of Southern Rhodesia: Part I: Agroecological survey. Government Printer.
- Yakubu, S. O., Falconer, L., & Telfer, T. C. (2022). Scenario analysis and land use change modelling reveal opportunities and challenges for sustainable expansion of aquaculture in Nigeria. Aquaculture Reports, 23, 101071. https://doi.org/10.1016/j.aqrep.2022.101071