
 ?Mathematical formulae have been encoded as MathML and are displayed in this HTML version using MathJax in order to improve their display. Uncheck the box to turn MathJax off. This feature requires Javascript. Click on a formula to zoom.
Abstract
Even though copious knowledge has been advanced in the extant literature on climate variability and change. Two schools of thought exist—one that views farmers’ perceptions of climate indicators as erroneous and inferior, while the other views, scientific data, specifically meteorological data, to be superior and accurate. The accuracy of farmers perception of climate variability indicators is in doubt relative to the scientific data. This article targets assessing farmers perception of climate variability indicators compared to the scientific data with an eye to distil policy implications for climate variability resilience and adaptation. Using cross-sectional data on 197 smallholder maize farmers in southern Ghana, the article answers the research question: To what extent do smallholder farmers perception of climate variability indicators align or vary from objective climate data? We find variation between farmers perception of climate indicators and the objective data from the Ghana Meteorological Agency. Specifically, while farmer perceptions showed a decrease in rainfall over the past 10 years (2009–2018), the objective data proved otherwise. Again, a contradiction existed between farmers perception of sunshine and the scientific data. However, farmers’ perceptions of temperature aligned with the objective data. The scientific data established coefficient of variations of 0.21, 0.04, 0.03, and 0.12 for rainfall, sunshine, maximum, and minimum temperatures respectively. We recommend collaborative efforts between the national research council’s, Ghana Meteorological Agency, and academic institutions to commission further studies that will test, confirm, and harmonize the reliability of smallholder perceptions of climate variability and change in climate adaptation efforts.
1. Introduction
This article interrogates smallholder farmers perception of climate variability factors, specifically rainfall, temperature, and sunshine, relative to the scientific data obtained from the Ghana Meteorological Agency (GMeT), which is considered objective data. We answer the research question: To what extent do smallholder farmers perception of climate variability indicators align or vary from the objective climate data? This is a question that demands recognition and action. Particularly predicated within a context where most smallholder farmers in the global south are rain-dependent and less sophisticated. Additionally, the adverse effects of climate variability and change are even more devastating within rural spaces rendering smallholder farmers in non-urban settings most vulnerable. This compound existing systemic challenges such as infrastructural deficits, endemic poverty, technological gaps, limited electricity access, limited economic opportunities, and the exodus to urban spaces.
Given the challenges posed by climate variabilities and change, scientific prediction, and modeling have come in handy in mitigating the effects. Thus, scientific prediction and modeling have taken center stage in the quest to minimize climate variability and change effects (Baig et al., Citation2021; Jourdan et al., Citation2021; Solaraju-Murali et al., Citation2022). Ayanlade et al. (Citation2017) indicated that climate variability and change impacts remain principally assessed through rigorous quantitative data and modeling. However, most farmers, given their peculiarities in rural spaces, do not readily obtain information on scientific weather prediction to guide their farming activities. They tend to rely heavily on their perception in predicting climate variables such as rainfall, temperature, and sunshine intensity. Especially in contexts where meteorological data remain limited and, in some instances, unavailable for the rural folks, farmers perception proves useful (Roco et al., Citation2015). Smallholders tend to rely on their indigenous knowledge in making such predictions, given their experience in farming. Indeed, Ankrah et al. (Citation2022) indicated that the indigenous knowledge base of farmers proved useful in climate prediction and hence should be harnessed with scientific data in climate prediction in their study in Ghana. Other studies (Ayanlade et al., Citation2017; Imran et al., Citation2020) cast doubt on the reliability and accuracy of farmer’s predictions and perceptions concerning climate variability and change prediction. For instance, Osbahr et al. (Citation2011) found a variation between farmers’ perceptions of decreases in rainfall with the scientific data in Uganda. Yaro (Citation2013) observed variation in farmer perception of decreased rainfall and the objective scientific data in southern Ghana.
The related literature (Ado et al., Citation2019; Le Dang et al., Citation2014) shows that farmers climate variability and change adaptation strategies are shaped by their perceptions and interpretation of climate variability and change. Imran et al. (Citation2020) and Hasan and Kumar (Citation2019) indicated that it is, therefore, essential to understand farmers’ perceptions for effective adaptation strategies. For instance, Imran et al. (Citation2020) indicated that farmers’ perceptions about increases in temperature aligned with objective data from the meteorological services in Pakistan. Le Dang et al. (Citation2014) also found consistency between farmers’ perceptions and scientific data. Krishna Bahadur et al. (Citation2020) argued for integration of scientific data with the subjective perception of farmers since a single reliance on subjective perception alone limits the reliability given the subjectivities and biases. However, climate variability and change scholarships that address such integration remain limited in SSA (Akponikpè, Gérard, et al., Citation2010; Ayanlade et al., Citation2017; Dakurah, Citation2021; De Longueville et al., Citation2020; Mcsweeney et al., Citation2010; Simelton et al., Citation2013; Yaro, Citation2013).
For instance, Gbetibouo (Citation2009) compared farmers’ perceptions of climate variables such as temperature and rainfall in South Africa and observed an alignment of farmers’ perceptions with the scientific data from the meteorological agency. Abid et al. (Citation2015) compared farmers’ perceptions with the objective data in Pakistan, while Mkonda et al. (Citation2018) undertook such a comparison in Tanzania. Osbahr et al. (Citation2011) found an alignment between farmers’ perceptions of temperature increase with the scientific data in Uganda. In the specific case of Ghana, Yaro (Citation2013) examined farmer perception of rainfall and temperature and found agreement in farmers’ perceptions and the objective scientific data in southern Ghana. Most studies do not examine sunshine in the climate variables, even though it remains an important variable for plant growth and productivity.
Most studies have heavily focused on the analysis of scientific historical data on climate variables, especially rainfall, and temperature (Addisu, Selassie, Fissha, & Gedif, Citation2015; Asare-Nuamah et al., Citation2019; MacKellar et al., Citation2014; Mengistu et al., Citation2014). Others (Ajuang et al., Citation2016; Lee et al., Citation2015; Mamba, Citation2016; Owusu et al., Citation2019; Roco et al., Citation2015) have focused solely on farmers subjective perceptions of climate variability and change. For instance, in Ghana, Limantol et al. (Citation2016) examined farmers’ subjective local perceptions of climate variability in the Vea catchment and observed reduced rainfall precipitation, intensity, and duration. Some scholarships (Dickinson et al., Citation2017; Kuivanen et al., Citation2016; Niles & Mueller, Citation2016; Simelton et al., Citation2013) in Ghana have advocated for the integration of local subjective perceptions and the scientific data in northern Ghana.
The general conclusion from the related literature shows mixed conclusions between farmers’ perceptions of climate variability variables and the scientific data. In particular, variations exist between the perception of temperature and rainfall relative to the scientific data. While some studies (Dhanya & Ramachandran, Citation2016; Gbetibouo, Citation2009; Mekonnen et al., Citation2018; Mertz et al., Citation2009; Yaro, Citation2013) found agreement, others (Ayal & Leal Filho, Citation2017; Le Dang et al., Citation2014; Fatuase & Ajibefun, Citation2013; Niles & Mueller, Citation2016; Osbahr et al., Citation2011; Simelton et al., Citation2013) showed variations. This article seeks to answer the research question: To what extent do farmers’ perceptions of climate variables i.e. rainfall, temperature, and sunshine align with the scientific data from the Ghana Meteorological Agency (GMeT) in a non-arid space? Specifically, the objective of the study is to determine the extent to which farmers perception of climate variables (sunshine, rainfall, temperature) align with the scientific data from GMeT.
This article makes two contributions to the farmers subjective perceptions of climate variability and scientific data nexus literature. First, in addition to rainfall and temperature variables which have been examined adequately (Abid et al., Citation2015; Akponikpè, Johnston, et al., Citation2010; Dadzie, Citation2021; Osbahr et al., Citation2011; Yaro, Citation2013), the third variable of sunshine intensity has been introduced into the conversation. Given that its merits discussion, but sunshine intensity has remained under-discussed in the climate variability discourses. Even though sunshine intensity remains vital in crop growth, performance, production, and consequently outputs. Generally, earlier studies confirmed smallholder farmers perception of the changes occurring in climate. And consequently, the efforts that they put in place to mitigate the negative effects (adaptation strategies). However, subjective perceptions may not necessarily reflect the reality; hence, climate trends may be misinterpreted, and not understood, characterized by variances between farmers perceptions and the scientific data leading to counter-productive climate adaptation strategies. It remains imperative to assess the alignment or otherwise of farmers perception and the objective data, given that it is valid starting point for scientific prediction (Ayanlade et al., Citation2017). And this study deepens our understanding in this light.
Finally, the article adds to the scant (Ayanlade et al., Citation2017; Dadzie, Citation2021; Hasan & Kumar, Citation2019, Citation2020; Imran et al., Citation2020) literature on farmers perception versus objective scientific data in the global south, particularly considering a non-arid space in southern Ghana. This remains important because most of the few (Amadou et al., Citation2015; Guodaar et al., Citation2021; Nyadzi, Citation2016) studies tend to focus more on northern Ghana, a space that experiences the extremes of the weather. There is, however, the need to bring into perspective the accounts from southern Ghana to nuance the conversation. Dadzie (Citation2021) appears to be the closest who attempted to examine farmers perception and the scientific data in the study area (Central Region) but missed out on the inclusion of sunshine intensity.
The rest of the article is structured as follows: the next section presents pertinent literature to the study. Section 3 presents the study’s methodology. Section 4 presents the results and discussions. The final section concludes and provides policy recommendation.
2. Extant literature
To start off, perception has been viewed as a complete image of a phenomenon in question, that constitutes the final part of the psychological process preceded by information gathering (sensory input) and ends with a subjective interpretation to the information gathered (Kalat, Citation2016; Steg et al., Citation2019). Bickerstaff (Citation2004) and Niemeyer et al. (Citation2005) viewed the perception of climate variability and change as a subjective evaluation that drives adaptation strategies. Climate variability and change perception is multidimensional and has remained extensively examined with regard to the impacts, causes, and adaptation (Alam et al., Citation2017; Haque et al., Citation2012; Kabir et al., Citation2016; Shameem et al., Citation2015; Uddin et al., Citation2014). Climate variability and change inflicts climate-related hazards (Howe,), that vary across geographical space and scale. It creates fond memories among farmers across space, time, and scale, the extremes, are most often remembered. Thus, climate variability and change perceptions are differentiated by spatial locations, demographic, and socio-economic characteristics (Ahmed et al., Citation2016; Haq & Ahmed, Citation2017; Hasan & Kumar, Citation2019; Shukla et al., Citation2019). For instance, the literature (Foguesatto et al., Citation2020; Kais & Islam, Citation2019) shows that experience, social relationships, location, and culture affect the interpretation of climate events and variables. Demographic characteristics (age, sex, education, family size), economic status (asset endowment, job), social networks, communication, and education affect farmer perceptions of climate variability and change (Henslin, Citation2017; Liu et al., Citation2014; Roco et al., Citation2015). The effect of farmers perception of climate variability and change is mediated by the channel of communication i.e. interpersonal communication and mass communication (Clayton et al., Citation2015; Imran et al., Citation2020).
Generally, two schools of thought exist in the related literature. First, the thought that rural smallholder farmers’ knowledge and opinions about climate variability and change, coupled with their adaptive strategies, are erroneous and subjective. The IPCC (Citation2014) report revealed that several scientists perceive farmers’ knowledge to be less rigorous and reliable to be used in evaluating planned adaptation. The literature (Abid et al., Citation2015; Li et al., Citation2013) shows that globally farmers adapt to climate variability and change based on their subjective perceptions. Farmers subjective perception of climate variability and change has been well documented (Ajuang et al., Citation2016; Lee et al., Citation2015; Mamba, Citation2016; Owusu et al., Citation2019; Roco et al., Citation2015). In particular, Crona et al. (Citation2013) compared perceptions of climate change across countries in Fiji, Ecuador, Australia, United Kingdom, New Zealand, and United States of America where they found convergence in climate variable (rainfall and temperature) among highly educated individuals.
The second school of thought, views science-based predictors (meteorological or objective data) as superior and accurate relative to farmers perception. For instance, Ayanlade et al. (Citation2017) argued that more focus had been paid to scientific prediction, including modeling of climate change systems, and the use of meteorological data for climate adaptation and risk assessment. Morton (Citation2017), indicated that even though the scientific data has been very useful for climate change prediction and adaptations, there is a need to integrate farmers local knowledge and perception. Indeed, Ankrah et al. (Citation2022) advocated for the integration of farmers indigenous knowledge into the scientific-based approaches towards climate mitigation in Ghana.
The evidence appears mixed. Specifically, farmers subjective perception of climate compared with the scientific data reveals that farmers correctly predicted increases in temperatures but wrongly perceived decreases in rainfall relative to the meteorological data (Akponikpè, Johnston, et al., Citation2010; Osbahr et al., Citation2011; Yaro, Citation2013). Alam et al. (Citation2018) showed that farmers subjective perception of extreme climate events aligned with the scientific evidence but varied from the long-term climate variations in terms of maintaining consistency of the measurement (Shameem et al., Citation2015). There was a consensus between farmers perception and the scientific data in Bangladesh where smallholder farmers perception of temperature increase, and a reduction in rainfall aligned (Alam et al., Citation2017; Haque et al., Citation2012; Hasan et al., Citation2018; Shameem et al., Citation2015). Ahsan and Brandt (Citation2015), also observed variations between farmers perception and the objective data in Bagerhat and Satkhira in Bangladesh. The literature generally appears mixed. Some literature (Dhanya & Ramachandran, Citation2016; Mekonnen et al., Citation2018) shows divergence, while others (Ayal & Leal Filho, Citation2017; Niles & Mueller, Citation2016; Simelton et al., Citation2013) show convergence between farmers’ perceptions and the objective data from meteorological agencies. Ayanlade et al. (Citation2017) argued that a gap exists in the analysis of climate variability and change impacts between farmers subjective opinions and awareness and the scientific data, justifying the need for further interrogation.
There has been a call for the integration of farmers subjective opinions into the science-based predictions in Africa (Ankrah et al., Citation2022; Heltberg et al., Citation2009; Mubiru et al., Citation2015; Tschakert et al., Citation2014; Van Griensven et al., Citation2016). Effective adaptation requires the right alignment of the integration of subjective perceptions and scientific data (Dickinson et al., Citation2017; Kuivanen et al., Citation2016; Niles & Mueller, Citation2016).
Generally, the related literature (Anyoha et al., Citation2013; Le Dang et al., Citation2014; Yaro, Citation2013) has adduced adequate evidence about farmers’ perceptions of climate change and the objective data based on indicators such as temperature and rainfall. In the case of Bangladesh, Hasan and Kumar (Citation2019) indicated that limited studies have compared farmers’ subjective perception of climate variables with the meteorological data. Few studies have attempted to add additional weather variables such as windstorms and sunlight intensity. For instance, the literature (Addisu et al., Citation2015; Asare-Nuamah et al., Citation2019; MacKellar et al., Citation2014; Mengistu et al., Citation2014) shows adequate focus on the scientific objective data taking into account rainfall and temperature. Sunshine intensity is deficient in the literature. Our study fills the gap in the literature by focusing on sunshine intensity to open up further empirical enquiries (Please see a summary of the related literature captured in ).
Table 1. Summary of related literature
3. Materials and methods
3.1. Research design
The study employed a cross-sectional survey covering 197 smallholder farmers through questionnaire administration. Cross-sectional survey enables quantitative analysis of trends, attitudes, knowledge, opinions, and the determination of relationships among variables of a population by studying a sample (Creswell & Creswell, Citation2017). A structured questionnaire enabled the researchers to find out the perceptions of maize farmers concerning climate variability indicators. Cross-sectional surveys allow a researcher to collect two types of information—descriptive information (perceptions of maize farmers), and relational information (effects of climate variability adaptation strategies on maize yields). The cross-sectional survey consisted of a section that captured the socio-demographic characteristics of respondents, perception of maize yield differential due to climate variability and change. This method also allowed the collection of a wide range of data from a sampled population and the generalization to the larger population from which the sample was drawn (Leavy, Citation2017).
3.2. Study area
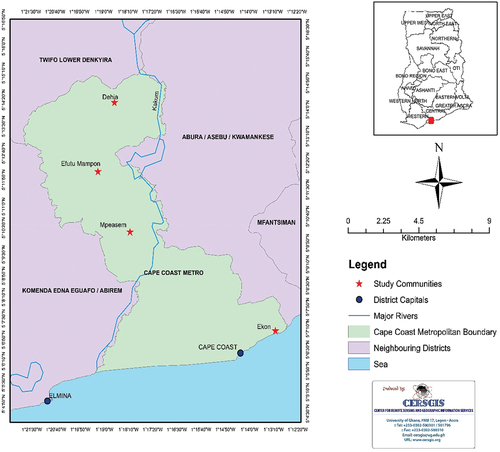
The study was conducted in the Cape Coast Metropolitan Assembly of Ghana (See study communities in Figure ). This is because data from the Statistics Research and Information Department (SRID) of the Ministry of Food and Agriculture (MoFA) indicated the Metropolitan to be one of the places in the Central Region where maize production has been low. GMeT also had data on maize yields from 2009 to 2018. Low yields in the Metropolitan Assembly, among others, could be attributed to climate variability, hence the need to examine farmers perception of the climate variables relative to the scientific data. Additionally, the Ghana Meteorological Agency (GMeT) had available data on all climate variables (temperature, rainfall, and sunshine) from 2009 to 2018, unlike other locations where data appeared scanty.
The Cape Coast Metropolis is the smallest in the country, with a total area of 122 square kilometers. Longitude 15 W and latitude
06 N are the coordinates for this location. It is bounded on the south by the Gulf of Guinea, West by Komenda Edina Eguafo or Abrem Municipality, East by the Abura Asebu Kwamankese District, and North by the Twifo Hemang Lower Denkyira District. The population of the Metropolis, according to the 2010 population and housing census, was 118,106, out of which 57,365 were males and 60,741 females. Farmers, fishermen and those in agricultural-related activities, form about 60% of the population (Ghana Statistical Service, Citation2010). Active agricultural population is approximately 28,000. Commercial farmers are approximately 0.3% and peasants (majority) approximately 99.7%. The metropolitan has about 8,000 Ha of available land for agriculture, out of which 3,500 Ha is currently under cultivation. This implies that higher production levels could be achieved for crops to meet both domestic and export markets.
Vegetation is mainly secondary forest with thickets and shrubs growing to an average height of 4.5 m. There is a coastline that is about 13 km long. Temperatures range from C to
C with a relative humidity of between 60% and 80%. There are two seasons of rainfall, with a peak in May to June and October. The annual rainfall ranges between 90 mm to 110 mm along the coast to between 110 mm to 160 mm in the hinterland. Dry periods (harmattan) are experienced between November and February (Ghana Statistical Service, Citation2010).
Figure 1. Map of cape coast metropolitan assembly showing study communities.source: centre for remote and geographic information services, 2021.
3.3. Study population
A study population, as defined by Babbie (Citation2020) as the theoretically specified aggregation of survey elements in a study area. The population of this study comprises all maize farmers in the Cape Coast Metropolis.
3.4. Sampling and sample size
The sample size refers to subsets of units or individuals from the population that has been selected for the study. Using Yamane (Citation1967) sample size determination formula, widely used by (Yaseen et al., Citation2018; Zulfiqar et al., Citation2017), the minimum sample size for the study was calculated as follows:
Where n is the sample size, N is the population size, and e is the level of precision. At the time of data collection, the population size was 28,000. Adopting a 95% confidence level, a degree of variability (p = 0.5) and a level of precision or sampling (e = 5%). The minimum required sample size was: =
=
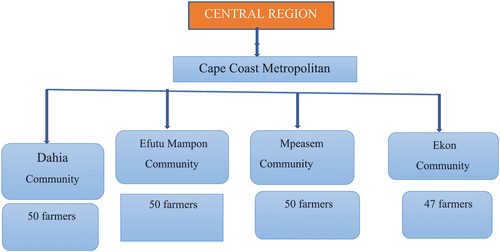
When this formula was applied, the sample size obtained was 394 farmers, but given the onset of Covid-19, it was challenging to get all the farmers to interview based on the fear of contracting the virus even though the safety protocols were followed. Given that the research was time-bound, time constraints did not allow the research to travel beyond certain months. Eventually, the authors, in consultation with the Agricultural Extension Agents (AEAs) as well as time constraints, eventually, the authors in consultation with the Agricultural Extension Agents (AEAs) agreed to sample half of the sample proportionate to the number of farmers in the community. Ekon had the lowest number of farmers, hence, 47 farmers were randomly selected from the community. Eventually, a final sample size of 197 farmers was obtained.
Simple random sampling is a method that gives everyone in the target population an equal chance of being selected (Creswell & Creswell, Citation2017). The simple random sampling was used to select respondents because of its representativeness and reduction in biases. A list of farmers was obtained from the Department of Agriculture (DoA), and farmers were randomly selected using the Stata 14.2 software to select 197 proportionate to the total number of farmers in the study communities. Figure below represents the communities and the number of farmers. 50 farmers from each community were selected, but three failed to turn up in one community (Ekon), therefore bringing the total number of respondents to 197.
Figure 2. Sampling framework.
3.5. Development of data collection instrument
A data collection instrument was developed by taking into consideration the research objective. The objective was to assess farmers perception of climate variables (rainfall, temperature and sunshine) in comparison with the scientific data from GMeT. Specific questions on To what extent do you agree that temperature increased over the past 10 years? 5 = Strongly agree, 4 = Agree, 3 = Neutral, 2 = Disagree, 1 = Strongly disagree, How has temperature impacted your maize yield over the past 10 years. 1 =Increased, 2 =decreased, 3 = No changes, To what extent do you agree that rainfall increased over the past 10 years? 5 = Strongly agree, 4 = Agree, 3 = Neutral, 2 = Disagree, 1 = Strongly disagree, How has rainfall impacted on your yield over the past 10 years. 1 =Increased, 2 =decreased, 3 = No changes, Has sunshine increased over the past 10 years? 5 =Strongly agree, 4 = Agree, 3 = Neutral, 2 = Disagree 1 = Strongly disagree, To what extent do you agree that sunshine impacted on your yield over the past 10 years. 1 =Increased, 2 =decreased, 3 = No changes, What was the average quantity of fertilizer applied per year for the past 10 years bags, Was there any loss in the value of yields as a result of climate variability?, and What is the quantity of maize produced bags. The first instrument was a structured questionnaire with closed and open-ended questions to collect primary data from correspondents on their perception of climate variables i.e. rainfall, temperature and sunshine intensity. Secondary data on rainfall, sunshine, and temperature were obtained from the Ghana Meteorological Agency (GMeT) covering 2009 to 2018. The data collection instrument was pre-tested for the validity and reliability. Kumar (Citation2018) views validity as a concept of appropriateness and accuracy that is applied to a research process and is concerned with the accuracy of the measurement. The questionnaire was pre-tested at the Agona West Municipality in the Central Region. The preliminary interview started with the administration of questionnaires to 20 farmers. The information obtained through this informal consultative process led to changes that refined the final questionnaire. The pre-test did not influence the subsequent survey results but helped identify weaknesses, and ambiguities in the questionnaire. The reference period for the questionnaire was the past ten (10) years i.e. 2009–2018.
3.6. Data collection
Secondary data on rainfall, sunshine, and temperature covering 2009 to 2018 was obtained from the GMet. The GMeT uses synoptic stations/data, satellite, radar, numerical weather prediction (NWP) models with a full range of meteorological instruments and equipment, operated 24 hours a day covering over 350 stations. Climate data is picked in real time and compiled on a daily basis through computer-assisted software’s. There are applications that support the 350 stations to measure temperature, wind, precipitation, sunshine intensity, evaporation, humidity, air temperature, and clouds. Based on a formal request to GMeT, relevant climate information pertaining on the Cape Coast Municipal Assembly was given to the researchers. Primary data covering farmers started in June, 2021 and ended in August, 2021. The administration of questionnaires were through face-to-face interview of respondents, and the participants were contacted early to reduce non-responses. The researchers ensured conformity to the necessary Covid-19 protocols such as wearing of masks, social distancing, washing hands, and using hand sanitizers. Few participants who were difficult to reach were interviewed through telephone calls, and the data collection ended in July, 2021.
3.7. Data analysis and processing
Data collected were analyzed using Stata 14.2. To describe the trends of climate variability indicators and maize farmers perception from 2009 to 2018 in the Cape Coast Metropolis, a linear trend model was employed. We recognized that recall of data over a long period of time could be challenging for farmers as argued by Ankrah, Agyei-Holmes, et al. (Citation2021) . The researchers however, made a conscious effort using key events, and milestones in the past to help farmers recall changes in climate variables over time. The trend of climate variability factors such as rainfall, sunshine, minimum, and maximum temperature was compared to farmers subjective perceptions covering a 10-year period (2009–2018) in the Cape Coast Metropolis. Additionally, the descriptive statistics of these time series data were presented in a tabular form. That is, the minimum, maximum, mean, standard deviation, and coefficient of variations of each climate factor and maize yield were tabulated. The literature is dominated by several predictive models for analyzing climate variability. However, following Kyei-Mensah et al. (Citation2019) and Omoyo et al. (Citation2015), we utilized the coefficient of variation model to determine the variabilities in the climate indicators. The coefficient of variation remained critical because it measures the variability of the data or how dispersed the distribution of the data is from or around the mean. The higher the value of the coefficient of variation (CV), the higher the variability of the data. Similar models such as precipitation concentration index (PCI) model, only focus on the seasonal analysis of rainfall variability.
Coefficient of variation is specified as:
. Where xi is the climate variability indicators (rainfall, temperature, and sunshine), μ is the mean, and σ is the standard deviation of each climate variability indicator.
4. Results and discussions
4.1. Socioeconomic characteristics of the respondents
This section presents the socioeconomic characteristics of the respondents. The socioeconomic variables such as sex, age, marital status, level of education, income, religious affiliation, farm size, and experience were captured during the data collection. These socioeconomic characteristics are required to understand and contextualize the objectives of the study (see Table ).
Table 2. Farmers demographic characteristics
Table presents the distribution of the sex of the respondents. The result shows that the majority (85%) of the respondents are males. Men are predominantly engaged in agricultural activities than women in the Cape Coast Metropolis. This trend observed is supported by the Ghana Statistical Service (Citation2020) report that shows male dominance in agricultural activities.The result indicates that the majority (66%) are married. Only (19%) are single, with 7% divorced. Also, about 8% of the respondents lost their spouses, hence widowed. The levels of education of respondents were categorized into six levels: no formal education, basic education (primary and JHS), Secondary/senior high school, and Tertiary education level. Sixty-seven percent of the respondents had no formal education. For those who had formal education, the highest level was a basic school (21%), followed by secondary school education (5%). The proportion of respondents who had tertiary and technical/vocational education were 4%, and 3%, respectively.
4.2. Continuous variables summary statistics
Table presents other smallholder farmers socioeconomic characteristics such as income, farm experience, farm size, and maize yield. The result (Table ) shows the average income of a maize farmer to be GH¢ 2,693 (US$ 456).Footnote1 The minimum and maximum income of the farmers were GH¢ 960.00 (US$163) and GH¢ 8400.00 (US$ 1424), respectively. The average farming experience was estimated to be approximately 13 years, with an average farm size is about 1.08 hectares, with the minimum farm size being 0.4 hectares. The mean maize yield of the respondents was about 1.12 tonnes.
Table 3. Summary statistics of continuous variables
4.3. Trend analysis of climate variability indicators and perception of maize from 2009-2018
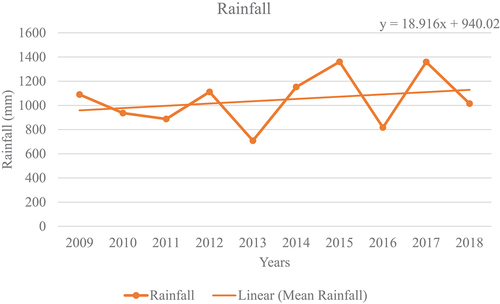
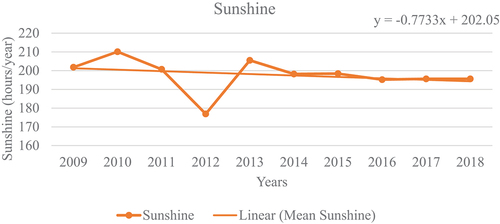
We first analyze the trend of climate variability indicators by computing the summary statistics. The results (Table ) revealed that the average annual rainfall in the Cape Coast Metropolis is about 1044.06 mm. The minimum and maximum annual rainfall are about 817.40 mm and 1360.80 mm respectively. The coefficient variation value showed about 21% rainfall variability within the reference period (2009–2018). Indeed, rainfall remained variable, but Fig 7 shows a small proportion (0.5%) of farmers using only irrigation in their agricultural activities. Irrigation can serve as a risk mitigation measure, but few farmers resort to it due to the high cost. Ankrah, Kwapong, et al. (Citation2021) also showed that even though agricultural insurance is a useful risk mitigation measure, insurance penetration remains low among smallholder farmers. The average sunshine is about 197.80 hours per year, and the least and highest sunshine is around 176.90 and 210.10 hours per year. The sunshine coefficient variation (4%) signifies slight variation in sunshine over the past ten years. The mean maximum temperature is about 30°C, while the mean minimum temperature is about 22°C. For the least and highest temperature, the maximum temperature recorded was about 28°C and 31°C, respectively, while that of the minimum temperature was 18°C and 26°C, respectively. The temperature coefficient of variations indicates appreciable variations in the minimum temperature (12%) than the maximum temperature (3%).
Table 4. Summary statistics of climate variables
4.4. Rainfall trend analysis (2009-2018)
Figure depicts an oscillating annual rainfall trend in the Cape Coast metropolis. There was a steady decline in rainfall from 2009, followed by a steady rise in 2011. However, there was a sharp decline in annual rainfall in 2013, before a steady rise, with the highest rainfall recorded in 2015. Afterward, there was a sharp decline in rainfall in 2016, and thereafter, there were oscillations. The graphical illustrations in figure 8 show that rainfall experienced many variations within the period under consideration (2009–2018). Again, the coefficient of variation shows the degree of rainfall variability in the Cape Coast Metropolis from 2009 to 2018. It could be observed from the trend equation that rainfall increased marginally and also depicted a positive trend. The result is consistent with Kyei-Mensah et al. (Citation2019), who analyzed rainfall trends and found a significant variation and positive rainfall trend in the Fanteakwa District. Johnson (Citation2020) also found an upward decadal trend of rainfall in Winneba.
Figure 3. Rainfall trend in the cape coast metropolis (2009–2018). Source: Ghana meteorological agency (GMeT), 2021.
4.5. Sunshine trend analysis (2009-2018)
shows that from 2009, there was a marginal increase in sunshine in 2010, followed by a sharp decline in 2012, i.e. the least sunshine, of 176.90 hours per year, was recorded in 2012. Sunshine increased sharply in 2013 and declined again in 2014. Since 2015, sunshine remained fairly stable. However, the trend equation shows a negative trend of sunshine in the Metropolis. This trend and the coefficient variation of sunshine is evident that sunshine experienced less variability over the period under consideration. The downward trend of sunshine could impact farming activities that require sunshine. An example includes drying food crops such as cereals, cash crops, and the tasseling of maize. Few studies examine sunshine intensity, and this article attempts to fill the void and open further conversations.
Figure 4. Sunshine trend in the cape coast metropolis (2009–2018). Source: Ghana meteorological agency (GMeT), 2021.
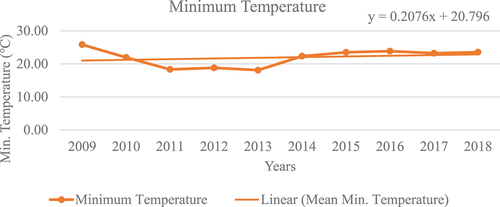
4.6. Minimum temperature trend analysis (2009-2018)
From Figure , it is evident that minimum temperature witnessed some variations but with a small degree of variability. There was a steady decline in minimum temperature from 2009 to 2011, it stabilized until 2014, when the minimum temperature increased. The increase in minimum temperature from 2014 did not go beyond the 2009 value. This shows that the minimum temperature under the reference period decreased marginally with less degree of variation. The trend equation further indicates a positive trend of minimum temperature in the Cape Coast Metropolis. Similarly, Guodaar (Citation2015) found a positive minimum temperature trend in the Offinso North District of the Ashanti Region. This shows that temperature kept rising at an increasing rate due to climate variability and change.
Figure 5. Minimum temperature trend in the Cape Coast Metropolis (2009–2018). Source: Ghana Meteorological Agency (GMeT), 2021.
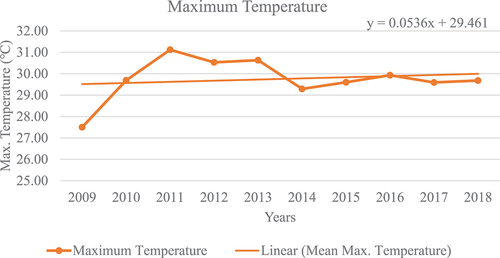
4.6.1. Maximum temperature trend analysis (2009-2018)
Unlike the minimum temperature, where there was an initial decline, maximum temperature begun with an initial increase. The maximum temperature went up from 2009 to 2011, before witnessing decline. The highest maximum temperature was recorded in 2011, with a temperature of about 31°C. From 2014, the maximum temperature in the Cape Coast Metropolis started rising, but with a marginal increase. Similar to the minimum temperature, the Cape Coast Metropolis experienced less maximum temperature variability within the reference period (2009–2018). The trend equation shows a positive trend of maximum temperature. The annual maximum temperature in the Metropolis is expected to increase marginally by about 5%, all things being equal. The result is similar to Guodaar (Citation2015), who found a positive maximum temperature trend in the Offinso North District of the Ashanti Region. In the Central Region of Ghana, Johnson (Citation2020) found a similar trend in temperature in the capital town of Effutu Municipal (Winneba).
Figure 6. Maximum temperature trend in the Cape Coast Metropolis (2009–2018). Source: Ghana Meteorological Agency (GMeT), 2021.
4.7. Farmers perception of climate variability indicators
Farmers’ perception of the climate variability indicators was ascertained for alignment or variation with the scientific data from GMeT for the reference period (2009–2018). The results from Table below show that majority of the farmers disagreed that rainfall increased over the past ten years. Indeed, the extant literature (Fatuase & Ajibefun, Citation2013; Osbahr et al., Citation2011; Tambo & Abdoulaye, Citation2013; Yaro, Citation2013) generally indicates smallholder farmers widely perceived view of reduced rainfall over three decades. Table , however, shows that the rainfall perception by farmers was contrary to the rainfall trend of the scientific data depicted in Figure . Even though there were declines and oscillations, rainfall increased marginally over the years. Farmers might have perceived the marginal increase to indicate no increase over time. The reason for the difference could be attributed to changes in rainfall patterns. Farmers may assume that rainfall decreases when rainfall is delayed in the cropping season. This finding is consistent with Osbahr et al. (Citation2011), which showed farmers perceived decreases in rainfall, while the scientific data showed no regular pattern in Uganda. Yaro (Citation2013) also observed this disagreement between farmers’ perceptions and the scientific data in southern Ghana.
Table 5. Smallholder farmers perception of climate variables
Table shows that most (79%) farmers agreed that there had been increases in temperature over the past 10 years. Farmers perception of temperature increases was consistent with the positive trend of both the minimum and maximum temperatures recorded by the scientific data (See Fig ). Generally, there had not been consistent increases in the maximum temperature, the increase fluctuated, and where increases were recorded, they appeared marginal. Southern Ghana does not typically experience extreme climatic conditions relative to northern Ghana. The comparative analysis indicates that farmer perceptions even though remain subjective are credible and can be helpful in climate variability adaptation strategies. It will therefore be useful if continuous efforts are made to validate farmers’ perceptions of temperature over time to build resilient adaptations that are readily available to the farmer. Indeed, Osbahr et al. (Citation2011) observed farmers’ perceptions of increases in temperature as consistent with the increases recorded by scientific data in Uganda. Yaro (Citation2013) indicated consistency between farmers’ perceptions of temperature increases with the objective data from the GMeT. Gbetibouo (Citation2009) observed the same finding regarding farmers’ perceptions of increases in temperature with the scientific data in South Africa.
Most (89%) smallholder farmers agreed that sunshine increased over the past ten years. This perception, however, was at variance with the scientific data, which showed a decline. This has implications for agricultural activities that are conditioned on increased sunshine. For instance, the tasseling and drying of grains. A false perception of consistent increases in sunshine when indeed, there are rather decreases can affect adaptation strategies. Few studies have, however, examined this pathway of examining the consistency of farmers’ views on sunshine with the scientific data. This finding seeks to bridge such gaps and stimulate further interest in more empirical findings to deepen understanding. To the best of our knowledge, this study appears to be among the few that focus on sunlight in the climate variables. We note, however, that variabilities exist in the climate even in the same geographic space, hence the need to further understand how farmer perceptions vary across different spatial locations and even the same location in informing climate variability adaptation strategies.
5. Conclusion and policy recommendations
This article examined smallholder farmers’ perceptions of climate variability factors such as rainfall, temperature, and sunshine relative to scientific data obtained from the meteorological services, which are considered objective data. The findings showed variation between farmers’ perceptions of climate indicators and the scientific data from the Ghana Meteorological Agency (GMeT). Specifically, while farmers perception showed a decrease in rainfall over the past 10 years (2009–2018), the scientific data showed increases. The scientific data showed that rainfall experienced many variations within the period under consideration (2009–2018), and the trend equation revealed marginal increases in rainfall with a positive trend. Rainfall showed higher variations with a coefficient of variation of 21%. Minimum temperature witnessed some variations but with a small degree (0.12) of variability. The trend equation further indicated a positive trend of minimum temperature. Similar to the minimum temperature less (0.03) maximum temperature variability within the reference period (2009–2018). The trend equation shows a positive trend of maximum temperature. Most of the smallholder farmers’ perceptions of sunshine was inconsistent with the scientific data. Whilst most farmers agreed that sunshine increased over the past ten years, the scientific data declined. The scientific data showed minimal (0.04) variability over the period.
The Ghana Meteorological Agency is encouraged to explore innovative ways of providing farmers with timely and accurate data on climate variables through daily weather forecast information to guide farmers in their decision-making in minimizing the adverse effects of climate variability. We suggest that farmers’ perceptions should not be relegated to the background but integrated into the scientific(objective) data for climate forecasting.
6. Limitation of study
The study did not statistically analyze the perceptions of the farmers relative to the objective data but only used farmers subjective perceptions.
Supplemental Material
Download Zip (481.4 KB)Acknowledgements
We acknowledge Mr. Emmanuel Oduro Okata for his assistance in the analysis of the data.
Disclosure statement
No potential conflict of interest was reported by the author(s).
Supplementary material
Supplemental data for this article can be accessed online at https://doi.org/10.1080/23311932.2022.2148323
Notes
1. 1US$ to an average exchange rate of GHC 5.9 in 2021.
References
- Abid, M., Scheffran, J., Schneider, U. A., & Ashfaq, M. (2015). Farmers’ perceptions of and adaptation strategies to climate change and their determinants: The case of Punjab province, Pakistan. Earth System Dynamics, 6(1), 225–19. https://doi.org/10.5194/esd-6-225-2015
- Addisu, S., Selassie, Y. G., Fissha, G., & Gedif, B. (2015). Time series trend analysis of temperature and rainfall in lake Tana Sub-basin, Ethiopia. Environmental Systems Research, 4(1), 1–12. https://doi.org/10.1186/s40068-015-0051-0
- Ado, A. M., Leshan, J., Savadogo, P., Bo, L., & Shah, A. A. (2019). Farmers’ awareness and perception of climate change impacts: Case study of aguie district in Niger. Environment, Development and Sustainability, 21(6), 2963–2977. https://doi.org/10.1007/s10668-018-0173-4
- Ahmed, A., Lawson, E. T., Mensah, A., Gordon, C., & Padgham, J. (2016). Adaptation to climate change or non-climatic stressors in semi-arid regions? Evidence of gender differentiation in three agrarian districts of Ghana. Environmental Development, 20, 45–58. https://doi.org/10.1016/j.envdev.2016.08.002
- Ahsan, D., & Brandt, U. S. (2015). Climate change and coastal aquaculture farmers’ risk perceptions: Experiences from Bangladesh and Denmark. Journal of Environmental Planning and Management, 58(9), 1649–1665. https://doi.org/10.1080/09640568.2014.942414
- Ajuang, C. O., Abuom, P. O., Bosire, E. K., Dida, G. O., & Anyona, D. N. (2016). Determinants of climate change awareness level in upper Nyakach Division, Kisumu County, Kenya. SpringerPlus, 5(1), 1–20. https://doi.org/10.1186/s40064-016-2699-y
- Akponikpè, P. I., Gérard, B., Michels, K., & Bielders, C. (2010). Use of the APSIM model in long term simulation to support decision making regarding nitrogen management for pearl millet in the Sahel. European Journal of Agronomy, 32(2), 144–154. https://doi.org/10.1016/j.eja.2009.09.005
- Akponikpè, P. I., Johnston, P., & Agbossou, E. K. (2010). Farmers’ perception of climate change and adaptation strategies in Sub-Saharan West-Africa. Paper presented at the 2nd International Conference: Climate, Sustainability and Development in Semi-arid Regions. Fortaleza - Ceará, Brazil, held from August 16 - 20, 2010.
- Alam, G. M., Alam, K., & Mushtaq, S. (2017). Climate change perceptions and local adaptation strategies of hazard-prone rural households in Bangladesh. Climate Risk Management, 17, 52–63. https://doi.org/10.1016/j.crm.2017.06.006
- Alam, G. M., Alam, K., Mushtaq, S., & Leal Filho, W. (2018). How do climate change and associated hazards impact on the resilience of riparian rural communities in Bangladesh? Policy implications for livelihood development. Environmental Science & Policy, 84, 7–18. https://doi.org/10.1016/j.envsci.2018.02.012
- Amadou, M., Villamor, G., Attua, E., & Traoré, S. (2015). Comparing farmers’ perception of climate change and variability with historical climate data in the upper east region of Ghana. Ghana Journal of Geography, 7(1), 47–74. https://www.ajol.info/index.php/gjg/article/view/126290
- Ankrah, D. A., Agyei-Holmes, A., & Boakye, A. A. (2021). Participatory farm budgeting–A case of pineapple farmers in Ghana. African Geographical Review, 1–15. https://doi.org/10.1080/19376812.2021.1958691
- Ankrah, D. A., Kwapong, N. A., & Boateng, S. D. (2022). Indigenous knowledge and science-based predictors reliability and its implication for climate adaptation in Ghana. African Journal of Science, Technology, Innovation and Development, 1–13. https://doi.org/10.1080/20421338.2021.1923394
- Ankrah, D. A., Kwapong, N. A., Eghan, D., Adarkwah, F., & Boateng-Gyambiby, D. (2021). Agricultural insurance access and acceptability: Examining the case of smallholder farmers in Ghana. Agriculture & Food Security, 10(1), 1–14. https://doi.org/10.1186/s40066-021-00292-y
- Anyoha, N., Nnadi, F., Chikaire, J., Echetama, J., Utazi, C., & Ihenacho, R. (2013). Socio-economic factors influencing climate change adaptation among crop farmers in Umuahia South Area of Abia State, Nigeria. Net Journal of Agricultural Science, 1(2), 42–47. https://netjournals.org/pdf/NJAS/2013/2/13-019.pdf
- Asare-Nuamah, P., Botchway, E., & Onumah, J. A. (2019). Helping the helpless: Contribution of rural extension services to smallholder farmers’ climate change adaptive capacity and adaptation in rural Ghana. International Journal of Rural Management, 15(2), 244–268. https://doi.org/10.1177/0973005219876211
- Ayal, D. Y., & Leal Filho, W. (2017). Farmers’ perceptions of climate variability and its adverse impacts on crop and livestock production in Ethiopia. Journal of Arid Environments, 140, 20–28. https://doi.org/10.1016/j.jaridenv.2017.01.007
- Ayanlade, A., Radeny, M., & Morton, J. F. (2017). Comparing smallholder farmers’ perception of climate change with meteorological data: A case study from southwestern Nigeria. Weather and Climate Extremes, 15, 24–33. https://doi.org/10.1016/j.wace.2016.12.001
- Babbie, E. R. (2020). The practice of social research. Cengage learning.
- Baig, M. A., Zaman, Q., Baig, S. A., Qasim, M., Khalil, U., Khan, S. A., Ismail, M., Muhammad, S., & Ali, S. (2021). Regression analysis of hydro-meteorological variables for climate change prediction: A case study of chitral basin, Hindukush region. Science of the Total Environment, 793, 148595. https://doi.org/10.1016/j.scitotenv.2021.148595
- Bickerstaff, K. (2004). Risk perception research: Socio-cultural perspectives on the public experience of air pollution. Environment International, 30(6), 827–840. https://doi.org/10.1016/j.envint.2003.12.001
- Clayton, S., Devine-Wright, P., Stern, P. C., Whitmarsh, L., Carrico, A., Steg, L., Swim, J., & Bonnes, M. (2015). Psychological research and global climate change. Nature Climate Change, 5(7), 640–646. https://doi.org/10.1038/nclimate2622
- Creswell, J. W., & Creswell, J. D. (2017). Research design: Qualitative, quantitative, and mixed methods approaches. Sage publications.
- Crona, B., Wutich, A., Brewis, A., & Gartin, M. (2013). Perceptions of climate change: Linking local and global perceptions through a cultural knowledge approach. Climatic Change, 119(2), 519–531. https://doi.org/10.1007/s10584-013-0708-5
- Dadzie, S. K. N. (2021). FARMERS’PERCEPTION OF CLIMATE CHANGE COMPARED WITH OBJECTIVE DATA: EVIDENCE FROM THE CENTRAL REGION OF GHANA. Climate Change Economics, 12(1), 2050015. https://doi.org/10.1142/S2010007820500153
- Dakurah, G. (2021). How do farmers’ perceptions of climate variability and change match or and mismatch climatic data? Evidence from North-west Ghana. GeoJournal, 86(5), 2387–2406. https://doi.org/10.1007/s10708-020-10194-4
- De Longueville, F., Ozer, P., Gemenne, F., Henry, S., Mertz, O., & Nielsen, J. Ø. (2020). Comparing climate change perceptions and meteorological data in rural West Africa to improve the understanding of household decisions to migrate. Climatic Change, 160(1), 123–141. https://doi.org/10.1007/s10584-020-02704-7
- Dhanya, P., & Ramachandran, A. (2016). Farmers‘ perceptions of climate change and the proposed agriculture adaptation strategies in a semi arid region of south India. Journal of Integrative Environmental Sciences, 13(1), 1–18. https://doi.org/10.1080/1943815X.2015.1062031
- Dickinson, K. L., Monaghan, A. J., Rivera, I. J., Hu, L., Kanyomse, E., Alirigia, R., Adoctor, J., Kaspar, R. E., Oduro, A. R., & Wiedinmyer, C. (2017). Changing weather and climate in Northern Ghana: Comparison of local perceptions with meteorological and land cover data. Regional Environmental Change, 17(3), 915–928. https://doi.org/10.1007/s10113-016-1082-4
- Fatuase, A., & Ajibefun, A. (2013). Adaptation to climate change: A case study of rural farming households in Ekiti state, Nigeria. Impacts World 2013. Paper presented at the International Conference on Climate change Effects, Potsdam.
- Foguesatto, C. R., Artuzo, F. D., Talamini, E., & Machado, J. A. D. (2020). Understanding the divergences between farmer’s perception and meteorological records regarding climate change: A review. Environment, Development and Sustainability, 22(1), 1–16. https://doi.org/10.1007/s10668-018-0193-0
- Gbetibouo, G. A. (2009). Understanding farmers’ perceptions and adaptations to climate change and variability: The case of the Limpopo Basin, South Africa (Vol. 849). Intl Food Policy Res Inst.
- Ghana Statistical Service. (2010). 2010 Population and Housing Census. Ghana Statistical Service (GSS).
- Ghana Statistical Service. (2020). Ghana Census of Agriculture-National Report. https://ejournal.poltektegal.ac.id/index.php/siklus/article/view/298%0Ahttp://repositorio.unan.edu.ni/2986/1/5624.pdf%0Ahttp://dx.doi.org/10.1016/j.jana.2015.10.005%0Ahttp://www.biomedcentral.com/1471-2458/12/58%0Ahttp://ovidsp.ovid.com/ovidweb.cgi?T=JS&PAGE=refe
- Guodaar, L. (2015). Effects of climate variability on tomato crop production in the Offinso North District of Ashanti region. Kwame Nkrumah University of Science and Technology.
- Guodaar, L., Bardsley, D. K., & Suh, J. (2021). Integrating local perceptions with scientific evidence to understand climate change variability in northern Ghana: A mixed-methods approach. Applied Geography, 130, 102440. https://doi.org/10.1016/j.apgeog.2021.102440
- Haq, S. M., & Ahmed, K. J. (2017). Does the perception of climate change vary with the socio-demographic dimensions? A study on vulnerable populations in Bangladesh. Natural Hazards, 85(3), 1759–1785. https://doi.org/10.1007/s11069-016-2664-7
- Haque, M. A., Yamamoto, S. S., Malik, A. A., & Sauerborn, R. (2012). Households’ perception of climate change and human health risks: A community perspective. Environmental Health, 11(1), 1–12. https://doi.org/10.1186/1476-069X-11-1
- Hasan, M. K., Desiere, S., D’Haese, M., & Kumar, L. (2018). Impact of climate-smart agriculture adoption on the food security of coastal farmers in Bangladesh. Food Security, 10(4), 1073–1088. https://doi.org/10.1007/s12571-018-0824-1
- Hasan, M. K., & Kumar, L. (2019). Comparison between meteorological data and farmer perceptions of climate change and vulnerability in relation to adaptation. Journal of Environmental Management, 237, 54–62. https://doi.org/10.1016/j.jenvman.2019.02.028
- Hasan, M. K., & Kumar, L. (2020). Meteorological data and farmers’ perception of coastal climate in Bangladesh. Science of the Total Environment, 704, 135384. https://doi.org/10.1016/j.scitotenv.2019.135384
- Heltberg, R., Siegel, P. B., & Jorgensen, S. L. (2009). Addressing human vulnerability to climate change: Toward a ‘no-regrets’ approach. Global Environmental Change, 19(1), 89–99. https://doi.org/10.1016/j.gloenvcha.2008.11.003
- Henslin, J. M. (2017). Sociology: A Down-to-Earth Approach. Pearson Education.
- Imran, M., Shrestha, R. P., & Datta, A. (2020). Comparing farmers’ perceptions of climate change with meteorological data in three irrigated cropping zones of Punjab, Pakistan. Environment, Development and Sustainability, 22(3), 2121–2140. https://doi.org/10.1007/s10668-018-0280-2
- IPCC. (2014). Contribution of working groups I, II and III to the fifth assessment report. intergovernmental panel on climate chang.
- Johnson, A. (2020). Assessing the impacts of climate change of coastal Winneba-Ghana. https://repositorio-aberto.up.pt/bitstream/10216/127986/2/410090.pdf
- Jourdan, M., François, C., Delpierre, N., St-Paul, N. M., & Dufrêne, E. (2021). Reliable predictions of forest ecosystem functioning require flawless climate forcings. Agricultural and Forest Meteorology, 311, 108703. https://doi.org/10.1016/j.agrformet.2021.108703
- Kabir, M. I., Rahman, M. B., Smith, W., Lusha, M. A. F., Azim, S., & Milton, A. H. (2016). Knowledge and perception about climate change and human health: Findings from a baseline survey among vulnerable communities in Bangladesh. BMC Public Health, 16(1), 1–10. https://doi.org/10.1186/s12889-016-2930-3
- Kais, S. M., & Islam, M. S. (2019). Perception of climate change in shrimp-farming communities in Bangladesh: A critical assessment. International Journal of Environmental Research and Public Health, 16(4), 672. https://doi.org/10.3390/ijerph16040672
- Kalat, J. W. (2016). Introduction to psychology. Cengage Learning.
- Krishna Bahadur, K., Elliott, V., Seng, R., Pomeroy, R. S., Schenkels, J., & Fraser, E. D. (2020). Evaluating community fishery management using Fishers‘ perceptions in the Tonle Sap lake of Cambodia. Environmental Development, 33, 100503. https://doi.org/10.1016/j.envdev.2020.100503
- Kuivanen, K., Michalscheck, M., Descheemaeker, K., Adjei-Nsiah, S., Mellon-Bedi, S., Groot, J. C., & Alvarez, S. (2016). A comparison of statistical and participatory clustering of smallholder farming systems–A case study in Northern Ghana. Journal of Rural Studies, 45, 184–198. https://doi.org/10.1016/j.jrurstud.2016.03.015
- Kumar, R. (2018). Research methodology: A step-by-step guide for beginners. Sage.
- Kwapong N Afranaa, Ankrah D Adu, Anaglo J Nicholas and Vukey E Yao. (2021). Determinants of scale of farm operation in the eastern region of Ghana. Agric & Food Secur, 10(1), 10.1186/s40066-021-00309-6
- Kyei-Mensah, C., Kyerematen, R., & Adu-Acheampong, S. (2019). Impact of rainfall variability on crop production within the worobong ecological area of fanteakwa district, Ghana. Advances in Agriculture, 2019, 1–7. https://doi.org/10.1155/2019/7930127
- Leavy, P. (2017). Research design: Quantitative, qualitative, mixed methods, arts-based, and community-based participatory research approaches. Guilford Publications.
- Le Dang, H., Li, E., Bruwer, J., & Nuberg, I. (2014). Farmers’ perceptions of climate variability and barriers to adaptation: Lessons learned from an exploratory study in Vietnam. Mitigation and Adaptation Strategies for Global Change, 19(5), 531–548. https://doi.org/10.1007/s11027-012-9447-6
- Lee, T. M., Markowitz, E. M., Howe, P. D., Ko, C.-Y., & Leiserowitz, A. A. (2015). Predictors of public climate change awareness and risk perception around the world. Nature Climate Change, 5(11), 1014–1020. https://doi.org/10.1038/nclimate2728
- Limantol, A. M., Keith, B. E., Azabre, B. A., & Lennartz, B. (2016). Farmers’ perception and adaptation practice to climate variability and change: A case study of the Vea catchment in Ghana. SpringerPlus, 5(1), 1–38. https://doi.org/10.1186/s40064-016-2433-9
- Li, C., Tang, Y., Luo, H., Di, B., & Zhang, L. (2013). Local farmers’ perceptions of climate change and local adaptive strategies: A case study from the middle yarlung zangbo river valley, Tibet, China. Environmental Management, 52(4), 894–906. https://doi.org/10.1007/s00267-013-0139-0
- Liu, Z., Smith, W. J., & Safi, A. S. (2014). Rancher and farmer perceptions of climate change in Nevada, USA. Climatic Change, 122(1), 313–327. https://doi.org/10.1007/s10584-013-0979-x
- MacKellar, N., New, M., & Jack, C. (2014). Observed and modelled trends in rainfall and temperature for South Africa: 1960-2010. South African Journal of Science, 110(7–8), 1–13. https://doi.org/10.1590/sajs.2014/20130353
- Mamba, S. F. (2016). Factors influencing perception of climate variability and change among smallholder farmers in Swaziland. Indian Journal of Nutrition, 3(2), 138–142.
- Mcsweeney, C., New, M., Lizcano, G., & Lu, X. (2010). The UNDP climate change country profiles: Improving the accessibility of observed and projected climate information for studies of climate change in developing countries. Bulletin of the American Meteorological Society, 91(2), 157–166. https://doi.org/10.1175/2009BAMS2826.1
- Mekonnen, Z., Kassa, H., Woldeamanuel, T., & Asfaw, Z. (2018). Analysis of observed and perceived climate change and variability in Arsi Negele District, Ethiopia. Environment, Development and Sustainability, 20(3), 1191–1212. https://doi.org/10.1007/s10668-017-9934-8
- Mengistu, D., Bewket, W., & Lal, R. (2014). Recent spatiotemporal temperature and rainfall variability and trends over the Upper Blue Nile River Basin, Ethiopia. International Journal of Climatology, 34(7), 2278–2292. https://doi.org/10.1002/joc.3837
- Mertz, O., Mbow, C., Reenberg, A., & Diouf, A. (2009). Farmers’ perceptions of climate change and agricultural adaptation strategies in rural Sahel. Environmental Management, 43(5), 804–816. https://doi.org/10.1007/s00267-008-9197-0
- Mkonda, M. Y., He, X., & Festin, E. S. (2018). Comparing smallholder farmers’ perception of climate change with meteorological data: Experience from seven agroecological zones of Tanzania. Weather, Climate, and Society, 10(3), 435–452. https://doi.org/10.1175/WCAS-D-17-0036.1
- Morton, J. (2017). Climate change and African agriculture: Unlocking the potential of research and advisory services. In Fiona N (Ed.) Making climate compatible development happen (pp. 87–113). Routledge.
- Mubiru, D. N., Kyazze, F. B., Radeny, M. A., Zziwa, A., Lwasa, J., & Kinyangi, J. (2015). Climatic trends, risk perceptions and coping strategies of smallholder farmers in rural Uganda. CCAFS Working Paper. CGIAR Research Program on Climate Change, Agriculture and Food Security (CCAFS). Copenhagen, Denmark. Available online at: https://www.ccafs.cgiar.org
- Niemeyer, S., Petts, J., & Hobson, K. (2005). Rapid climate change and society: Assessing responses and thresholds. Risk Analysis: An International Journal, 25(6), 1443–1456. https://doi.org/10.1111/j.1539-6924.2005.00691.x
- Niles, M. T., & Mueller, N. D. (2016). Farmer perceptions of climate change: Associations with observed temperature and precipitation trends, irrigation, and climate beliefs. Global Environmental Change, 39, 133–142. https://doi.org/10.1016/j.gloenvcha.2016.05.002
- Nyadzi, E. (2016). Climate variability since 1970 and farmers’ observations in Northern Ghana. Sustainable Agriculture Research, 5 (2), 41. Sustainable Agriculture Research, 5(526-2016-37880). https://doi.org/10.5539/sar.v5n2p41
- Omoyo, N. N., Wakhungu, J., & Oteng’i, S. (2015). Effects of climate variability on maize yield in the arid and semi arid lands of lower eastern Kenya. Agriculture & Food Security, 4(1), 1–13. https://doi.org/10.1186/s40066-015-0028-2
- Osbahr, H., Dorward, P., Stern, R., & Cooper, S. (2011). Supporting agricultural innovation in Uganda to respond to climate risk: Linking climate change and variability with farmer perceptions. Experimental Agriculture, 47(2), 293–316. https://doi.org/10.1017/S0014479710000785
- Owusu, M., Nursey-Bray, M., & Rudd, D. (2019). Gendered perception and vulnerability to climate change in urban slum communities in Accra, Ghana. Regional Environmental Change, 19(1), 13–25. https://doi.org/10.1007/s10113-018-1357-z
- Roco, L., Engler, A., Bravo-Ureta, B. E., & Jara-Rojas, R. (2015). Farmers’ perception of climate change in Mediterranean Chile. Regional Environmental Change, 15(5), 867–879. https://doi.org/10.1007/s10113-014-0669-x
- Shameem, M. I. M., Momtaz, S., & Kiem, A. S. (2015). Local perceptions of and adaptation to climate variability and change: The case of shrimp farming communities in the coastal region of Bangladesh. Climatic Change, 133(2), 253–266. https://doi.org/10.1007/s10584-015-1470-7
- Shukla, R., Agarwal, A., Sachdeva, K., Kurths, J., & Joshi, P. (2019). Climate change perception: An analysis of climate change and risk perceptions among farmer types of Indian Western Himalayas. Climatic Change, 152(1), 103–119. https://doi.org/10.1007/s10584-018-2314-z
- Simelton, E., Quinn, C. H., Batisani, N., Dougill, A. J., Dyer, J. C., Fraser, E. D., Mkwambisi, D., Sallu, S., & Stringer, L. C. (2013). Is rainfall really changing? Farmers’ perceptions, meteorological data, and policy implications. Climate and Development, 5(2), 123–138. https://doi.org/10.1080/17565529.2012.751893
- Solaraju-Murali, B., Bojovic, D., Gonzalez-Reviriego, N., Nicodemou, A., Terrado, M., Caron, L.-P., & Doblas-Reyes, F. J. (2022). How decadal predictions entered the climate services arena: An example from the agriculture sector. Climate Services, 27, 100303. https://doi.org/10.1016/j.cliser.2022.100303
- Steg, L. E., Van Den Berg, A. E., & De Groot, J. I. (2019). Environmental psychology: An introduction. John Wiley & Sons.
- Tambo, J. A., & Abdoulaye, T. (2013). Smallholder farmers’ perceptions of and adaptations to climate change in the Nigerian savanna. Regional Environmental Change, 13(2), 375–388. https://doi.org/10.1007/s10113-012-0351-0
- Tschakert, P., Dietrich, K., Tamminga, K., Prins, E., Shaffer, J., Liwenga, E., & Asiedu, A. (2014). Learning and envisioning under climatic uncertainty: An African experience. Environment and Planning A, 46(5), 1049–1068. https://doi.org/10.1068/a46257
- Uddin, M. N., Bokelmann, W., & Entsminger, J. S. (2014). Factors affecting farmers’ adaptation strategies to environmental degradation and climate change effects: A farm level study in Bangladesh. Climate, 2(4), 223–241. https://doi.org/10.3390/cli2040223
- Van Griensven, A., Vetter, T., Piontek, F., Gosling, S. N., Kamali, B., Reinhardt, J., and Alemayehu, T. (2016). Inter-sectoral comparison of model uncertainty of climate change impacts in Africa. Paper presented at the EGU General Assembly Conference Abstracts. Vienna, Austria.
- Yamane, T. (1967). Elementary Sampling Theory (1rd ed.). Prentice Hall Inc. Englewoods Cliffs. 405
- Yaro, J. A. (2013). The perception of and adaptation to climate variability/change in Ghana by small-scale and commercial farmers. Regional Environmental Change, 13(6), 1259–1272. https://doi.org/10.1007/s10113-013-0443-5
- Yaseen, M., Ahmad, M. M., & Soni, P. (2018). Farm households’ simultaneous use of sources to access information on cotton crop production. Journal of Agricultural & Food Information, 19(2), 149–161. https://doi.org/10.1080/10496505.2017.1325743
- Zulfiqar, F., Datta, A., & Thapa, G. B. (2017). Determinants and resource use efficiency of “better cotton”: An innovative cleaner production alternative. Journal of Cleaner Production, 166, 1372–1380. https://doi.org/10.1016/j.jclepro.2017.08.155