
 ?Mathematical formulae have been encoded as MathML and are displayed in this HTML version using MathJax in order to improve their display. Uncheck the box to turn MathJax off. This feature requires Javascript. Click on a formula to zoom.
Abstract
Ethiopia is one of the least developed countries where food insecurity is dominant in rural households. Coffee and wheat are the most important cash and staple crops, respectively, in Ethiopia and yet their association with household food security is not sufficiently addressed. This study was conducted in coffee growers of Gomma district and wheat farmers of Dodota district to assess status and determinants of household food insecurity. A total of 370 households were interviewed in the two districts. Semi-structured questionnaire, focus group discussions and key informants interview were used to engage with the farmers. Household Food Insecurity Access Scale (HFIAS) was used to measure household food insecurity. Determinants of household food security status (FSS) were elicited using ordered logit econometric model. The result indicated 43.2% and 56.8% of sample households were food secure and insecure, respectively. The majority (60.5%) of food insecure households were found in coffee growers. Educational level, land degradation, access to market, agricultural advisory services and credit positively influenced FSS of both wheat and coffee growers, yet purpose of production had significant effect only on FSS of wheat growers while remittance had strong association with coffee growers’ FSS. Household occupation, annual farm income and total household asset values also had positive effect on FSS of sample respondents. Hence, mixed development policies and strategies that aimed to address demographic, socioeconomic and institutional aspects of wheat and coffee producers should be designed to assure food security at household level.
1. Introduction
Ethiopia is one of the most under-developed nations and labeled as low income country next to Benin, Burkina Faso and Burundi. Poverty and food insecurity are dominant features of the country, over 20 million people are food insecure of which 13–15 million need food assistance (FAO, IFAD, UNICEF, WFP and WHO, Citation2022). Per capita income in Ethiopia for 2021 was $944, which is substantially lower than the regional average (WB (The World Bank), Citation2021). According to Boero et al. (Citation2021), the proportion of inhabitants affected by chronic food insecurity in 2020 was 21.2% while the combined prevalence of moderate and severe food insecurity was 55.1%.
In Ethiopia, large number of population is dependent on farm production. Crop agriculture in the country is complex, involving substantial variation in crops grown across different regions and ecologies. Principal crops include coffee, cereals, pulses (e.g., beans), oilseeds, potatoes, sugarcane, and vegetables. Ethiopian agriculture is highly vulnerable to severe droughts, erratic rainfall, and crop and livestock diseases. All typical causes of chronic food insecurity such as adverse climatic changes combined with high human population pressure, natural resources degradation and technological and institutional aspects are prevalent in the country (Anderson & Elisabeth, Citation2015; Efrem, Citation2020; FAO (Food and Agriculture Organization of the United Nations, Citation2015).
The issue of food security study has paramount importance in countries like Ethiopia mainly because identifying demographic, socioeconomic and institutional factors are prerequisite to address food insecurity problems (Shumeta, Citation2017) and untreated food insecurity will lead to malnutrition which leaves children and adults more susceptible to contracting life-threatening diseases (FAO, IFAD, UNICEF, WFP and WHO, Citation2021). In addition to this, food insecurity prevents children from growing into productive members of the society and be adults who are fully able to participate in the economic and social development of their countries. In extreme cases, it leads to premature death which could be prevented with relatively simple and inexpensive measures.
Coffee is one of the most valuable cash crops in the country. It is Ethiopia’s largest export crop and the backbone of the Ethiopian economy, providing 25.1% of the foreign exchange earnings in 2020 (ITA (International Trade Administration), Citation2022). In Ethiopia, 856,591.99 hectare of land is allocated for coffee production. It’s annual production is 584,789.6 metric tons (CSA (Central Statistics Agency), Citation2021). The main coffee producing areas in Ethiopia are West and South- west, Southern, Eastern, and Central regions (Melkamu, Citation2015). From top 25 coffee producing districts in Ethiopia, Oromia regional state dominates with 18 coffee producing districts and the remaining top coffee producing districts are located in Southern Nations, Nationalities and People’s Regional State (SNNP; James et al., Citation2015). Jimma Zone of Oromia Regional State is one of the coffee growing zones in the South-Western part of Ethiopia. Given all year-round rainfall, dense forest cover and favorable environment, Jimma zone has high potential for coffee production. The total land area of the zone is 1.1 million hectares of which, 69% of land is allocated for coffee production and covers 43% and 21% of the coffee export share of Oromia Regional State and the country, respectively. Almost all districts in the zone produce coffee with various proportions. Gomma district is one of the 21 districts in Jimma zone where coffee production potential is very high (Jimma Zone Administration Office, Citation2018). However, the coffee harvest time is once in a year and the income obtained from it is utilized all year round. In this district coffee income is assumed to be utilized for the purchase of food and nonfood items. However, the contribution of coffee production for household food security in the district is not yet known.
Wheat on the other hand, is an important staple food crop in Ethiopia. Ethiopia is the largest wheat producer in sub-Saharan Africa (Adugnaw et al., Citation2020). In Ethiopia, wheat is cultivated on over 1.8 million hectares and accounts for 14.629% of the cropland. It contributes about 16.91% of the grain production in the country (CSA (Central Statistics Agency), Citation2021). The crop is widely grown by subsistent farmers under rain-fed conditions and nearly 30% of cereal farm households are dependent on wheat farming (CSA (Central Statistics Agency), Citation2021). The major wheat producing areas include Arsi, Bale, East Gojjam, East Shewa, South Wello and West Arsi zones which produce more than half of Ethiopian wheat (CSA (Central Statistics Agency), Citation2021). Arsi zone is typically known for its potential and production of wheat located in South-Eastern part of Ethiopia. The total land area of Arsi zones is 1.98 million hectares. It contributes nearly 20% of national wheat production (CSA (Central Statistics Agency), Citation2021). Dodota is one of the wheat producer districts in Arsi zone, known for its high potential and conducive wheat production environment.
Coffee grower farmers as specialization agricultural production system are expected to have in better off financial capacity due to income obtained from sale of coffee. On the other hand, wheat grower farmers, unlike coffee growers are expected to have better probability of producing variety of food groups and have better access to diversified food groups grown around their homestead meant mainly for household consumption and that in turn put them in better position of food security status as they have better possibility to access to various food groups. The question pose here is that whether coffee growers attain better food security status which may emanate from their comparative income advantage as compared to wheat growers who are expected to be engaged in production of homestead gardening meant mainly for household consumption or not. In this regard, little or no such studies had been conducted in the current context.
Many studies in the subject focused on identifying individual factors of food security without relating the other component and failed to consider the very nature of food security in different agricultural production systems. The various, complex and interrelated causes of food insecurity in different agricultural systems have not been studied in detail. Therefore, the current research focused on comparative analysis of food security status of coffee and wheat grower rural households of Jimma and Arsi zones, respectively, in general and Gomma and Dodota districts in particular. The two crops, coffee and wheat are crucial income sources and have vital contribution to attain household food security among coffee and wheat growers, respectively. Thus, conducting comparative study at the two study sites was aimed to identify food security/insecurity determinants among these rural households and analyzes the linkage between production systems. This comparative analysis will enable researchers and stakeholders to understand the similarity and difference of household food security factors among wheat and coffee grower households so as to make inferences and policy recommendations on how to address the key food security issues at both communities.
2. Material and methods
2.1. Description of the study areas
The research was conducted in coffee growing rural households of Gomma district of Jimma zone and wheat growing rural households of Dodota wordea of Arsi Zone (Figure ). Gomma district is one of the eight top major coffee growing districts of the zone, where coffee served as major income and livelihood source for majority of its population (JZARDO (Jimma Zone Agriculture and Rural Development Office), Citation2018). The district is located between 7° 49’ 59.99” N and Latitude 36°39’ 59.99”E Longitude with in attitude ranges from 1380 to 1680 meters. According to CSA (Central Statistical Authority, Citation2012), total population of Gomma district was 350,882 of which 177,994 were women. There are 36 Kebeles (the smallest administrative unit of Ethiopia) in the district of which 31 of them are dominantly rural administrations.
Figure 1. Map of the study districts.
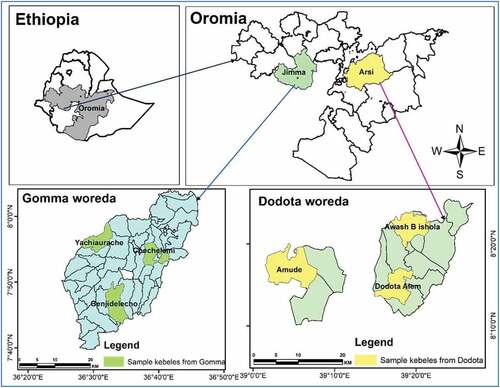
Dodota is one of the major wheat growing districts of Arsi Zone of Oromia Regional state, Ethiopia. It is located between latitude 8° 15′ 0″ N and 39° 20′ 0″ E longitude with altitude ranges of 1400 m to 2500 m.as.l. The total population of Dodota district is 86,761 of which 50% are women. Majority (92.48%) of the district is dominated by rural households where majority (68%) produces wheat as their major crop (CSA (Central Statistical Authority), Citation2012). According to the same source, the district has a total area of 65, 000 ha of land in which 701 ha is irrigated. The farmers in Dodota district’s seasonal calendar is: May to July for sowing; July to November—mid season or growing and November to December for harvesting .They spend nearly 250 days from sowing to harvesting. On the other hand, seasonal calendar at Goma district coffee growers is: November to February for harvest (coffee picking) and from February to October was allocated for several activities related to land preparation, planting and transplanting of new seedlings, plant protection and other land management practices.
2.2. Study design
The current study employed mixed research design which is a procedure for collecting, analyzing and application of both qualitative and quantitative methods in a single study, linking major themes of the study across the survey (semi-structured interview) and Focus Group Discussion (FGD), key informant discussions (KIs) personal observations. The design allows comparison of data obtained from qualitative and quantitative sources to clearly understand the research problem. It also helps to understand complex phenomena, which otherwise other approaches cannot address alone (Creswell et al., Citation2011; Morse & Niehaus, Citation2009).
3. Sampling procedure
3.1. Sampling procedure of quantitative data
Multistage stratified sampling procedure was applied to randomly select households from the two research sites. In the first stage, Jimma and Arsi zones were selected purposively based on their coffee and wheat production potentials, respectively, in the country. In the second stage, stratified random sampling method was applied to select Gomma district from Jimma zone and Dodota district from Arsi zone. In the third stage, six kebele administrations (three from respective districts) were identified randomly (lottery method). Accordingly, Genjidelecho, Yachiyaurache and Chochelemi were taken from Gomma district coffee growers and Awash Bishola, Dodota-Alem and Amude were obtained from Dodota district wheat growers. In the fourth stage, the farm households were identified using systematic random sampling method.
3.2. Sampling procedure for qualitative data (focus group discussants and key informants)
Assisted with Development Agents (DAs), eight community members who were living in the village for long period of time, willing to participate in the study, aware of household food security and community development issues were selected to form one focus group in each sample Kebele. Therefore, non-probability (purposive) sampling method was used to select a total of six FGDs (three from Coffee growers -Goma district and three from wheat growers-Dodota district).
Likewise with consultation of kebele administrator and community Development Agents, total of 12 community key informants (two from each Kebele administration) were selected from six kebele administrations purposively based on their value and acceptance in the community, depth of knowledge on village livelihood, food security and various development aspects of respective study sites using non-probability (purposive) sampling method.
3.3. Sample size determination
Simplified sample size determination formula suggested by Yamane (Citation1967) was used to come up with representative samples.
And
Where, n is sample size, N1 and N2 are population size and e is level of precision. N1 (2928) and N2 (2566) were population sizes of rural households in Gomma and Dodota districts, respectively, while n1 and n2 were sample sizes of the districts in the same order and e is level of precision, which is 0.07.
Based on the above calculation, the sample sizes were n1 = 188 for Gomma district and n2 = 188 for Dodota district. However, the final sample size obtained from Dodota district was 182 as 6 questionnaires were rejected during data cleaning process. Hence, the total sample size used in the current study was 370. The samples were 86 from Genjidelecho, 53 from Yachiyaurache and 49 households from Chochelemi kebele of Gomma district, and 82 samples from Awash Bishola, 47 from Dodota-Alem and 53 wheat growers from AmudeKebele of Dodota district.
3.4. Data types
The study used quantitative and qualitative data from primary and secondary sources. Primary data were collected from sample respondents, FGD discussants and Key informants from respective districts. Data from secondary sources including but not limited to electronic and printed media such as journals, periodic reports, and proceedings, unpublished and published sources were assessed and used for triangulation purpose.
3.5. Data collection methods and procedures
Household survey data were collected from sample respondents using semi structured interview schedule and Household Food Insecurity Access Scale (HFIAS) questionnaire. Household surveys were carried out with an intention of collecting both quantitative and qualitative data of demographic, socioeconomic, institutional, and other psychosocial variables related to household food security status and its determinants. HFIAS is mainly intended to measure access dimension of food insecurity (Becquey et al., Citation2010) and is composed of nine questions or items (Q1–Q9), which were asked with a recall period of four weeks. The questions (Q1–Q9) in their shortened versions are listed in Table . For each HFIAS item, there was a follow-up of the frequency of occurrence question to determine whether the condition happened rarely (once or twice), sometimes (three to ten times) or often (more than ten times) in the past four weeks. These responses are coded as often “3”, sometimes “2”, rarely “1”, or not at all “0”.
Table 1. Affirmative responses of sample respondents to items on the household food insecurity access in rural Arsi and Jimma zones, Ethiopia (N = 370)
The respondent included in the household survey was a person in charge of food/meal preparation and/or household head in respective sample households (Becquey et al., Citation2010). Enumerators who live in the area, fluent speakers of local language (Oromifa), well acquainted with local and cultural contexts, and working within the selected districts were recruited for the data collection. They were trained on the contents of the interview schedule and data collection techniques. Pre-test on non-sample respondents was also made under supervision of the researcher. Finally, the formal data collection was conducted on sample respondents after necessary modification and adjustments were accommodated as per the result obtained from the pre-test.
Focus Group Discussion and Key informants’ interview along with personal observations were also applied to collect qualitative data from carefully and purposively selected FGD discussants and key informants using checklist as data collection instrument. The participants in FDG and KI interview were encouraged to use their local language that they were most familiar with and Development Agents most familiar with the local language facilitated the group discussions. These methods addressed the feelings, perceptions and understanding of local people over pertinent food and nonfood related issues at household level. Majority of the data generated from these methods were used for data triangulation and as standalone analysis against the objectives of the study. Data generated from FGD and KIs were recorded, transcribed and described as per the objectives of this study with thier prior informed consent. Data were collected from study areas between April 2019 and September 2020.
The study employed six FGDs, three from respective research sites (one FGD from each Kebele). Each group constituted eight discussants selected from community members based on their willingness to participate in the study and knowledge of both the study areas and problem under study (food insecurity at household level). Likewise, a total of 12 key informants, six key participants from each district were purposively selected in consultation with the district Agriculture office and data generated from them were recorded, transcribed and described as per the objectives of this study with their prior informed consent. Data were collected from the study areas between April 2019 and September 2020.
3.6. Method of data analysis
Demographic, socioeconomic, institutional and food access related data which had been collected from several sources were cleaned and entered in to SPSS (Citation2017) version 25 and exported to STATA (Citation2019) version 16.0. Descriptive statistics (means and percentages); inferential statistics (chi-square and t-test), and econometric model (ordered probit regression model) were employed to identify important variables that determine household food security.
3.7. Measuring household food security status
According to Coates et al. (Citation2007), HFIAS classify households into four levels of household food insecurity (access) based on the score obtained from the given question items. These include food secure, mildly food insecure, moderately food insecure and severely food insecure. Accordingly, households were grouped into four categories (levels). A household is food secure if it scored “0” or “1” in the first FI frequency of occurrence question and “0” in Q2 to Q9; mildly food insecure if the first FI frequency of occurrence item has “2” or “3” or the second item has “1,” “2,” or “3” or the third item has “1” or the fourth item has “1” and items Q5 to Q9 score “0”; moderately food insecure if item three = “2” or “3” or item four = “2” or “3” or item five = “1” or “2” or item six = “1” or “2” and item seven to nine = “0”; and severely food insecure if item five = “3” or item six = “3” or item seven = “1,” “2,” or “3” or item eight = “1,” “2,” or “3” or item nine = “1,” “2,” or “3” (Coates et al., Citation2007). The overall household food insecurity prevalence was computed as the proportion of food-insecure households out of the total interviewed households and households interviewed in respective production systems.
3.8. Determinants of household food security
Researchers in the field of economics and development agreed that regression methods such as linear, logistic, and ordinal regression are vital to analyze the relationship between multiple explanatory variables. The aforementioned methods would allow researcher to estimate the magnitude of explanatory variable on the dependent variable. To obtain valid results while attempting to estimate the outcome variable using explanatory variables, one should be curious and appropriately choose which model should be the best fit of the current context (Chen & Hughes, Citation2004).
Ordinal regression model is a type of logistic regression model that is used to analyze ordinal dependent variables According to McCullagh and Nelder (Citation1989), if, for instance, the outcome variable is in ordinal scale, the ordinal regression model is a preferred modeling tool which does not assume normality or constant variance, but requires the assumption of parallel lines across all levels of the outcome variable. It is rooted in the general framework of generalized linear models meant for analysis of ordinal dependent variable. Ordinal regression model describes the relationship between an ordered response variable and a set of explanatory variables which may be continuous or discrete. Similarly, the ordinal logistic regression procedure empowers one to select the predictive model for ordered dependent variables.
In the current study, ordinal regression method of analysis was used to meet the objectives set since the response variable has four ordered categories (food secure, mildly food insecure, moderately food insecure and severely food insecure) and the value of each category has meaningful sequential order. The study also used logit link function which is generally suitable for analyzing the ordered categorical data when all categories are evenly distributed (SPSS, Citation2017).
When the logit link is applied, the general form of ordinal regression model is formulated as:
In this particular formula, j indicates the cut-off points for all categories (k) of the dependent variable, the function is the link function that links the systematic components (i.e
) of the linear model, the alpha j represents a separate intercept or threshold for each cumulative probability and b represents the regression coefficient (McCullagh & Nelder, Citation1989).
Secondary data were taken from various multilateral organizations like FAO and different NGOS like GIZ, CRS (Catholic Relief Service), Self Help Ethiopia and Government organizations like Zonal and district level productive safety net program (PSNP) office, district agriculture offices, district health offices, health centers and health posts. Data obtained from the above sources were analyzed and triangulated with other data obtained from primary sources. Besides, food security policy documents, electronic and printed documents from various multilateral organizations such as FAO, UN, IFPRI and so forth, NGOs working on food security and related issues, researches conducted by individuals, institutions and organizations were contacted for further exploration of subtle ideas.
4. Results and discussion
4.1. Distribution of respondents by their response to food insecurity access indicator
The distribution of respondents with respect to the HFIAS questions was found to be dominated by higher percentage of coffee growers for majority of the questions. Out of the given nine food access indicator questions, coffee growers had shown higher percentage for six questions i.e eating limited variety of foods (86.2%), eating food not really wanted to eat (60.6%), eating small portion of food (71.8%), incidence of not having any kind of food in the household (72.9%), sleeping hungry without food (55.9%), and spending whole day and night without food (52.7%). The responses of sample respondents for the HFIAS questions asked with a recall period of four weeks implied are summarized in Table .
The percentage of wheat growers for the above mentioned questions were 85.2%, 58.8%, 63.7%, 64.8%, 63.7%, 37.4 and 26.9%, respectively. On the other hand, wheat grower households worried more about food (91.2%) as compared to coffee growing households, which was 78.7%. Likewise, 91% wheat grower households were unable to eat preferred food items because of various reasons including food unavailability and lack of financial capacity to buy food. This implies that, majority of wheat growers (65%) eat fewer meals in a day due to unavailability of sufficient food in the household and was slightly higher than coffee growers (61.2%). The FGD and Key informants’ discussion also asserted that the source of worries for most of the households were lack of financial capacity, unemployment and poverty. In general, from this finding it can be observed that wheat growing households were in a better position to access food than coffee growers. Coffee growers faced serious food shortage at household level.
4.2. Household food security
HFIAS is a valid measure of food insecurity at household level in developing countries (Knuepell et al., Citation2009; Maes et al., Citation2009). Based on this food security measurement tool, the 370 households included in the present study were classified in to four levels of household food security status. Among all respondents, 160 (43.2%) households were identified as food secure while 109 (29.2%), 86 (23.2%) and 15 (4.1%) sample respondents were mildly, moderately and severely food insecure, respectively (Table ). This indicated that 210 (56.8%) of total respondents in the study area were food insecure at various levels (Mild, Moderate or severe), of which 127 (60.5%) were found in coffee growing farmers.
Table 2. Food security status of households in Arsi and Jimma zones, Ethiopia
The study also clearly showed that household food security status of wheat growing and coffee growing rural households was different. As it can be depicted from Table , percentage of food secure households was high in wheat grower households (54.4%) than coffee growers (32.4%). In the contrary, coffee growers were dominated by mild (35.6%) and moderately (29.8%) food insecure households than wheat growers where, 23.1% and 16.5% of them were mildly and moderately food insecure, respectively. The percentage of severely food insecure households was higher (73.3%) in wheat growers as compared to coffee growers (26.7%). The finding from FGD and key informants’ interview conducted in Dodota district and secondary data obtained from relevant offices confirmed these resource poor and severely food insecure households in wheat grower farmers are targeted in PSNP.
Several studies conducted in Oromia regional states showed that the percentage of food insecure households vary from place to place. For instance a study conducted by Mequanent et al. (Citation2014) showed that the percentage of food insecure rural households in Mana district of Jimma zone was 42.9%. Higher share of food insecure households of 83.5% was reported by Tiyou et al. (Citation2012) in Jimma town pensioners. On the other hand, Debeli et al. (Citation2021) reported 22.78% food insecure households in Gumay district of Jimma zone. A review of food security status in Ethiopia indicated that the incidence of food insecurity in the country in 2019 was 64% (Abebaw & Betru, Citation2019). In general, the determinant factors of food security and coping strategies used were different at different levels of application, so that percentages of food insecure households greatly vary on the locations in which the studies were conducted (Mohammed & Mohammed, Citation2021; Nour SSO & Abdalla, Citation2021; Pakravan-Charvadeh et al., Citation2021; Mengistu et al., Citation2022).
4.3. Distribution of respondents against major socioeconomic explanatory variables
The minimum and maximum age attained by the respondents in the study areas were 19 and 85 years, respectively. The means of the ages of the sample respondents in the wheat and coffee growers were late thirties across the different food security status groups except for mildly food insecure and severely food insecure coffee grower households in which cases the means were 40 and 33 years, respectively (Table ). Several researchers such as Eshetu and Young-Bohk (Citation2017), Fikire et al. (Citation2022), and Mengistu et al. (Citation2022) found that age of household and food security had positive association. On the other hand, studies conducted by Mohammed et al. (Citation2021), and Mohammed and Mohammed (Citation2021) revealed negative association between age of household head and household food security.
Table 3. Distribution of sample respondents against socioeconomic characteristics of continuous variables
Family size was measured in adult equivalent (AE). The result has shown that the minimum and maximum family sizes were 1.3 and 10.7, respectively. The mean family size for food secure, mildly food insecure, moderately food insecure and severely food insecure household of wheat growers were found to be 4.2, 4.35, 4.1 and 4.4, respectively, whereas in coffee growers the mean family sizes were 4.76, 4.53, 4.71 and 3.75 in the same order. Highest family size was recorded among moderately food insecure households of wheat (10.3) and coffee (10.7) than other food secure/insecure status groups (Table ). The food secure/insecure households in the respective study sites had no significant difference in terms of the mean family size. Many studies found that an increase in the family size decreases the chances of food security in the household (Abebaw & Betru, Citation2019; Kleve et al., Citation2021; Mohammed & Mohammed, Citation2021). According to empirical findings of N De et al. (Citation2013), Kumar Sahu et al. (Citation2021) and Owoo (Citation2021) large family size with subsistence agricultural production in developing countries exerts more pressure on consumption than the labor it contributes to production. Hence, large family size is more likely related to being food insecure in a household.
Total land and cultivated land were considered as key variables that may determine household food security status. Thus, these variables were analyzed to see their distribution among various food security/insecurity groups of coffee and wheat growers of the study sites. From the analysis, there had been evidence that some of the farmers didn’t have any type of land including land for cultivation. Conversely, the maximum size of total land in the study populations was 10 hectares which was recorded in food secure households of coffee growers. The mean hectare of total land decreases across food secure, mildly food insecure, moderately food insecure and severely insecure rural households of both wheat and coffee growers (Table ). On the other hand, the minimum and maximum cultivated land allocated for households were zero hectare and six hectares, respectively.
Land is a critical production factor that determines the type of crops grown and the size of crop harvests. The mean cultivated land areas for food secure, mildly food insecure, moderately food insecure and severely food insecure households of wheat growers were 1.67, 1.55, 1.34, and 1.24 hectares, respectively. Likewise, food secure coffee grower households obtained highest share of both cultivated and total land. This implies that farmers who had larger farm land for their crop production were found to have increased food access and utilization, thus land ownership and size of land is critical factor influencing household food security. Under subsistence agriculture, land is expected to play a significant role in influencing farm households’ food security. Similar studies conducted in Arsi (Eshetu & Young-Bohk, Citation2017) and Benshangul Gumuz Zones (Mohammed & Mohammed, Citation2021) confirmed that land size has positive and significant effect on household food security status.
The descriptive statistics showed that most of the sampled respondents either had farm income, non-farm income, off-farm income or income from multiple activities (Table ). However, it is evident from this finding that there were households who didn’t obtain income from any of the above-mentioned sources. These households either got their income from remittances (gifts), PSNP engagements or any other sources. The maximum incomes obtained by farmers from farm, non-farm and off-farm activities were 205,000, 144, 000 and 60,000 birr, respectively, in the study areas. The mean annual farm income of food secure, mildly food insecure, moderately food insecure and severely food insecure wheat grower households were 24,914, 22,602, 22,136 and 17,129 birr, respectively. Mean annual income earnings of coffee grower household’s from farm activities were 15,811, 10,773, 7,852 and 6,325 birr in that order across the food security status groups. Though coffee is a cash crop in Ethiopia, the income coffee producers earned from their farm activities was smaller than wheat growers. The data obtained from Jimma zone office of Agriculture and rural development indicated that coffee in Ethiopia is marketed via two main channels: domestic consumption and for exports. Most of smallholder farmers in the study area sell their coffee to local collectors in the nearby markets; this puts the producers at a disadvantage since they sell their coffee at price set by the private merchants which are usually very low compared to the prevailing market price (JZARDO (Jimma Zone Agriculture and Rural Development Office), Citation2018). The other likely explanation could be the farm land holding size in coffee producing district was smaller than that of wheat farmers and the production size could be limited. Likewise, the possible reason for food secure households at both production areas to have better farm income as compared to insecure households was that farmers in food secure status groups had relatively larger farm size and are more likely to get higher income from the sale of their produce than those households who had little land hence increased production and diversified household income which in turn would enhance households’ food security.
On the other hand, the highest mean annual incomes of 13,817 birr and 5,567 birr were obtained by food secure and moderately food insecure wheat grower households in the same order. These farmers were engaged in non-farm and off-farm activities, respectively. Conversely, the highest income of 5,550 birr sourced from non-farm activities was obtained by severely food insecure coffee farmers. Similarly, mildly food insecure coffee farmers had the highest annual off farm income (1388 birr) as compared to other food secure/insecure groups. Yet, the total amount (sum) of income wheat growers obtained from the above-mentioned sources was high (38,556 birr) in food secure households and low (29,747 birr) in severely food insecure households. The same trend was observed in coffee growing households with the highest total annual income of 21,580 birr obtained by food secure households and the lowest total annual income of 12,125 birr obtained by severely food insecure households (Table ).
Based on this study, households with low income were likely to be food insecure as compared to households who had average and higher household income. This finding is supported by Eshetu and Young-Bohk (Citation2017), Mengistu et al. (Citation2022), Nour and Abdalla (Citation2021) and Mohammed and Mohammed (Citation2021). Likewise, N De et al. (Citation2013) and Mengistu et al. (Citation2021) reported that income earned from various income generating activities is crucial coping strategy for farm households to manage unexpected income losses for survival and the improvement of food security.
The result of key informants interview and FGD discussants also agreed on the above findings. Shortfalls of agricultural productions resulting from temporary failures due to unexpected drought or long term factors such as shortages of farm land, inadequate farm income trigger households to participate in off/non-farm activities. Households engaged in casual and seasonal labor, retail, and so forth to generate alternative income apart from farm income to manage unexpected income losses for survival and ultimately reduce the probability of being food insecure.
Apart from farm, non-farm and off-farm income sources, gift or remittance was found to be one of prominent income sources among respondents of wheat and coffee grower farm households. The mean remittance of all respondents was ranging from none (zero) to 40,000 birr. The mean values of remittance in food secure, mildly food insecure, moderately food insecure and severely food insecure wheat growing households were 1027, 633, 789 and 527 birr, respectively, while the mean values were 9245, 6553, 9055 and 4375 birr in coffee grower households in the same order. It is evident from this study that remittances could contribute to the improvement in the food security of receiving households. Findings of many researchers in the country also revealed households with access to remittance have higher ability to secure adequate quality of food, and lower experience of insufficient quantity of food intake than those without remittance (Abadi et al., Citation2018; Adams & Cuecuecha, Citation2010; Zarate-Hoyos, Citation2004).
Number of livestock kept by households was explained in tropical livestock unit (TLU) among the various categories of food security status. Livestock ownership and magnitude in TLU ranges from non-existence of livestock in both farming households to 20 TLU in wheat growers. In coffee growers the mean TLUs ranged between 1 and 2. Relatively higher mean TLUs (ranging from 2–4) were recorded among the different food security status groups of wheat farmers than coffee growers (Table ). This may have contributed for the better food security status of the wheat grower households than coffee growers. Livestock in the study areas contributes to food security both directly and indirectly. Key informants referred livestock as sources of supplementary food, cash income, input for crop production and soil fertility management, saving, employment and means of transport in the study areas. In addition, livestock are considered as a means of security and coping strategy during crop failure and other calamities. Likewise, results of previous researches also revealed households with more number of livestock have a better chance to be food secure and thus, have less risk of food insecurity (Mohammed & Mohammed, Citation2021; Mohammed et al., Citation2021; Mengistu et al., Citation2022).
The study further evaluated the extent to which the household income covers the minimum level of expense needed for food items, thus assessed the extent to which the sample households are food secure or insecure. Accordingly, the minimum and maximum annual expenditure on food items by all sample respondents were 1040 and 61,200 birr, respectively (Table ). On average food secure, mild, moderate and severely food insecure wheat grower households spent 4537, 4536, 4123 and 4055 birr, respectively, on food items per annum. Similarly, mean expenditures on food items by coffee growers were 19,960, 11,448, 10,108 and 9885 in the same order, which was much higher than wheat farmers’ expenditure on food items. This could be attributed to the fact that wheat farmers use their own produce mainly for the household consumption and spend small amount of money per annum for the purchase of food items from local markets. Farmers in FGD also illustrated that farmers in Dodota district produce diversified crops such as barley, fababean, field pea, linseed, maize etc. in addition to wheat mainly for household consumption.
Coffee farmers, on the other hand, usually consume a very small portion of their harvest and they rely on coffee income to purchase food items from local markets which ultimately trigger coffee growers spend much of their income for the purchase of food items than wheat growers. However, household expenditure on food items has shown decreasing trend along food security/insecurity groups i.e from food secure to severely food insecure coffee growing households. Similar studies conducted in several contexts had shown that households whose food expenditure was higher tend to be food insecure. The finding from FGD discussants and Key informants interview confirmed that most coffee growing households spend their money mainly on purchase of food items, medication, school material purchase, farm inputs, social obligations and payback debts which makes them unstable and keeps them in vicious circle of poverty and food insecurity.
The minimum and maximum annual cost of production per hectare by all sample respondents were 0 and 16,850 birr, respectively. On average food secure, mild, moderate and severely food insecure wheat grower households spent 3794, 3313, 3430 and 2875 birr per hectare for wheat production in that order. Similarly, mean expenses for coffee production were 1727, 2132, 1479 and 700 birr per hectare across the food security status group and were much lower than wheat growers’ production costs. This could be explained by the high cost of items for wheat production in the study area including rental value of combiner-harvester, improved seed, fertilizer, chemical and opportunity cost of labor. Nevertheless, the cost of coffee production was minimal as most sampled farmers in Goma district grew forest and home garden coffee, and had minimal expense for farm management. Jenaa et al. (Citation2012) also reported that the use of chemical fertilizers or pesticides in coffee production in Jimma Zone was not widespread.
4.4. Distribution of respondents against major socioeconomic continuous explanatory variables
The educational level of the household head is a key factor associated with household food security status. Results of the present study showed that increased household education attainment was associated with an increased probability of being food secure at both locations (Tables ). Majority of food secure households of wheat (53.5%) and coffee (78.7%) growers attained primary and secondary schools, respectively, whereas majority of moderately (50%) and severely food insecure (63.6) households in wheat farming areas had no formal education. Conversely, majority of moderately insecure households (55.4%) and severely food insecure households (75%) of coffee growers attended basic education. This is consistent with other studies that showed food security to be positively associated with the level of education (Abebaw & Betru, Citation2019; Akukwe, Citation2020; Mengistu et al., Citation2021; Mohammed & Mohammed, Citation2021; Mohammed et al., Citation2021; Mengistu et al., Citation2022). This could be explained by the fact that educated household heads have increased awareness on the possible advantages of modern agricultural production and could easily embrace technological inputs. They also have increased efficiency and better decision making ability, hence increased production and diversify household income which in turn would enhance households’ food security.
Table 4. Distribution of wheat grower respondents by categorical socioeconomic variables and household food security status
Table 5. Distribution of coffee grower households by categorical socioeconomic variables and household food security status
Level of soil degradation had shown statistically significant difference along the food security status groups both in wheat (x2 = 240.61 and p < 0.000) and coffee growers (x2 = 143.22; p < 0.000). Majority of respondents in food secure groups reported that their land was characterized by no soil degradation or mild level of degradation. Likewise, moderately and severely food insecure households suffer from poorly fertile land due to severe land degradation. This suggested that land degradation reduces agricultural productivity and poses a serious threat on food security status of households. Decline in soil fertility due to long-term cultivation with little or no fertilizer application is the major form of land degradation in most parts of Ethiopia and the major reason for low production and productivity which in turn affects the food security status of households. This is supported by literatures showing that soil fertility problem has positive association with household food insecurity (Holden & Shiferaw, Citation2004; Tsegaye & Bekele, Citation2010).
Households in the study areas produce their crops for consumption, market or both purposes. Close to half (52.5%) of food secure households produce coffee meant only for market supply while 19.7% of them produce coffee both for market only and household consumption. Likewise, 28.4% and 38.8% of mildly food insecure and 26.8% and 33.9% of moderately food insecure households produce coffee with the purpose of market and both for market and consumption, respectively. Majority of respondents in severely food insecure households produce coffee for their own consumption. This implies that the variable had significant effect (p < 5%) on food security status of coffee producers though its association with food security level was weak (Table ). Conversely, purpose of production had no effect on food security status of wheat farmers as majority of wheat grower households in the four status groups produce wheat both for selling and consumption. This implied that purpose of production can have different effect on a household food security. For example, market oriented production may have negative effect on household food consumption due to reduced food availability as a result of a sell of big portion of produce (Von Braun & Kennedy, Citation1994). On the other hand, production for market supply may increase income and allow households to purchase additional and alternative food items. Likewise, production for consumption may reduce food insecurity as there will be sufficient food in the household. These findings are supported by Kuma et al. (Citation2019) and Rubhara et al. (Citation2020).
Remittance had significant (P < 1%) association with food security status of wheat growers. Wheat growing households who were not receiving remittances tend to be severely food insecure (Table ). However, the association was insignificant in coffee grower households. Studies conducted in different parts of the country indicated that in some areas remittance had significant association with food security status whereas, in some study locations the association is weak. As per Mengistu et al. (Citation2022), receiving remittances is a household coping strategy that might reduce poverty, alleviate hunger, promote better diets and increase productive investments. On the other hand, researchers such as N De et al. (Citation2013), Akukwe (Citation2020) and Mengistu et al. (Citation2021) observed negative association between receiving remittances and the food security status.
Taking into account the overall effect of food security programs on household food security status, there was significant difference between the status groups of both wheat and coffee households (Tale 4 and 5). The result indicated that all wheat growers (100%) and most coffee producers (86.9%) in food secure groups were not supported by any food security program. However, great majorities of respondents in the three food insecure status groups at both locations had been supported by PSNP programs and their livelihood situations are a little bit better after they became beneficiary of the program though they still remain food insecure. As per the research conducted by Welteji et al. (Citation2017), contribution of such programs for the food security and livelihood of a household depends on factors such as age and education level of the household head, culture of savings and accumulation of assets and engagement of beneficiary households in diversified asset building livelihood strategies. Likewise, the research conducted by Bahru et al. (Citation2020) on impact of PSNP on food security and child nutrition did not find any evidence of association between PSNP and household food security.
The FGD discussants and key informants interview in Dodota district revealed that rural households who don’t have any type of land or have small size of infertile land; no livestock at all or have small number of small ruminants; lack financial capacity to buy agricultural inputs and household consumables; don’t have collateral to take credit; and willing to participate in the program were involved in PSNP. The program arranged 15 kg of wheat per individual per month and 250 birr to cover non-real food demand of the household. Assuming selected beneficiaries can fulfill their household food demand for six month counting from harvest time, the program usually covers the food demand gap for the remaining six months. Besides, a maximum of five family members will be considered in the PSNP.
Here the real beneficiaries and FGD discussants complained that the aforesaid ration is not sufficient to cover the food demand of targeted households. They added that the allocated benefit was calculated 15 and 20 years back where the price of commodities and household food demand was far cheaper than the current food prices. Hence, food security and livelihood of PSNP beneficiaries remained the same even deteriorated. Biased selection, delay in payment, small amount of cereal and money allocated to cover household food demand, delay in payments were also mentioned by FGD discussants as major shortfalls of the program. Due to the listed internal factors and other external issues associated with it, the result of the program is not as such satisfactory and doesn’t seem achieving its goal.
Market access had significant association with food security status of both wheat and coffee growers. Majority of households in food secure status group had better market access than the food insecure households at both study sites. However, the frequency data in Tables revealed that wheat producers had better market access than coffee growers. According to DD. Mengistu et al. (Citation2021), Mengistu et al. (Citation2022) and Mohammed et al. (Citation2021), to ensure food access, an adequate amount of food must be within the physical reach of vulnerable households, whether through their own production or through market. Jacoby and Minten (Citation2009) also reported that market access increases farmer’s income through decreased transaction costs, which can, in turn, empower them to purchase variety of foods from local markets and reduce household food insecurity. Likewise, Abay and Hirvonen (Citation2017) agreed that access to markets can increase smallholders’ income and improve their food consumption, and consequently reduce poverty and food insecurity.
Development Agents contact has significant positive influence on food security status of wheat and coffee households at P < 1% and P < 5%, respectively. Majority of respondents in food secure status groups had contact with development workers while the contact with DAs was minimal in moderately and severely food insecure households. This indicated that an increased contact to development agents increases the probability of households to be food secure as a result of dissemination of agricultural extension and improved technologies to the farm households by DAs thus ultimately increases production and productivity. This finding is in agreement with Tewodros & Fikadu, (Citation2014) who reported access to extension measured in contact with development agents show significant difference between food secure and insecure households.
The impact of access to microfinance on food security status of households in the study areas are displayed on Tables . The results indicated that microcredit utilization had an important influence on food security level of rural wheat (P < 0.000) and coffee (P < 0.1) grower households. From food secure households of wheat and coffee, 100% and 52.5%, respectively, of respondents were credit users from microfinance institutions whereas almost equal proportions of respondents at both locations were credit non-users. This reveals that credit user households were more food secure than non-users in the study area. Mounting evidence suggested that access to credit helps farmers to purchase inputs and agricultural equipment that would potentially contribute to increased agricultural productivity (Urago & Bozoglu, Citation2022). Nour and Abdalla (Citation2021), Mohammed et al. (Citation2021) and Ngema et al. (Citation2018) also reported microcredit utilization as one of the viable solutions to improve the food insecurity problem in the country.
According FGD discussants and key informants, most rural households prefer to take credit from government supported microfinance institutions such as Oromia Credit and Saving Institution. However, high interest rate, lack of collateral, delay in credit provision, group lending and repayment structure and other constraints discourage most users. Thus, farmers look for other sources such as private lenders and organizations rendering the service. According to discussants in Dodota district, wheat production in the area involved participation of various organizations and institutions such as brewery industries, flour factories and other import and export companies working in relation to wheat production and marketing. These partners were involved in various forms of support where one is provision of farmers with farm inputs on credit basis. These loans are expected to be paid back soon after harvest in kind (wheat). However, the market price of wheat soon after harvest becomes low due to high supply of the produce channeled to the local and federal markets. These and other factors put the farm households not to be benefited from wheat production, which could have fetched higher price if it could have been sold sometime from harvest season. FGD discussants and key informants stressed that, immediate sell of wheat after harvest led most wheat growers to become highly vulnerable to food insecurity, remain poor and trapped in the same vicious circle of taking credit during sowing season and pay back in kind with low market price every harvest season. On the other hand, the only institution providing financial services to producers in Dodota district was government-supported microfinance and the service provided for the coffee farmers was very limited; not available to all producers who need credit.
4.5. Econometric analysis
The nature of dependent variable in this particular study was levels of food security/insecurity status in coffee and wheat grower rural households and is ordinal level which requires ordinal analysis. Therefore, ordinal logistic regression model was applied to identify determinant factors of food in/security in the study areas. The model was fitted to a total of 16 variables of which six: household occupation, amount of farm income, total household asset value, purpose of production (market oriented), market access and access to microfinance institutions had effect on household food security status with various levels of significance (Table ).
Table 6. Ordinal logit estimates of determinants of household food security
The result indicated that as compared to coffee production, wheat production had significant role in attainment of household food security. The model result revealed that there is statistical and positive association with household food security and wheat production at p < 1%. The descriptive analysis also confirmed that majority of food insecure households were found in coffee growers than wheat growers. The FGD and Key informants stated wheat growers produce different types of food crops besides to wheat which is essential to serve the household food demand. Besides, presence of Wonji sugar factory, research organizations, seed enterprise and other private firms in the vicinity are non-farm and off-farm income opportunities along with their regular farm activities. Wheat farmers use income from various sources as coping mechanisms during critical food shortage. Thus, they are better off in attaining household food security as compared to their counter parts (coffee growers). On the other hand, coffee growers, in addition to their dependency on coffee production, which is full of market and production risks, they face shortage of financial capacity to cover the household food and non-food demand. The FGD discussants also pointed out that presence of middle men in the coffee market, coffee berry disease (CBD), sky rocketing cost of inputs and lack of institutional support worsen the problem of household food insecurity among coffee farmers in the study area.
In most households of coffee and wheat farm households their food store lasts from 6 to 8 months depending on their wealth status and other factors. Thus, farm income obtained from farm activities (sell of crop and livestock) will be insurance for the remaining four to six months prior to next harvest; serve the household to fulfill immediate household food and non-food demands during bad times. The model estimation indicated that annual farm income obtained by households had prominent role in enhancing household food security in coffee and wheat farmers. Both coffee and wheat farmers fulfil their household food and nonfood demands from sale of marketable commodities including coffee and wheat in respective study sites. Several studies conducted in different parts of the country confirmed the positive and significant association of annual farm income with household food security attainment (Mengistu et al., Citation2021; Mitiku et al., Citation2012).
The operational definition of total household asset in the context of this research is the sum value in birr of all assets owned by the household including but not limited to land and any valuable structure on the land, agri-tools, any valuable asset in the household and workplace, Jewelry, money at hand or saving and so forth which are reported by the household during the period of data collection. The model estimation has shown that total household asset value had significant and positive association with household food security in coffee and wheat growing farmers at p < 5%. Guo (Citation2011), Thamaga-Chitja et al. (Citation2004) and Lutomia et al. (Citation2019) found similar results.
According to FGD and Key informants, households who have large size of fertile farm land, different types of valuable production tools, personal properties, money at hand or in saving and properties deposited in different forms have all year round food availability and access, thus they are food secure. These households use these assets as insurance and/or coping mechanisms during bad times such as drought. In the contrary, households who don’t have such valuable assets are vulnerable to food insecurity and other shocks any type of shock. Thus, according to them accumulation of household asset and household food security are highly related.
Rural households in the study areas produce respective crops with diverse purposes vis-à-vis for household consumption, commercial purpose or both for consumption and supply to the market. Decision to be engaged in one or more of the above options depends on various factors including demographic, socioeconomic and institutional factors. Fulfilling household food and non-food demand through supply of their produce to the market, production meant mainly for household consumption and compromising between production for consumption and market can be some.
The model result indicated that market-oriented production had positive and significant effect on household food security at p < 5% (Table ). From the qualitative data we found that, households who own large and fertile land farm, and have access to market information and credit service mostly produce for market apart from household consumption. Market oriented production enable households to fulfill their food and nonfood demands and hence attain their food security. The descriptive statistics on Tables , had also revealed purpose of production had significant effect on food security status of coffee growers but not on wheat grower households. Kuma et al. (Citation2019) and Usman and Callo-Concha (Citation2021) confirmed that more commercialized households have better chance to obtain higher income and increased productivity due to increased input use and purchasing power of additional and/or alternative food items for the household.
Market is crucial institution both for coffee and wheat grower smallholders and it has paramount contribution for household food security. Coffee and wheat are major sources of livelihood and food security in Dodota and Gomma districts, respectively. Coffee growers take coffee to the market so as to buy food and non-food items, agricultural inputs, medical and school expenses and other household demands. This indicated that market is backbone for coffee grower rural households. Likewise, wheat is important cereal crop used as staple food and marketable commodity.
FGD discussants and Key informants confirmed that, wheat is major sources of food among wheat growers where it is used in different forms. After fulfilling household food demand, farmers take the crop to the market so as to buy alternative food items, agricultural inputs and other household demands. Income obtained from sell of both commodities is also utilized to pay credit which had been taken for the purchase of agricultural inputs and services in the household. They emphasized that lack of market information, storage facility and lack of financial capacity to repay the credit force farmers to sell their produce immediately after harvest at cheapest price which ultimately affect the household food security of households.
The model estimation had shown that access to market had significant and positive association with household food security at p < 1% (Table ). The finding was in line with Ahmed et al. (Citation2017), DD. Mengistu et al. (Citation2021), and Nour SSO and Abdalla (Citation2021). Likewise, microfinance institutions have prominent contribution in reducing poverty and improving household food security (Addisu BM, Citation2016). Findings from Zeller and Sharma (Citation1998) in Ghana also asserts that combination of credit service with education resulted in improvement in household food security attainment. The present study revealed that there was significant and positive relationship between access to credit services/microfinance institutions and attainment of household food security at (P < 1%; Table ). Similar study by Nour and Abdalla (Citation2021) also confirmed that farmers who are engaged in production of cash crops like coffee and partly wheat need microfinance institutions and/or banks to facilitate their farm business and hence to attain household food security. The role of financial institutions had paramount importance in various ways such as saving, provision of short term and long-term business loans, technical support, training and so forth to start a new farm or nonfarm business. Thus, access to microfinance had strong and significant effect on household food security.
5. Conclusion and policy recommendation
The current research was focused on comparative analysis of severity of household food insecurity and its determinants between selected coffee and wheat farmers of Goma and Dodota districts, respectively. These farmers have peculiar characteristics in terms of their demographic, socioeconomic and institutional features as well as level of food security/insecurity and factors determining household food security.
Majority of wheat farmers produce wheat with prior purpose of consumption and market, indicating the crop has multiple roles among the small holders. On the other hand, food secure coffee farmers undergo market oriented production, whereas food insecure households produce coffee for household consumption and to take the remaining to the market so as to buy household food and non-food items. The model result has shown that raising amount of annual farm income had prominent role to attain household food security. This implies that coffee and wheat as major crops are important to influence household food security with different proportions among rural households. Thus, policy and strategies designed to address the needs of smallholders to enhance their production and facilitation of market would enhance household food security status.
On the other hand, food insecure wheat farmers support their livelihood and food security using different strategies like engaging in off-farm and non-farm activities. Likewise, accumulation of household asset benefit rural coffee and wheat growers as coping strategy, source of livelihood and income diversification. Thus, policy and strategies which involves strengthening small holders in the area of income diversification, employment opportunity, asset formation and accumulation and resource management would have paramount importance to realize household food security.
The presence of institutions would facilitate marketing of farmers produces and buying agricultural inputs like fertilizer, improved seed, chemicals etc. that would in turn have contribution to attain household food security. Policy actions designed to address crop variety improvement, marketing of crop produce and availability of agricultural inputs, in one hand and accessibility of microfinance institutions on the other hand should be devised to maintain positive effect of these variables towards attainment of household food security. Generally, attaining food security in the study areas demands implementation of diverse policies and strategies across all variables that had shown significant association with household food security.
Ethics approval and informed consent
Before the start of the actual research activities, the researchers have obtained support letters from Addis Ababa University, Center of Rural Development. The letters were submitted to Arsi and Jimma zones Agricultural Offices and concerned governmental and non-governmental organizations working in the area of food and nutrition security of respected study sites. Informed consents were obtained from the study units: household heads, members of focus group discussions and key informants before start of data.
Acknowledgments
The authors acknowledge the farm community, enumerators, Development Agents and health extension workers in respective study sites for their genuine responses and prominent contributions towards accomplishment of this research. Addis Ababa University and Jimma University are acknowledged for their financial and logistic supports. The authors are also thankful to various government and non-governmental organizations for providing relevant secondary data.
Disclosure statement
No potential conflict of interest was reported by the author(s).
Additional information
Funding
Notes on contributors

Mequanent Muche
The corresponding author, Mequanent M. Studied Social Anthropology at Jimma University (MA) in 2016; Rural Development and Agricultural Extension at Haramaya University (MSc) in 2009 and Plant science (BSc) in 2003 in the same university and now he is PhD candidate at Addis Ababa University (College of Development Studies, Center of Rural Development). The author had been working in international NGO (2003 to 2007) and currently, he is academic staff of Jimma University, Ethiopia.
References
- Abadi, N., Techane, A., Girmay, T., Daniel, M., & Bapu, V. 2018. The impact of remittances on household food security: A micro perspective from Tigray, Ethiopia, WIDER Working Paper, No. 2018/40. The United Nations University World Institute for Development Economics Research (UNU-WIDER), Helsinki, https://doi.org/10.35188/UNU-WIDER/2018/482-7
- Abay, K., & Hirvonen, K. (2017). Does market access mitigate the impact of seasonality on child growth? Panel data evidence from northern Ethiopia. The Journal of Development Studies, 53(9), 1414–24. https://doi.org/10.1080/00220388.2016.1251586
- Abebaw, S., & Betru, T. (2019). A review on status and determinants of household food security in Ethiopia. Ethiopian Journal of Environmental Studies and Management, 12(5), 497–508. https://ejesm.org/doi/v12i5.2
- Adams, J. R. H., & Cuecuecha, A. (2010). Remittances, household expenditure and investment in Guatemala. World Development, 38(11), 1626–1641. https://doi.org/10.1016/j.worlddev.2010.03.003
- Addisu BM, K. B. A. (2016). Microfinance commercialization and food security in Ethiopia. Journal of Poverty, Investment and Development, 22, 71–79. https://core.ac.uk/download/pdf/234695421.pdf
- Adugnaw, A., Dagninet, A., & Tejada Moral, M. (2020). Wheat production and marketing in Ethiopia. Review Study, Cogent Food and Agriculture, 6(1), 1778893. https://doi.org/10.1080/23311932.2020.1778893
- Ahmed, U. I., Ying, L., Bashir, M. K., Abid, M., Zulfiqar, F., & Mertens, F. (2017). Status and determinants of small farming households’ food security and role of market access in enhancing food security in rural Pakistan. PLOS ONE, 12(10), e0185466. https://doi.org/10.1371/journal.pone.0185466
- Akukwe, T. I. (2020). Household food security and its determinants in agrarian communities of southeastern Nigeria. Agro-Science Journal of Tropical Agriculture, Food, Environment and Extension, 9(1), 54–60. https://doi.org/10.4314/as.v19i1.9 eI
- Anderson, S., & Elisabeth, F. (2015). – FY 2020.USAID office of food for peace: food security country framework for Ethiopia FY 2016. Food Economy Group.
- Bahru, B. A., Jebena, M. G., Birner, R., & Zeller, M. (2020). Impact of Ethiopia’s productive safety net program on household food security and child nutrition: A marginal structural modeling approach. SSM - Population Health, 12(3), 100660. https://doi.org/10.1016/j.ssmph.2020.100660
- Becquey, E., Martin-Prevel, Y., Traissac, P., Dembele, B., Bambara, A., & Delpeuch, F. (2010). The household food insecurity access scale and an index-member dietary diversity score contribute valid and complementary information on household food insecurity in an urban West-African setting. Journal of Nutrition, 140, 2233–2240. https://doi.org/10.3945/jn.110.125716
- Boero, V., Cafiero, C., Gheri, F., Kepple, A. W., Rosero Moncayo, J., & Viviani, S. 2021. Access to food in 2020. Results of twenty national surveys using the food insecurity experience scale (FIES) [online]. [Retrieved 24 August 2022]: https://doi.org/10.4060/cb5623en
- Chen, C. K., & Hughes, J. (2004). Using ordinal regression model to analyze student satisfaction questionnaire. IR Applications, 1, 1–13. https://eric.ed.gov/?id=ED504366
- Coates, J., Swindale, A., & Bilinsky, P. (2007). Household food insecurity access scale (HFIAS) for measurement of household food access (p. 360/FANTA). FHI Indicator Guide (v.3).
- Creswell, J. W., Klassen, A. C., Plano Clark, V. L., & Smith, K. C. (2011). Best practices for mixed methods research in the health sciences. Office of Behavioral and Social Sciences Research (OBSSR) National Institutes of Health, National Institutes of Health.
- CSA (Central Statistical Authority). 2012. Population and housing census of Ethiopia 2007. Administrative report. Addis Ababa
- CSA (Central Statistics Agency). (2021). Agricultural sample survey 2020/21 (2013 E.C.): Report on area and production of major crops (private peasant holdings, meher season). Volume I. Statistical bulletins Vol. 590 (pp.2-13). Addis Ababa.
- Debeli, C. B., Hailu, W., & Befkadu, M. (2021). Factors affecting household food security in Gumay Woreda of Jimma Zone of Oromia, Ethiopia. International Journal of Economic Behavior and Organization, 9(3), 85–93. https://doi.org/10.11648/j.ijebo.20210903.16
- Efrem, B. S. (2020). Determinants of household food insecurity in rural Ethiopia: Multiple linear regression (classical and Bayesian approaches). International Journal of Theoretical and Applied Mathematics, 6(5), 64–75. https://doi.org/10.11648/j.ijtam.20200605.12
- Eshetu, T., & Young-Bohk, C. (2017). Contribution of small scale irrigation to households income and food security: Evidence from Ketar irrigation scheme, Arsi Zone, Oromiya Region, Ethiopia. African Journal of Business Management, 11(3), 57–68. https://doi.org/10.5897/ajbm2016.8175
- FAO (Food and Agriculture Organization of the United Nations). (2015). Climate change and food security: Risks and responses.
- FAO, IFAD, UNICEF, WFP and WHO. (2021). in brief to the state of food security and nutrition in the world 2021. Transforming food systems for food security, improved nutrition and affordable healthy diets for all. https://doi.org/10.4060/cb5409en
- FAO, IFAD, UNICEF, WFP and WHO. 2022. the state of food security and nutrition in the world. Repurposing food and agricultural policies to make healthy diets more affordable. Rome: FAO. https://doi.org/10.4060/cc0639en
- Fikire, A. H., Zegeye, M. B., & SoonMin, H. (2022). Determinants of rural household food security status in North Shewa Zone, Amhara Region, Ethiopia. Scientific World Journal, 2022, 1–8. https://doi.org/10.1155/2022/9561063
- Guo, B. (2011). Household assets and food security: Evidence from the survey of program dynamics. Journal of Family and Economic Issues, 32(1), 98–110. https://doi.org/10.1007/s10834-010-9194-3
- Holden, S., & Shiferaw, B. (2004). Land degradation, drought and food security in a less-favoured area in the Ethiopian highlands: A bio-economic model with market imperfections. Agricultural Economics, 30(1), 31–49. https://doi.org/10.1111/j.1574-0862.2004.tb00174.x
- ITA (International Trade Administration). 2022. Ethiopia- country commercial guide market overview. [Retrieved 22 August 2022]: https://www.trade.gov/country-commercial-guides/ethiopia-market-overvie
- Jacoby, H. G., & Minten, B. (2009). On measuring the benefits of lower transport costs. Journal of Development Economics, 89(1), 28–38. https://doi.org/10.1016/j.jdeveco.2008.06.004
- James, W., Tim, S., & Leulsegged, K. (2015). Woreda level crop production ranking in Ethiopia. International Food Policy Research Institute (IFPRI), 43.
- Jenaa, P. R., Chichaibelub, B. B., Stellmachera, T., & Grotea, U. (2012). The impact of coffee certification on small-scale producers’ livelihoods: A case study from the Jimma Zone, Ethiopia. Agricultural Economics, 43, 429–440. https://doi.org/10.1111/j.1574-0862.2012.00594.x4
- Jimma Zone Administration Office. 2018. Annual Report
- JZARDO (Jimma Zone Agriculture and Rural Development Office). 2018. Annual report.
- Kleve, S., Bennett, C. J., Davidson, Z. E., Kellow, N. J., McCaffrey, T. A., O’Reilly, S., Enticott, J., Moran, L. J., Harrison, C. L., Teede, H., & Lim, S. (2021). food insecurity prevalence, severity and determinants in Australian households during the COVID-19 pandemic from the perspective of women. Nutrients, 13(12), 4262. https://doi.org/10.3390/nu13124262
- Knuepell, D., Demment, M., & Kaiser, L. (2009). Validation of the household food insecurity access scale in rural Tanzania. Public Health Nutrition, 13(3), 360–367. https://doi.org/10.1017/S1368980009991121
- Kuma, T., Mekdim Dereje, M., Hirvonen, K., & Minten, B. (2019). cash crops and food security: Evidence from Ethiopian smallholder coffee producers. The Journal of Development Studies, 55(6), 1267–1284. https://doi.org/10.1080/00220388.2018.1425396
- Kumar Sahu, A., Das, S., & Hatai, L. (2021). Determinants on household food security among indigenous population of Nagaland, India. Acta Scientific Nutritional Health, 5(2), 146–152. https://doi.org/10.31080/asnh.2020.05.0820
- Lutomia, C. K., Obare, G. A., Kariuki, I. M., Muricho, G. S., & Yildiz, F. (2019). Determinants of gender differences in household food security perceptions in the Western and Eastern regions of Kenya. Cogent Food and Agriculture, 5(1), 1694755. https://doi.org/10.1080/23311932.2019.1694755
- Maes, K. C., Hadley, C., Tesfaye, F., Shifferaw, S., & Tesfaye, Y. A. (2009). Food insecurity among volunteer AIDS caregivers in Addis Ababa, Ethiopia was highly prevalent but buffered from 2008 food crisis. The Journal of Nutrition, 139(9), 1758–1764. https://doi.org/10.3945/jn.109.108548
- McCullagh, P., & Nelder, J. A. (1989). Generalized linear models (2nd) ed.). Chapman and Hall. https://doi.org/10.1007/978-1-4899-3242-6
- Melkamu, A. W. (2015). Ethiopian highlands: Home for Arabica coffee (coffea arabica. In J. Nyssen, E. Adgo, & M. Dessie (Eds.), Book: TrooiLakes 2015: Tropical lakes in a changing environment: Water, land, biology, climate and humans (Vol. L, pp. 58–65). Bahir Dar University.
- Mengistu, D. D., Degaga, D. T., & Tsehay, A. S. (2021). Analyzing the contribution of crop diversification in improving household food security among wheat dominated rural households in Sinana District, Bale Zone, Ethiopia. Agriculture and Food Security, 10(1), 1–15. https://doi.org/10.1186/s40066-020-00280-8
- Mengistu, S. W., Kassie, A. W., & Gonz Lez Fandos, E. (2022). Household level determinants of food insecurity in rural Ethiopia. Journal of Food Quality, 2022, 1–9. https://doi.org/10.1155/2022/3569950
- Mequanent, M., Birara, E., & Tesfalem, K. (2014). Determinants of household food security among Southwest Ethiopia rural households. Food Science and Technology, 2(7), 93–100. https://doi.org/10.13189/fst.2014.020701
- Mitiku, A., Fufa, B., & Tadese, B. (2012). Empirical analysis of the determinants of rural households’ food security in Southern Ethiopia: The case of Shashemene District. Basic Research Journal of Agricultural Science and Review, 1(6), 132–138. https://doi.org/10.140.5.162//handle/123456789/3017
- Mohammed, S., & Mohammed, A. (2021). Determinants of food security: The case of Kurmuk district in Benishangul Gumuz Regional State, Western Ethiopia. International Journal of Natural Resource Ecology and Management, 6(1), 16–26. https://doi.org/10.11648/j.ijnrem.20210601.14
- Mohammed, A., Wassie, S. B., & Teferi, E. T. (2021). Determinants of smallholders’ food security status in Kalu district, Northern Ethiopia. Challenges, 12(2), 17. https://doi.org/10.3390/challe12020017
- Morse, J. M., & Niehaus, L. (2009). Mixed method design: Principles and procedures. Left Coast Press.
- N De, C., D’Haese, M., Vink, N., van Rooyen, C. J., Staelens, L., Schönfeldt, H. C., & D’Haese, L. (2013). Food security in rural areas of Limpopo province, South Africa. Food Security, 5(2), 269–282. https://doi.org/10.1007/s12571-013-0247-y
- Ngema, P. Z., Sibanda, M., & Musemwa, L. (2018). Household food security status and its determinants in Maphumulo local municipality, South Africa. Sustainability, 10(9), 3307. https://doi.org/10.3390/su10093307
- Nour SSO, M., & Abdalla, E. M. (2021). The determinants of food security in Sudan: The case of Kassala state. World Journal of Science, Technology and Sustainable Development, 18(3), 285–302. https://doi.org/10.1108/WJSTSD-10-2020-0084
- Owoo, N. S. (2021). Demographic considerations and food security in Nigeria. Journal of Social and Economic Development, 23(1), 128–167. https://doi.org/10.1007/s40847-020-00116-y
- Pakravan-Charvadeh, M. R., Savari, M., Khan, H. A., Gholamrezai, S., & Flora, C. (2021). Determinants of household vulnerability to food insecurity during COVID-19 lockdown in a mid-term period in Iran. Public Health Nutrition, 24(7), 1619–1628. https://doi.org/10.1017/S1368980021000318
- Rubhara, T. T., Mudhara, M., Oduniyi, O. S., & Antwi, M. A. (2020). Impacts of cash crop production on household food security for smallholder farmers: A case of Shamva district, Zimbabwe. Agriculture, 10(5), 188. https://doi.org/10.3390/agriculture10050188
- Shumeta, Z. 2017. Impact of cooperatives on smallholder coffee producers in southwest Ethiopia. PhD Thesis, Ghent University. Faculty of Bioscience Engineering.
- SPSS. (2017). IBM spss statistics for windows, version 25.0. Released 2017. IBM Corp.
- STATA. (2019). StataCorp. 2019. Stata Statistical Software: Version 16.0. Release (Vol. 16).
- Tewodros, T., & Fikadu, T. (2014). Determinants of households’ food security and coping strategies for food shortfall in Mareko district, Guraghe Zone Southern Ethiopia. Journal of Food Security, 2(3), 92–99. https://doi.org/10.12691/jfs-2-3-4
- Thamaga-Chitja, J. M., Hendriks, S. L., Ortmann, G. F., & Green, M. (2004). Impact of maize storage on rural household food security in Northern Kwazulu-Natal. Journal of Family Ecology and Consumer Sciences, 32. ISSN 0378-5254.
- Tiyou, A., Belachew, T., Alemseged, F., & Biadgilign, S. (2012). Food insecurity and associated factors among HIV-infected individuals receiving highly active antiretroviral therapy in Jimma Zone Southwest Ethiopia. Nutrition Journal, 11(1), 51. https://doi.org/10.1186/1475-2891-11-51
- Tsegaye, G., & Bekele, W. (2010). Farmers’ perceptions of land degradation and determinants of food security at Bilate Watershed, Southern Ethiopia. Ejast, 1(1), 49–62.
- Urago, G. G., & Bozoglu, M. (2022). Literature review on farmers’ access to agricultural credit in Ethiopia. Journal of Agricultural Sciences, 37(2), 301–316. https://doi.org/10.7161/omuanajas.978056
- Usman, M. A., & Callo-Concha, D. (2021). Does market access improve dietary diversity and food security? Evidence from Southwestern Ethiopian smallholder coffee producers. Agricultural and Food Economics, 9(1), 18. https://doi.org/10.1186/s40100-021-00190-8
- Von Braun, J., & Kennedy, E. (1994). Agricultural commercialization, economic development, and nutrition. Johns Hopkins University press.
- WB (The World Bank). 2021. World bank national accounts data, and OECD national accounts data files. [Accessed 25 August 2022]: https://data.worldbank.org/indicator/NY.GDP.PCAP.CD?locations=ET
- Welteji, D., Mohammed, K., & Hussein, K. (2017). The contribution of productive safety net program for food security of the rural households in the case of Bale Zone, Southeast Ethiopia. Agriculture and Food Security, 6(1), 53. https://doi.org/10.1186/s40066-017-0126-4
- Yamane, T. (1967). Statistics: An Introductory Analysis (2nd) ed.). Harper and Row.
- Zarate-Hoyos, G. A. (2004). Consumption and remittances in migrant households: Toward a productive use of remittances. Contemporary Economic Policy, 22(4), 555–565. https://doi.org/10.1093/cep/byh042
- Zeller, M., & Sharma, M. 1998. Rural finance and poverty alleviation. Food Policy Report, No. 8. International Food Policy Research Institute (IFPRI). https://www.ifpri.org/sites/default/files/publications/fpr25.pdf